Span-based Localizing Network for Natural Language Video Localization
Abstract
Given an untrimmed video and a text query, natural language video localization (NLVL) is to locate a matching span from the video that semantically corresponds to the query. Existing solutions formulate NLVL either as a ranking task and apply multimodal matching architecture, or as a regression task to directly regress the target video span. In this work, we address NLVL task with a span-based QA approach by treating the input video as text passage. We propose a video span localizing network (VSLNet), on top of the standard span-based QA framework, to address NLVL. The proposed VSLNet tackles the differences between NLVL and span-based QA through a simple yet effective query-guided highlighting (QGH) strategy. The QGH guides VSLNet to search for matching video span within a highlighted region. Through extensive experiments on three benchmark datasets, we show that the proposed VSLNet outperforms the state-of-the-art methods; and adopting span-based QA framework is a promising direction to solve NLVL.11 1 https://github.com/IsaacChanghau/VSLNet
1 Introduction
Given an untrimmed video, natural language video localization (NLVL) is to retrieve or localize a temporal moment that semantically corresponds to a given language query. An example is shown in Figure 1. As an important vision-language understanding task, NLVL involves both computer vision and natural language processing techniques Krishna et al. 2017; Hendricks et al. 2017; Gao et al. 2018; Le et al. 2019; Yu et al. 2019. Clearly, cross-modal reasoning is essential for NLVL to correctly locate the target moment from a video.
Prior works primarily treat NLVL as a ranking task, which is solved by applying multimodal matching architecture to find the best matching video segment for a given language query Gao et al. 2017; Hendricks et al. 2018; Liu et al. 2018a; Ge et al. 2019; Xu et al. 2019; Chen and Jiang 2019; Zhang et al. 2019. Recently, some works explore to model cross-interactions between video and query, and to regress the temporal locations of target moment directly Yuan et al. 2019b; Lu et al. 2019a. There are also studies to formulate NLVL as a sequence decision making problem and to solve it by reinforcement learning Wang et al. 2019; He et al. 2019.
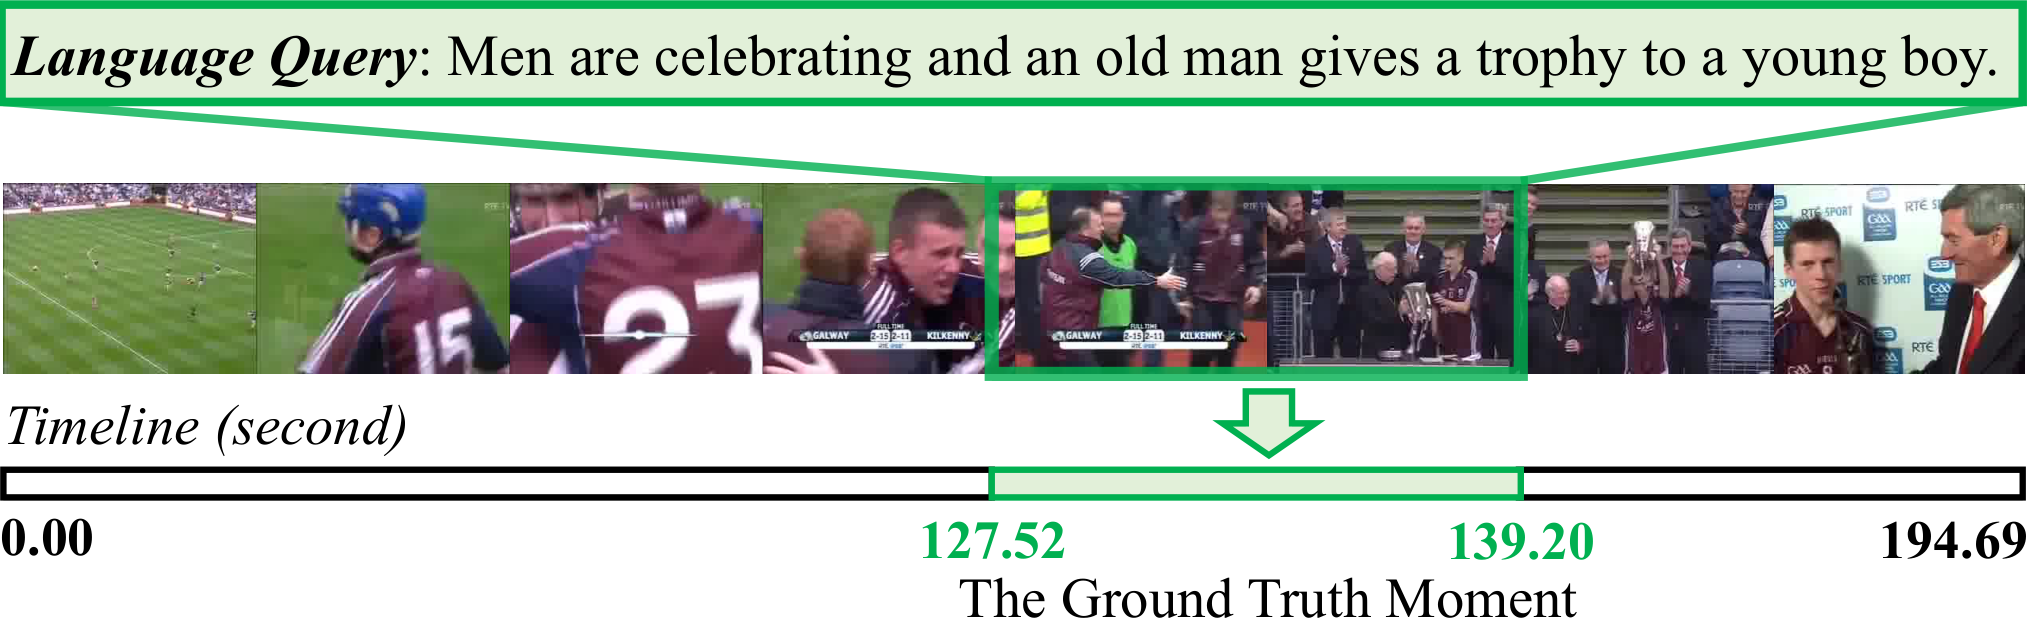
We address the NLVL task from a different perspective. The essence of NLVL is to search for a video moment as the answer to a given language query from an untrimmed video. By treating the video as a text passage, and the target moment as the answer span, NLVL shares significant similarities with span-based question answering (QA) task. The span-based QA framework Seo et al. 2017; Wang et al. 2017; Huang et al. 2018 can be adopted for NLVL. Hence, we attempt to solve this task with a multimodal span-based QA approach.
There are two main differences between traditional text span-based QA and NLVL tasks. First, video is continuous and causal relations between video events are usually adjacent. Natural language, on the other hand, is inconsecutive and words in a sentence demonstrate syntactic structure. For instance, changes between adjacent video frames are usually very small, while adjacent word tokens may carry distinctive meanings. As the result, many events in a video are directly correlated and can even cause one another Krishna et al. 2017. Causalities between word spans or sentences are usually indirect and can be far apart. Second, compared to word spans in text, human is insensitive to small shifting between video frames. In other words, small offsets between video frames do not affect the understanding of video content, but the differences of a few words or even one word could change the meaning of a sentence.
As a baseline, we first solve the NLVL task with a standard span-based QA framework named VSLBase. Specifically, visual features are analogous to that of text passage; the target moment is regarded as the answer span. VSLBase is trained to predict the start and end boundaries of the answer span. Note that VSLBase does not address the two aforementioned major differences between video and natural language. To this end, we propose an improved version named VSLNet (Video Span Localizing Network). VSLNet introduces a Query-Guided Highlighting (QGH) strategy in addition to VSLBase. Here, we regard the target moment and its adjacent contexts as foreground, while the rest as background, i.e., foreground covers a slightly longer span than the answer span. With QGH, VSLNet is guided to search for the target moment within a highlighted region. Through region highlighting, VSLNet well addresses the two differences. First, the longer region provides additional contexts for locating answer span due to the continuous nature of video content. Second, the highlighted region helps the network to focus on subtle differences between video frames, because the search space is reduced compared to the full video.
Experimental results on three benchmark datasets show that adopting span-based QA framework is suitable for NLVL. With a simple network architecture, VSLBase delivers comparable performance to strong baselines. In addition, VSLNet further boosts the performance and achieves the best among all evaluated methods.
2 Related Work
Natural Language Video Localization.
The task of retrieving video segments using language queries was introduced in Hendricks et al. 2017; Gao et al. 2017. Solutions to NLVL need to model the cross-interactions between natural language and video. The early works treat NLVL as a ranking task, and rely on multimodal matching architecture to find the best matching video moment for a language query Gao et al. 2017; Hendricks et al. 2017; Hendricks et al. 2018; Wu and Han 2018; Liu et al. 2018a; Liu et al. 2018b; Xu et al. 2019; Zhang et al. 2019. Although intuitive, these models are sensitive to negative samples. Specifically, they need to dense sample candidate moments to achieve good performance, which leads to low efficiency and lack of flexibility.
Various approaches have been proposed to overcome those drawbacks. Yuan et al. 2019b builds a proposal-free method using BiLSTM and directly regresses temporal locations of target moment. Lu et al. 2019a proposes a dense bottom-up framework, which regresses the distances to start and end boundaries for each frame in target moment, and select the ones with highest confidence as final result. Yuan et al. 2019a proposes a semantic conditioned dynamic modulation for better correlating sentence related video contents over time, and establishing a precise matching relationship between sentence and video. There are also works Wang et al. 2019; He et al. 2019 that formulate NLVL as a sequence decision making problem, and adopt reinforcement learning based approaches, to progressively observe candidate moments conditioned on language query.
Most similar to our work are Chen et al. 2019 and Ghosh et al. 2019, as both studies are considered using the concept of question answering to address NLVL. However, both studies do not explain the similarity and differences between NLVL and traditional span-based QA, and they do not adopt the standard span-based QA framework. In our study, VSLBase adopts standard span-based QA framework; and VSLNet explicitly addresses the differences between NLVL and traditional span-based QA tasks.
Span-based Question Answering.
Span-based QA has been widely studied in past years. Wang and Jiang 2017 combines match-LSTM Wang and Jiang 2016 and Pointer-Net Vinyals et al. 2015 to estimate boundaries of the answer span. BiDAF Seo et al. 2017 introduces bi-directional attention to obtain query-aware context representation. Xiong et al. 2017 proposes a coattention network to capture the interactions between context and query. R-Net Wang et al. 2017 integrates mutual and self attentions into RNN encoder for feature refinement. QANet Yu et al. 2018 leverages a similar attention mechanism in a stacked convolutional encoder to improve performance. FusionNet Huang et al. 2018 presents a full-aware multi-level attention to capture complete query information. By treating input video as text passage, the above frameworks are all applicable to NLVL in principle. However, these frameworks are not designed to consider the differences between video and text passage. Their modeling complexity arises from the interactions between query and text passage, both are text. In our solution, VSLBase adopts a simple and standard span-based QA framework, making it easier to model the differences between video and text through adding additional modules. Our VSLNet addresses the differences by introducing the QGH module.
Very recently, pre-trained transformer based language models Devlin et al. 2019; Dai et al. 2019; Liu et al. 2019; Yang et al. 2019 have elevated the performance of span-based QA tasks by a large margin. Meanwhile, similar pre-trained models Sun et al. 2019a; Sun et al. 2019b; Yu and Jiang 2019; Rahman et al. 2019; Nguyen and Okatani 2019; Lu et al. 2019b; Tan and Bansal 2019 are being proposed to learn joint distributions over multimodality sequence of visual and linguistic inputs. Exploring the pre-trained models for NLVL is part of our future work and is out of the scope of this study.

3 Methodology
We now describe how to address NLVL task by adopting a span-based QA framework. We then present VSLBase (Sections 3.2 to 3.4) and VSLNet in detail. Their architectures are shown in Figure 2.
3.1 Span-based QA for NLVL
We denote the untrimmed video as and the language query as , where and are the number of frames and words, respectively. and represent the start and end time of the temporal moment i.e., answer span. To address NLVL with span-based QA framework, its data is transformed into a set of SQuAD style triples Rajpurkar et al. 2016. For each video , we extract its visual features by a pre-trained 3D ConvNet Carreira and Zisserman 2017, where is the number of extracted features. Here, can be regarded as the sequence of word embeddings for a text passage with tokens. Similar to word embeddings, each feature here is a video feature vector.
Since span-based QA aims to predict start and end boundaries of an answer span, the start/end time of a video sequence needs to be mapped to the corresponding boundaries in the visual feature sequence . Suppose the video duration is , the start (end) span index is calculated by , where denotes the rounding operator. During the inference, the predicted span boundary can be easily converted to the corresponding time via .
After transforming moment annotations in NLVL dataset, we obtain a set of triples. Visual features act as the passage with tokens; is the query with tokens, and the answer corresponds to a piece in the passage. Then, the NLVL task becomes to find the correct start and end boundaries of the answer span, and .
3.2 Feature Encoder
We already have visual features . Word embeddings of a text query , , are easily obtainable e.g., GloVe. We project them into the same dimension , and , by two linear layers (see Figure 2(a)). Then we build the feature encoder with a simplified version of the embedding encoder layer in QANet Yu et al. 2018.
Instead of applying a stack of multiple encoder blocks, we use only one encoder block. This encoder block consists of four convolution layers, followed by a multi-head attention layer Vaswani et al. 2017. A feed-forward layer is used to produce the output. Layer normalization Ba et al. 2016 and residual connection He et al. 2016 are applied to each layer. The encoded visual features and word embeddings are as follows:
| (1) | ||||
The parameters of feature encoder are shared by visual features and word embeddings.
3.3 Context-Query Attention
After feature encoding, we use context-query attention (CQA) Seo et al. 2017; Xiong et al. 2017; Yu et al. 2018 to capture the cross-modal interactions between visual and textural features. CQA first calculates the similarity scores, , between each visual feature and query feature. Then context-to-query () and query-to-context () attention weights are computed as:
where and are the row- and column-wise normalization of by SoftMax, respectively. Finally, the output of context-query attention is written as:
| (2) |
where ; is a single feed-forward layer; denotes element-wise multiplication.
3.4 Conditioned Span Predictor
We construct a conditioned span predictor by using two unidirectional LSTMs and two feed-forward layers, inspired by Ghosh et al. 2019. The main difference between ours and Ghosh et al. 2019 is that we use unidirectional LSTM instead of bidirectional LSTM. We observe that unidirectional LSTM shows similar performance with fewer parameters and higher efficiency. The two LSTMs are stacked so that the LSTM of end boundary can be conditioned on that of start boundary. Then the hidden states of the two LSTMs are fed into the corresponding feed-forward layers to compute the start and end scores:
| (3) | ||||
Here, and denote the scores of start and end boundaries at position ; represents the -th feature in . and denote the weight matrix and bias of the start/end feed-forward layer, respectively. Then, the probability distributions of start and end boundaries are computed by and , and the training objective is defined as:
| (4) |
where represents cross-entropy loss function; and are the labels for the start () and end () boundaries, respectively. During inference, the predicted answer span of a query is generated by maximizing the joint probability of start and end boundaries by:
| (5) | ||||
We have completed the VSLBase architecture (see Figure 2(a)). VSLNet is built on top of VSLBase with QGH, to be detailed next.

3.5 Query-Guided Highlighting
A Query-Guided Highlighting (QGH) strategy is introduced in VSLNet, to address the major differences between text span-based QA and NLVL tasks, as shown in Figure 2(b). With QGH strategy, we consider the target moment as the foreground, and the rest as background, illustrated in Figure 3. The target moment, which is aligned with the language query, starts from and ends at with length . QGH extends the boundaries of the foreground to cover its antecedent and consequent video contents, where the extension ratio is controlled by a hyperparameter . As aforementioned in Introduction, the extended boundary could potentially cover additional contexts and also help the network to focus on subtle differences between video frames.
By assigning to foreground and to background, we obtain a sequence of -, denoted by . QGH is a binary classification module to predict the confidence a visual feature belongs to foreground or background. The structure of QGH is shown in Figure 4. We first encode word features into sentence representation (denoted by ), with self-attention mechanism Bahdanau et al. 2015. Then is concatenated with each feature in as , where . The highlighting score is computed as:
where denotes Sigmoid activation; . The highlighted features are calculated by:
| (6) |
Accordingly, feature in Equation 3 is replaced by in VSLNet to compute . The loss function of query-guided highlighting is formulated as:
| (7) |
VSLNet is trained in an end-to-end manner by minimizing the following loss:
| (8) |
4 Experiments
4.1 Datasets
We conduct experiments on three benchmark datasets: Charades-STA Gao et al. 2017, ActivityNet Caption Krishna et al. 2017, and TACoS Regneri et al. 2013, summarized in Table 1.
Charades-STA is prepared by Gao et al. 2017 based on Charades dataset Sigurdsson et al. 2016. The videos are about daily indoor activities. There are and moment annotations for training and test, respectively.
ActivityNet Caption contains about k videos taken from ActivityNet Heilbron et al. 2015. We follow the setup in Yuan et al. 2019b, leading to moment annotations for training, and annotations for test.
TACoS is selected from MPII Cooking Composite Activities dataset Rohrbach et al. 2012. We follow the setting in Gao et al. 2017, where , and annotations are used for training, validation and test, respectively.
| Dataset | Domain | # Videos (train/val/test) | # Annotations | |||||
|---|---|---|---|---|---|---|---|---|
| Charades-STA | Indoors | |||||||
| ActivityNet Cap | Open | |||||||
| TACoS | Cooking |
4.2 Experimental Settings
Metrics.
We adopt “” and “mIoU” as the evaluation metrics, following Gao et al. 2017; Liu et al. 2018a; Yuan et al. 2019b. The “” denotes the percentage of language queries having at least one result whose Intersection over Union (IoU) with ground truth is larger than in top-n retrieved moments. “mIoU” is the average IoU over all testing samples. In our experiments, we use and .
Implementation.
For language query , we use d GloVe Pennington et al. 2014 vectors to initialize each lowercase word; the word embeddings are fixed during training. For untrimmed video , we downsample frames and extract RGB visual features using the 3D ConvNet which was pre-trained on Kinetics dataset Carreira and Zisserman 2017. We set the dimension of all the hidden layers in the model as 128; the kernel size of convolution layer is ; the head size of multi-head attention is . For all datasets, the model is trained for epochs with batch size of and early stopping strategy. Parameter optimization is performed by Adam Kingma and Ba 2015 with learning rate of , linear decay of learning rate and gradient clipping of . Dropout Srivastava et al. 2014 of is applied to prevent overfitting.
4.3 Comparison with State-of-the-Arts
We compare VSLBase and VSLNet with the following state-of-the-arts: CTRL Gao et al. 2017, ACRN Liu et al. 2018a, TGN Chen et al. 2018, ACL-K Ge et al. 2019, QSPN Xu et al. 2019, SAP Chen and Jiang 2019, MAN Zhang et al. 2019, SM-RL Wang et al. 2019, RWM-RL He et al. 2019, L-Net Chen et al. 2019, ExCL Ghosh et al. 2019, ABLR Yuan et al. 2019b and DEBUG Lu et al. 2019a. In all result tables, the scores of compared methods are reported in the corresponding works. Best results are in bold and second best underlined.
| Model | mIoU | |||
| 3D ConvNet without fine-tuning as visual feature extractor | ||||
| CTRL | - | - | ||
| ACL-K | - | - | ||
| QSPN | - | |||
| SAP | - | - | ||
| SM-RL | - | - | ||
| RWM-RL | - | - | - | |
| MAN | - | - | ||
| DEBUG | ||||
| VSLBase | ||||
| VSLNet | ||||
| 3D ConvNet with fine-tuning on Charades dataset | ||||
| ExCL | - | |||
| VSLBase | ||||
| VSLNet | ||||
| Model | mIoU | |||
|---|---|---|---|---|
| TGN | - | - | ||
| ABLR | - | |||
| RWM-RL | - | - | - | |
| QSPN | - | |||
| ExCL∗ | - | |||
| DEBUG | - | |||
| VSLBase | ||||
| VSLNet |
| Model | mIoU | |||
|---|---|---|---|---|
| CTRL | - | - | ||
| TGN | - | - | ||
| ACRN | - | - | ||
| ABLR | - | |||
| ACL-K | - | - | ||
| L-Net | - | - | - | |
| SAP | - | - | - | |
| SM-RL | - | - | ||
| DEBUG | - | |||
| VSLBase | ||||
| VSLNet |
| Module | mIoU | |||
|---|---|---|---|---|
| BiLSTM + CAT | ||||
| CMF + CAT | ||||
| BiLSTM + CQA | ||||
| CMF + CQA |
The results on Charades-STA are summarized in Table 2. For fair comparison with ExCL, we follow the same setting in ExCL to use the 3D ConvNet fine-tuned on Charades dataset as visual feature extractor. Observed that VSLNet significantly outperforms all baselines by a large margin over all metrics. It is worth noting that the performance improvements of VSLNet are more significant under more strict metrics. For instance, VSLNet achieves improvement in versus in , compared to MAN. Without query-guided highlighting, VSLBase outperforms all compared baselines over , which shows adopting span-based QA framework is promising for NLVL. Moreover, VSLNet benefits from visual feature fine-tuning, and achieves state-of-the-art results on this dataset.
Table 3 summarizes the results on ActivityNet Caption dataset. Note that this dataset requires YouTube clips to be downloaded online. We have missing videos, while ExCL reports missing videos. Strictly speaking, the results reported in this table are not directly comparable. Despite that, VSLNet is superior to ExCL with and absolute improvements over and , respectively. Meanwhile, VSLNet surpasses other baselines.
| Module | CAT | CQA | |
|---|---|---|---|
| BiLSTM | |||
| CMF | |||
| - |
Similar observations hold on TACoS dataset. Reported in Table 4, VSLNet achieves new state-of-the-art performance over all evaluation metrics. Without QGH, VSLBase shows comparable performance with baselines.

4.4 Ablation Studies
We conduct ablative experiments to analyze the importance of feature encoder and context-query attention in our approach. We also investigate the impact of extension ratio (see Figure 3) in query-guided highlighting (QGH). Finally we visually show the effectiveness of QGH in VSLNet, and discuss the weaknesses of VSLBase and VSLNet.
4.4.1 Module Analysis
We study the effectiveness of our feature encoder and context-query attention (CQA) by replacing them with other modules. Specifically, we use bidirectional LSTM (BiLSTM) as an alternative feature encoder. For context-query attention, we replace it by a simple method (named CAT) which concatenates each visual feature with max-pooled query feature.
Recall that our feature encoder consists of Convolution + Multi-head attention + Feed-forward layers (see Section 3.2), we name it CMF. With the alternatives, we now have 4 combinations, listed in Table 5. Observe from the results, CMF shows stable superiority over CAT on all metrics regardless of other modules; CQA surpasses CAT whichever feature encoder is used. This study indicates that CMF and CQA are more effective.
Table 6 reports performance gains of different modules over “” metric. The results shows that replacing CAT with CQA leads to larger improvements, compared to replacing BiLSTM by CMF. This observation suggests CQA plays a more important role in our model. Specifically, keeping CQA, the absolute gain is by replacing encoder module. Keeping CMF, the gain of replacing attention module is .
Figure 5 visualizes the matrix of similarity score between visual and language features in the context-query attention (CQA) module ( in Section 3.3). This figure shows visual features are more relevant to the verbs and their objects in the query sentence. For example, the similarity scores between visual features and “eating” (or “sandwich”) are higher than that of other words. We believe that verbs and their objects are more likely to be used to describe video activities. Our observation is consistent with Ge et al. 2019, where verb-object pairs are extracted as semantic activity concepts. In contrast, these concepts are automatically captured by the CQA module in our method.


4.4.2 The Impact of Extension Ratio in QGH
We now study the impact of extension ratio in query-guided highlighting module on Charades-STA dataset. We evaluated different values of from to in experiments. represents no answer span extension, and means that the entire video is regarded as foreground.
The results for various ’s are plotted in Figure 6. It shows that query-guided highlighting consistently contributes to performance improvements, regardless of values, i.e., from to .
Along with raises, the performance of VSLNet first increases and then gradually decreases. The optimal performance appears between and over all metrics.
Note that, when , which is equivalent to no region is highlighted as a coarse region to locate target moment, VSLNet remains better than VSLBase. Shown in Figure 4, when , QGH effectively becomes a straightforward concatenation of sentence representation with each of visual features. The resultant feature remains helpful for capturing semantic correlations between vision and language. In this sense, this function can be regarded as an approximation or simulation of the traditional multimodal matching strategy Hendricks et al. 2017; Gao et al. 2017; Liu et al. 2018a.
4.4.3 Qualitative Analysis
Figure 7 shows the histograms of predicted results on test sets of Charades-STA and ActivityNet Caption datasets. Results show that VSLNet beats VSLBase by having more samples in the high IoU ranges, e.g., on Charades-STA dataset. More predicted results of VSLNet are distributed in the high IoU ranges for ActivityNet Caption dataset. This result demonstrates the effectiveness of the query-guided highlighting (QGH) strategy.
We show two examples in Figures 8(a) and 8(b) from Charades-STA and ActivityNet Caption datasets, respectively. From the two figures, the localized moments by VSLNet are closer to ground truth than that by VSLBase. Meanwhile, the start and end boundaries predicted by VSLNet are roughly constrained in the highlighted regions , computed by QGH.


We further study the error patterns of predicted moment lengths, as shown in Figure 9. The differences between moment lengths of ground truths and predicted results are measured. A positive length difference means the predicted moment is longer than the corresponding ground truth, while a negative means shorter. Figure 9 shows that VSLBase tends to predict longer moments, e.g., more samples with length error larger than seconds in Charades-STA or 30 seconds in ActivityNet. On the contrary, constrained by QGH, VSLNet tends to predict shorter moments, e.g., more samples with length error smaller than seconds in Charades-STA or seconds in ActivityNet Caption. This observation is helpful for future research on adopting span-based QA framework for NLVL.
In addition, we also exam failure cases (with IoU predicted by VSLNet lower than ) shown in Figure 10. In the first case, as illustrated by Figure 10(a), we observe an action that a person turns towards to the lamp and places an item there. The QGH falsely predicts the action as the beginning of the moment ”turns off the light”. The second failure case involves multiple actions in a query, as shown in Figure 10(b). QGH successfully highlights the correct region by capturing the temporal information of two different action descriptions in the given query. However, it assigns “pushes” with higher confidence score than “grabs”. Thus, VSLNet only captures the region corresponding to the “pushes” action, due to its confidence score.
5 Conclusion
By considering a video as a text passage, we solve the NLVL task with a multimodal span-based QA framework. Through experiments, we show that adopting a standard span-based QA framework, VSLBase, effectively addresses NLVL problem. However, there are two major differences between video and text. We further propose VSLNet, which introduces a simple and effective strategy named query-guided highlighting, on top of VSLBase. With QGH, VSLNet is guided to search for answers within a predicted coarse region. The effectiveness of VSLNet (and even VSLBase) suggest that it is promising to explore span-based QA framework to address NLVL problems.
Acknowledgments
This research is supported by the Agency for Science, Technology and Research (A*STAR) under its AME Programmatic Funding Scheme (Project #A18A1b0045 and #A18A2b0046).
References
- Ba et al. (2016) Jimmy Lei Ba, Jamie Ryan Kiros, and Geoffrey E Hinton. 2016. Layer normalization. arXiv preprint arXiv:1607.06450.
- Bahdanau et al. (2015) Dzmitry Bahdanau, Kyunghyun Cho, and Yoshua Bengio. 2015. Neural machine translation by jointly learning to align and translate. In International Conference on Learning Representations.
- Carreira and Zisserman (2017) João Carreira and Andrew Zisserman. 2017. Quo vadis, action recognition? a new model and the kinetics dataset. In IEEE Conference on Computer Vision and Pattern Recognition, pages 4724–4733.
- Chen et al. (2018) Jingyuan Chen, Xinpeng Chen, Lin Ma, Zequn Jie, and Tat-Seng Chua. 2018. Temporally grounding natural sentence in video. In Proceedings of the 2018 Conference on Empirical Methods in Natural Language Processing, pages 162–171. Association for Computational Linguistics.
- Chen et al. (2019) Jingyuan Chen, Lin Ma, Xinpeng Chen, Zequn Jie, and Jiebo Luo. 2019. Localizing natural language in videos. In Proceedings of the AAAI Conference on Artificial Intelligence, volume 33, pages 8175–8182.
- Chen and Jiang (2019) Shaoxiang Chen and Yu-Gang Jiang. 2019. Semantic proposal for activity localization in videos via sentence query. In Proceedings of the AAAI Conference on Artificial Intelligence, volume 33, pages 8199–8206.
- Dai et al. (2019) Zihang Dai, Zhilin Yang, Yiming Yang, Jaime Carbonell, Quoc Le, and Ruslan Salakhutdinov. 2019. Transformer-XL: Attentive language models beyond a fixed-length context. In Proceedings of the 57th Annual Meeting of the Association for Computational Linguistics, pages 2978–2988. Association for Computational Linguistics.
- Devlin et al. (2019) Jacob Devlin, Ming-Wei Chang, Kenton Lee, and Kristina Toutanova. 2019. BERT: Pre-training of deep bidirectional transformers for language understanding. In Proceedings of the 2019 Conference of the North American Chapter of the Association for Computational Linguistics: Human Language Technologies, pages 4171–4186. Association for Computational Linguistics.
- Gao et al. (2018) Jiyang Gao, Runzhou Ge, Kan Chen, and Ramakant Nevatia. 2018. Motion-appearance co-memory networks for video question answering. Proceedings of the IEEE Conference on Computer Vision and Pattern Recognition, pages 6576–6585.
- Gao et al. (2017) Jiyang Gao, Chen Sun, Zhenheng Yang, and Ramakant Nevatia. 2017. Tall: Temporal activity localization via language query. In IEEE International Conference on Computer Vision, pages 5277–5285.
- Ge et al. (2019) Runzhou Ge, Jiyang Gao, Kan Chen, and Ram Nevatia. 2019. Mac: Mining activity concepts for language-based temporal localization. In IEEE Winter Conference on Applications of Computer Vision, pages 245–253.
- Ghosh et al. (2019) Soham Ghosh, Anuva Agarwal, Zarana Parekh, and Alexander Hauptmann. 2019. ExCL: Extractive Clip Localization Using Natural Language Descriptions. In Proceedings of the 2019 Conference of the North American Chapter of the Association for Computational Linguistics: Human Language Technologies, pages 1984–1990. Association for Computational Linguistics.
- He et al. (2019) Dongliang He, Xiang Zhao, Jizhou Huang, Fu Li, Xiao Liu, and Shilei Wen. 2019. Read, watch, and move: Reinforcement learning for temporally grounding natural language descriptions in videos. In Proceedings of the AAAI Conference on Artificial Intelligence, volume 33, pages 8393–8400.
- He et al. (2016) Kaiming He, Xiangyu Zhang, Shaoqing Ren, and Jian Sun. 2016. Deep residual learning for image recognition. In Proceedings of the IEEE conference on computer vision and pattern recognition, pages 770–778.
- Heilbron et al. (2015) F. C. Heilbron, V. Escorcia, B. Ghanem, and J. C. Niebles. 2015. Activitynet: A large-scale video benchmark for human activity understanding. In IEEE Conference on Computer Vision and Pattern Recognition, pages 961–970.
- Hendricks et al. (2018) Lisa Anne Hendricks, Oliver Wang, Eli Shechtman, Josef Sivic, Trevor Darrell, and Bryan Russell. 2018. Localizing moments in video with temporal language. In Proceedings of the 2018 Conference on Empirical Methods in Natural Language Processing, pages 1380–1390. Association for Computational Linguistics.
- Hendricks et al. (2017) Lisa Anne Hendricks, Oliver Wang, Eli Shechtman, Josef Sivic, Trevor Darrell, and Bryan C. Russell. 2017. Localizing moments in video with natural language. In 2017 IEEE International Conference on Computer Vision (ICCV), pages 5804–5813.
- Huang et al. (2018) Hsin-Yuan Huang, Chenguang Zhu, Yelong Shen, and Weizhu Chen. 2018. Fusionnet: Fusing via fully-aware attention with application to machine comprehension. In International Conference on Learning Representations.
- Kingma and Ba (2015) Diederik P. Kingma and Jimmy Ba. 2015. Adam: A method for stochastic optimization. In International Conference on Learning Representations.
- Krishna et al. (2017) R. Krishna, K. Hata, F. Ren, L. Fei-Fei, and J. C. Niebles. 2017. Dense-captioning events in videos. In IEEE International Conference on Computer Vision, pages 706–715.
- Le et al. (2019) Hung Le, Doyen Sahoo, Nancy Chen, and Steven Hoi. 2019. Multimodal transformer networks for end-to-end video-grounded dialogue systems. In Proceedings of the 57th Annual Meeting of the Association for Computational Linguistics, pages 5612–5623. Association for Computational Linguistics.
- Liu et al. (2018a) Meng Liu, Xiang Wang, Liqiang Nie, Xiangnan He, Baoquan Chen, and Tat-Seng Chua. 2018a. Attentive moment retrieval in videos. In The 41st International ACM SIGIR Conference on Research & Development in Information Retrieval, pages 15–24. Association for Computing Machinery.
- Liu et al. (2018b) Meng Liu, Xiang Wang, Liqiang Nie, Qi Tian, Baoquan Chen, and Tat-Seng Chua. 2018b. Cross-modal moment localization in videos. In Proceedings of the 26th ACM International Conference on Multimedia, pages 843–851. Association for Computing Machinery.
- Liu et al. (2019) Yinhan Liu, Myle Ott, Naman Goyal, Jingfei Du, Mandar Joshi, Danqi Chen, Omer Levy, Mike Lewis, Luke Zettlemoyer, and Veselin Stoyanov. 2019. Roberta: A robustly optimized bert pretraining approach. arXiv preprint arXiv:1907.11692.
- Lu et al. (2019a) Chujie Lu, Long Chen, Chilie Tan, Xiaolin Li, and Jun Xiao. 2019a. DEBUG: A dense bottom-up grounding approach for natural language video localization. In Proceedings of the 2019 Conference on Empirical Methods in Natural Language Processing and the 9th International Joint Conference on Natural Language Processing, pages 5147–5156. Association for Computational Linguistics.
- Lu et al. (2019b) Jiasen Lu, Dhruv Batra, Devi Parikh, and Stefan Lee. 2019b. Vilbert: Pretraining task-agnostic visiolinguistic representations for vision-and-language tasks. In Advances in Neural Information Processing Systems, pages 13–23. Curran Associates, Inc.
- Nguyen and Okatani (2019) Duy-Kien Nguyen and Takayuki Okatani. 2019. Multi-task learning of hierarchical vision-language representation. In Proceedings of the IEEE Conference on Computer Vision and Pattern Recognition, pages 10492–10501.
- Pennington et al. (2014) Jeffrey Pennington, Richard Socher, and Christopher Manning. 2014. Glove: Global vectors for word representation. In Proceedings of the 2014 Conference on Empirical Methods in Natural Language Processing (EMNLP), pages 1532–1543. Association for Computational Linguistics.
- Rahman et al. (2019) Wasifur Rahman, Md Kamrul Hasan, Amir Zadeh, Louis-Philippe Morency, and Mohammed Ehsan Hoque. 2019. M-bert: Injecting multimodal information in the bert structure. arXiv preprint arXiv:1908.05787.
- Rajpurkar et al. (2016) Pranav Rajpurkar, Jian Zhang, Konstantin Lopyrev, and Percy Liang. 2016. SQuAD: 100,000+ questions for machine comprehension of text. In Proceedings of the 2016 Conference on Empirical Methods in Natural Language Processing, pages 2383–2392. Association for Computational Linguistics.
- Regneri et al. (2013) Michaela Regneri, Marcus Rohrbach, Dominikus Wetzel, Stefan Thater, Bernt Schiele, and Manfred Pinkal. 2013. Grounding action descriptions in videos. Transactions of the Association for Computational Linguistics, 1:25–36.
- Rohrbach et al. (2012) Marcus Rohrbach, Michaela Regneri, Mykhaylo Andriluka, Sikandar Amin, Manfred Pinkal, and Bernt Schiele. 2012. Script data for attribute-based recognition of composite activities. In Proceedings of the 12th European Conference on Computer Vision. Springer Berlin Heidelberg.
- Seo et al. (2017) Minjoon Seo, Aniruddha Kembhavi, Ali Farhadi, and Hannaneh Hajishirzi. 2017. Bidirectional attention flow for machine comprehension. In International Conference on Learning Representations.
- Sigurdsson et al. (2016) Gunnar A. Sigurdsson, Gül Varol, Xiaolong Wang, Ali Farhadi, Ivan Laptev, and Abhinav Gupta. 2016. Hollywood in homes: Crowdsourcing data collection for activity understanding. In European Conference on Computer Vision (ECCV), pages 510–526. Springer International Publishing.
- Srivastava et al. (2014) Nitish Srivastava, Geoffrey Hinton, Alex Krizhevsky, Ilya Sutskever, and Ruslan Salakhutdinov. 2014. Dropout: A simple way to prevent neural networks from overfitting. Journal of Machine Learning Research, 15(56):1929–1958.
- Sun et al. (2019a) Chen Sun, Fabien Baradel, Kevin Murphy, and Cordelia Schmid. 2019a. Contrastive bidirectional transformer for temporal representation learning. arXiv preprint arXiv:1906.05743.
- Sun et al. (2019b) Chen Sun, Austin Myers, Carl Vondrick, Kevin Murphy, and Cordelia Schmid. 2019b. Videobert: A joint model for video and language representation learning. In 2019 IEEE International Conference on Computer Vision (ICCV).
- Tan and Bansal (2019) Hao Tan and Mohit Bansal. 2019. LXMERT: Learning cross-modality encoder representations from transformers. In Proceedings of the 2019 Conference on Empirical Methods in Natural Language Processing and the 9th International Joint Conference on Natural Language Processing (EMNLP-IJCNLP), pages 5099–5110. Association for Computational Linguistics.
- Vaswani et al. (2017) Ashish Vaswani, Noam Shazeer, Niki Parmar, Jakob Uszkoreit, Llion Jones, Aidan N Gomez, Ł ukasz Kaiser, and Illia Polosukhin. 2017. Attention is all you need. In Advances in Neural Information Processing Systems, pages 5998–6008. Curran Associates, Inc.
- Vinyals et al. (2015) Oriol Vinyals, Meire Fortunato, and Navdeep Jaitly. 2015. Pointer networks. In Advances in Neural Information Processing Systems, pages 2692–2700. Curran Associates, Inc.
- Wang and Jiang (2016) Shuohang Wang and Jing Jiang. 2016. Learning natural language inference with LSTM. In Proceedings of the 2016 Conference of the North American Chapter of the Association for Computational Linguistics: Human Language Technologies, pages 1442–1451. Association for Computational Linguistics.
- Wang and Jiang (2017) Shuohang Wang and Jing Jiang. 2017. Machine comprehension using match-lstm and answer pointer. In International Conference on Learning Representations.
- Wang et al. (2019) Weining Wang, Yan Huang, and Liang Wang. 2019. Language-driven temporal activity localization: A semantic matching reinforcement learning model. In Proceedings of the IEEE Conference on Computer Vision and Pattern Recognition, pages 334–343.
- Wang et al. (2017) Wenhui Wang, Nan Yang, Furu Wei, Baobao Chang, and Ming Zhou. 2017. Gated self-matching networks for reading comprehension and question answering. In Proceedings of the 55th Annual Meeting of the Association for Computational Linguistics, pages 189–198. Association for Computational Linguistics.
- Wu and Han (2018) Aming Wu and Yahong Han. 2018. Multi-modal circulant fusion for video-to-language and backward. In Proceedings of the Twenty-Seventh International Joint Conference on Artificial Intelligence, IJCAI-18, pages 1029–1035. International Joint Conferences on Artificial Intelligence Organization.
- Xiong et al. (2017) Caiming Xiong, Victor Zhong, and Richard Socher. 2017. Dynamic coattention networks for question answering. In International Conference on Learning Representations.
- Xu et al. (2019) Huijuan Xu, Kun He, Bryan A. Plummer, L. Sigal, Stan Sclaroff, and Kate Saenko. 2019. Multilevel language and vision integration for text-to-clip retrieval. In Proceedings of the AAAI Conference on Artificial Intelligence, volume 33, pages 9062–9069.
- Yang et al. (2019) Zhilin Yang, Zihang Dai, Yiming Yang, Jaime Carbonell, Russ R Salakhutdinov, and Quoc V Le. 2019. Xlnet: Generalized autoregressive pretraining for language understanding. In Advances in Neural Information Processing Systems 32, pages 5754–5764. Curran Associates, Inc.
- Yu et al. (2018) Adams Wei Yu, David Dohan, Quoc Le, Thang Luong, Rui Zhao, and Kai Chen. 2018. Fast and accurate reading comprehension by combining self-attention and convolution. In International Conference on Learning Representations.
- Yu and Jiang (2019) Jianfei Yu and Jing Jiang. 2019. Adapting bert for target-oriented multimodal sentiment classification. In Proceedings of the Twenty-Eighth International Joint Conference on Artificial Intelligence, IJCAI-19, pages 5408–5414. International Joint Conferences on Artificial Intelligence Organization.
- Yu et al. (2019) Zhou Yu, Dejing Xu, Jun Yu, Ting Yu, Zhou Zhao, Yueting Zhuang, and Dacheng Tao. 2019. Activitynet-qa: A dataset for understanding complex web videos via question answering. In Proceedings of the AAAI Conference on Artificial Intelligence, volume 33, pages 9127–9134.
- Yuan et al. (2019a) Yitian Yuan, Lin Ma, Jingwen Wang, Wei Liu, and Wenwu Zhu. 2019a. Semantic conditioned dynamic modulation for temporal sentence grounding in videos. In Advances in Neural Information Processing Systems, pages 536–546. Curran Associates, Inc.
- Yuan et al. (2019b) Yitian Yuan, Tao Mei, and Wenwu Zhu. 2019b. To find where you talk: Temporal sentence localization in video with attention based location regression. In Proceedings of the AAAI Conference on Artificial Intelligence, volume 33, pages 9159–9166.
- Zhang et al. (2019) Da Zhang, Xiyang Dai, Xin Wang, Yuan-Fang Wang, and Larry S Davis. 2019. Man: Moment alignment network for natural language moment retrieval via iterative graph adjustment. In Proceedings of the IEEE Conference on Computer Vision and Pattern Recognition, pages 1247–1257.