The ALPINE-ALMA [CII] survey: Dust attenuation properties and obscured star formation at
Abstract
We present dust attenuation properties of spectroscopically confirmed star forming galaxies on the main sequence at a redshift of . Our analyses are based on the far infrared continuum observations of 118 galaxies at rest-frame obtained with the Atacama Large Millimeter Array (ALMA) Large Program to INvestigate [CII] at Early times (ALPINE). We study the connection between the ultraviolet (UV) spectral slope (), stellar mass (), and infrared excess (IRX). Twenty-three galaxies are individually detected in the continuum at significance. We perform a stacking analysis using both detections and nondetections to study the average dust attenuation properties at . The individual detections and stacks show that the IRX- relation at is consistent with a steeper dust attenuation curve than typically found at lower redshifts (). The attenuation curve is similar to or even steeper than that of the extinction curve of the Small Magellanic Cloud (SMC). This systematic change of the IRX- relation as a function of redshift suggests an evolution of dust attenuation properties at . Similarly, we find that our galaxies have lower IRX values, up to on average, at a fixed mass compared to previously studied IRX- relations at , albeit with significant scatter. This implies a lower obscured fraction of star formation than at lower redshifts. Our results suggest that dust properties of UV-selected star forming galaxies at are characterised by (i) a steeper attenuation curve than at , and (ii) a rapidly decreasing dust obscured fraction of star formation as a function of redshift. Nevertheless, even among this UV-selected sample, massive galaxies () at already exhibit an obscured fraction of star formation of , indicating a rapid build-up of dust during the epoch of reionization.
Key Words.
Galaxies: high-redshift – Galaxies: ISM – ISM: dust, extinction1 Introduction
Over the past decades, extragalactic surveys have provided large observational data of galaxies, covering wide wavelength ranges from the rest-frame ultraviolet (UV) to the rest-frame far-infrared (FIR). These systematic, panchromatic observations have enabled the connection of the build-up of galaxies from the very early stages of their formation at high-redshift to the matured population in the local Universe. In particular, the cosmic star formation rate density (SFRD) is found to increase at a rapid rate until , followed by a smooth and slow decline by an order of magnitude until the present day Universe (Wilkins et al. 2008; Madau & Dickinson 2014; Bouwens et al. 2015; Oesch et al. 2018, e.g.,). While great progress has been made to flesh out this overall picture, the measurement of the total SFRD at is still uncertain due to uncertain dust correction factors.
The star formation rates (SFRs) of galaxies are typically estimated using the UV emission from massive stars that have a short () lifetime. Several studies provide empirical relations to estimate the SFR directly from the UV continuum or from emission lines by atoms ionised by the UV emission (Kennicutt 1998; Kennicutt & Evans 2012; Madau & Dickinson 2014; Wilkins et al. 2019, e.g.,). As the UV emission is highly sensitive to dust attenuation, it needs to be corrected to estimate the total intrinsic star formation activity (Calzetti et al. 2000; Salim & Narayanan 2020). Thus, an understanding of the dust attenuation properties as a function of redshift and other galaxy properties is one of the most important ingredients to obtain accurate SFRs, and thus to gain an accurate census of galaxy build up across cosmic history.
Absorbed UV photons heat the dust grains, which in turn re-emit the energy as thermal emission at far-infrared (FIR) wavelengths. To correct for the absorbed UV emission, several empirical relations have been established between the dust attenuation and its FIR re-emission. Of particular importance is the relation between the infrared excess (IRX) and the UV spectral slope (: ). This was calibrated using local starburst galaxies (e.g., Meurer et al. 1999, hereafter M99) and is routinely used in the literature to estimate the dust attenuation from high-redshift galaxies, based on the measured UV spectral colors alone.
The relation between IRX and stellar mass () is another tool that relates the dust attenuation and stellar masses of galaxies. The stellar mass of galaxies reflects their past star formation activity, which in turn is responsible for producing dust particles. Therefore, the stellar mass is expected to correlate with the dust content of the interstellar medium (ISM), as shown by observations (Heinis et al. 2014; Santini et al. 2014; Pannella et al. 2015; Bouwens et al. 2016; Whitaker et al. 2017; Fudamoto et al. 2020; Álvarez-Márquez et al. 2016; Álvarez-Márquez et al. 2019, e.g.,), and suggested by simulations (Graziani et al. 2020, e.g.,).
Both the IRX- and the IRX- relations are well studied from to , over which most authors find no significant evolution for ensemble averages (Heinis et al. 2014; Pannella et al. 2015; Bouwens et al. 2016; Koprowski et al. 2018; Koprowski et al. 2020; Álvarez-Márquez et al. 2016; Álvarez-Márquez et al. 2019; Fudamoto et al. 2017; Fudamoto et al. 2020, e.g.,). However, at , these relations are still uncertain as a statistically significant sample is yet to be obtained. While a few individual galaxies have been detected with luminous dust continuum emission even out to the highest redshifts (Watson et al. 2015; Laporte et al. 2017; Bowler et al. 2018; Hashimoto et al. 2019; Tamura et al. 2019, e.g.,), the general trend from population averages points to rapid changes of the relation to lower IRX values at (Capak et al. 2015; Bouwens et al. 2016; Smit et al. 2018, e.g.,). In particular, using a sample of only 10 main-sequence galaxies, Capak et al. 2015 and Barisic et al. 2017 report a redshift evolution of the relation at , which indicates that the IRX of galaxies is lower than expected from the lower-redshift IRX- and IRX- relations. If correct, it implies that the use of the “classical” correction would overestimate the true IR luminosity, and hence also the total SFR. At the same time, the rapid decrease of the IR emission implies that at the fraction of star formation ongoing in obscured environments (i.e., the obscured fraction of star formation) becomes smaller relative to un-obscured star formation. In previous studies, the fraction of obscured star formation as a function of stellar mass was found to be un-changed over the redshift range between (Whitaker et al. 2017), whereas the fainter IR emission found by Capak et al. 2015 suggests a decrease of the obscured fraction in star forming galaxies (see also, Wilkins et al. 2018, for theoretical predictions at ). However, the existing studies at are based only on a handful () of sources, and the results need to be confirmed with a larger sample size. This is the goal of the present paper.
To examine the dust attenuation properties of using a large sample of normal star forming galaxies, we have studied the IRX-, the IRX- relation, and the obscured fraction of star forming galaxies using data from ALMA Large Program to INvestigate CII at Early Times (Le Fèvre et al. 2019; Bethermin et al. 2020; Faisst et al. 2019, ALPINE,). ALPINE is a 70h program to observe the [CII] emission lines and dust continuum of 118 normal star forming galaxies at . The survey provides the largest sample of normal star forming galaxies at , which we here use to study the dust attenuation from a comparison of the IR and UV emission, and to examine how it relates with observable and derived galaxy properties.
This paper is organised as follows: in §2 we describe our sample and observations, and in §3 we presents the methods of our analyses. §4 shows the results on the IRX-/ relations and the obscured fraction of star formation obtained from our sample. Finally, we conclude our study in §5. Throughout this paper, we assume a cosmology with , and the Chabrier (Chabrier 2003) initial mass function (IMF) where applicable.
2 Observations
In this section, we briefly discuss the ALPINE galaxy sample and observations that are relevant to this study. We refer to Le Fèvre et al. 2019, Bethermin et al. 2020, and Faisst et al. 2019 for a complete description of the survey objectives, the ALMA data processing, and the multiwavelength ancillary observations, respectively.
2.1 Sample and ancillary data
ALPINE observed 118 star forming galaxies at (Le Fèvre et al. 2019, see). The targets have secure spectroscopic redshifts from two observation campaigns in the COSMOS (105) and the GOODS-South (13) fields using rest-frame UV emission and/or absorption lines (Le Fèvre et al. 2015; Hasinger et al. 2018).
Using the vast amount of ancillary data available for these fields, we performed SED fitting to estimate SFRs, stellar masses, UV luminosities, UV spectral slopes, and other quantities, as described in detail by Faisst et al. 2019. We adopt these SED-based quantities from Faisst et al. 2019 for this paper.
Two galaxies in the sample are confirmed AGN based on an X-ray detection (Faisst et al. 2019, DEIMOS_COSMOS_845652;) and from deep optical spectroscopy (Grazian et al. 2020, CANDELS_GOODS_14;). As AGNs could outshine the rest-UV emission of stars, we removed these two sources from further analysis. Additionally, a stack of all the Chandra X-ray images of the remaining galaxies showed no detection, confirming that our sample is not significantly AGN-contaminated, on average. While heavily dust-obscured AGNs are not excluded by these rest-UV and X-ray criteria above, they should have little impact on the FIR emission probed by our ALMA data which is dominated by relatively cold dust.
By selection, the galaxies from the ALPINE survey have SFRs and stellar masses, which are consistent with the main-sequence of star formation at (Steinhardt et al. 2014; Schreiber et al. 2015; Faisst et al. 2019, see Fig. 1;). The ranges of stellar mass and total SFR spanned by our targets are and , respectively.
As part of the SED fitting procedure in Faisst et al. 2019, we calculated monochromatic UV luminosities, , without dust attenuation corrections at rest frame Å, and fitted a power-law function () to measure the UV continuum slopes using the wavelength range 1300Å to 2300Å, consistent with previous studies (Bouwens et al. 2016; McLure et al. 2018; Fudamoto et al. 2020, e.g.,). Uncertainties were estimated from Monte Carlo simulations, by perturbing the fluxes of each filter assuming a Gaussian error distribution in the photometric measurement. We used median values as our best fits, and 16th and 84th percentiles as lower and upper uncertainties of the and measurements.
Based on the measurements, we calculated UV-based SFRs without dust attenuation corrections by employing the equation from Madau & Dickinson 2014 converted to a Chabrier IMF as follows
| (1) |
The above conversion provides consistent SFRs with other studies (Kennicutt 1998, e.g.,), within our measurement errors.
2.2 ALMA observations and data reduction
The details of the ALMA observations and the data reduction are presented in Bethermin et al. 2020. In short, ALMA observed our sample between 07 May, 2018 (Cycle 5) and 10 January, 2019 (Cycle 6) using antenna configurations C43-1 and C43-2. The lower side bands were used for both continuum measurements and the [CII] emission line expected from the redshifts, and the upper side bands covered the dust continuum only. The integration times ranged from 15 to 45 minutes, with an average of 22 minutes.
After a basic calibration using the pipeline of the Common Astronomy Software Applications package (McMullin et al. 2007, CASA;), and additional flagging for bad antennae, continuum maps were produced using the line free channels. In particular, we excluded channels within the width of the detected [CII] emission lines (i.e., excluding above of the maximum amplitude assuming a Gaussian profile). When the [CII] emissions have complex morphology (Jones et al. 2020; Ginolfi et al. 2020, e.g., mergers or potential outflow;), the widths may not exclude all components of the [CII] lines. In these cases, we further extended the [CII] line masks by to prevent the [CII] line from contaminating our continuum maps. Using these [CII] masks, we imaged continuum maps using the CASA task TCLEAN with the natural weighting scheme to maximise sensitivity.
The resulting median (minimum - maximum) point-source sensitivities and resolutions are () and 1.1′′(), respectively.
2.3 FIR continuum measurements and detection fractions
As described in Bethermin et al. 2020, the detection threshold used for the FIR continuum is within 2′′ diameters of the UV counterpart position. Signal-to-noise ratios were determined using peak pixels and background RMS. With this conservative approach, the fidelity of our detections is (Bethermin et al. 2020). In total, 23 of our galaxies have continuum detections at this level. We measured flux densities using 2D Gaussian fitting with our customised routine. Flux measurement uncertainties were estimated using a method provided by Condon 1997, which properly accounts for correlated noise as present in interferometric data.
For nondetections, we used upper limits for our analyses. We determined upper limits by searching the maximum flux within 2′′ diameter of the UV counterpart position, and by adding three times the background RMS to that maximum value. These upper limits are more conservative than in most previous works. In particular, these values account for potentially weak continuum signals that are just below the detection threshold (see Bethermin et al. 2020, for a discussion).
Figure 1 summarizes the continuum detections as a function of stellar mass and SFR. Clearly, the detection fractions are strongly mass and SFR dependent. Most of the FIR detected galaxies are massive (), and highly star forming () galaxies. Nevertheless, some galaxies at the massive and the most star forming end did not show significant continuum detections, even though the sensitivity does not largely change. This suggests that the and/or stellar mass alone are not ideal indicators of .
3 Analysis
3.1 estimation from ALMA observations
The total infrared luminosities over the wavelength range of were estimated using the conversion factor from to presented in Bethermin et al. 2020. In particular, Bethermin et al. 2020 constructed a mean stacked continuum FIR SED for ALPINE galaxy analogs in terms of redshift, stellar mass and SFR, using the full multiwavelength dataset available in the COSMOS field (Davidzon et al. 2017). This includes deep Herschel (Lutz et al. 2011; Oliver et al. 2012), AzTEC/ASTE (Aretxaga et al. 2011), and SCUBA2 data (Casey et al. 2013). The mean stacked SED was then fit with a FIR template using the Béthermin et al. 2017 model, which uses an updated version of Magdis et al. 2012 templates based on the evolution of the average dust SEDs. The template has a UV interstellar radiation field , as parameterised in Béthermin et al. 2015. In particular, the template matches a modified black body with a relatively high peak dust temperature () with an additional mid-infrared component that reproduces the Herschel fluxes.
This relatively high dust temperature is consistent with the extrapolation of lower redshift trends (e.g., for ), as reported in several studies (Béthermin et al. 2015; Álvarez-Márquez et al. 2016; Ferrara et al. 2017; Faisst et al. 2017; Schreiber et al. 2018; Fudamoto et al. 2020). We note, however, that we do not have constraints on the FIR SEDs of individual galaxies. If extreme variations of dust temperatures are present within our sample, this will thus introduce a scatter on the derived ALMA continuum to conversion factor. Since we are interested in the population average values, however, we can ignore this scatter and simply adopt the best-fit template to the mean stacked FIR SED as derived in Bethermin et al. 2020.
To derive the values in practice, our template was normalised to the continuum fluxes or upper limits measured at rest-frame , and then integrated over the wavelength range . In this way, the measured monochromatic luminosity at was converted to by (Bethermin et al. 2020). The uncertainties on were derived directly from the flux measurement uncertainties. Based on this and the attenuation uncorrected derived from the optical photometry, we computed the infrared excess as IRX, with the proper uncertainties.
Finally, we converted the to obscured star formation rates by employing the equation from Madau & Dickinson 2014 converted to the Chabrier IMF as follows
| (2) |
which is consistent with the values derived in Kennicutt 1998.
3.2 Stacking analysis
To obtain average properties of our galaxies, we performed a stacking analysis of all ALMA continuum images, including both individual detections and nondetections. We used image based stacking as described in Khusanova (in preparation), which we briefly summarise here.
We performed stacking using the continuum images centered on the UV counterpart positions. To create stacked images free from projected bright sources, we masked all serendipitous sources detected above significance based on the serendipitous detection catalog from Bethermin et al. 2020. We used weighted median stacking. That is, after aligning all images to the UV-based phase center, the stacked images were constructed by comparing the distributions of intensities for each pixel and taking a weighted median as follows:
| (3) | ||||
where is the weighted median flux, is the rest-frame continuum flux of the i-th galaxy image, is the median UV luminosity of all galaxies in the stacking bin, and is the UV luminosity of the i-th galaxy. The inverse weighting scheme was chosen to provide us with an accurate measure of the IRX ( / ). For testing purposes, we also computed unweighted median stacks, which did not differ significantly from our weighted medians.
If the UV and IR components within a given galaxy are significantly offset spatially, it could be possible that we lose part of the IR fluxes in our stacking procedure, as we use the UV-based phase center as the stacking reference. To test this, we performed stacks using the individual FIR continuum detections, and found that both the UV-centered stacks and the FIR-centered stacks resulted in identical stacked fluxes. This is consistent with the finding in Fujimoto et al. 2020, who concluded that the UV and FIR continuum positions of our sample are not significantly offset within the relatively large beam size () of our observations.
Flux densities were measured from the stacks using aperture photometry (), and the measurement uncertainties were estimated by boot strapping. As for our individual continuum detections (cf. Sect. 2.3), our detection thresholds for stacks are using the peak pixel flux density, where is the pixel background RMS. When no continuum is detected in the stacks at this level, we determined conservative upper limits by searching the maximum pixel value within of the expected position, and by adding three times the background RMS to the local maximum, as done for the individual sources in the ALPINE catalog (Bethermin et al. 2020).
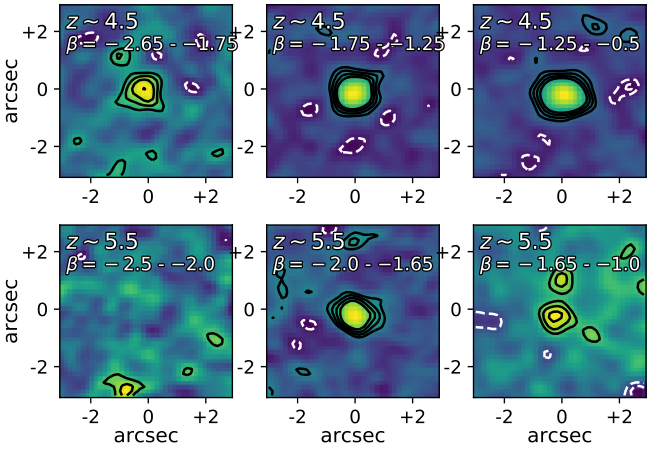
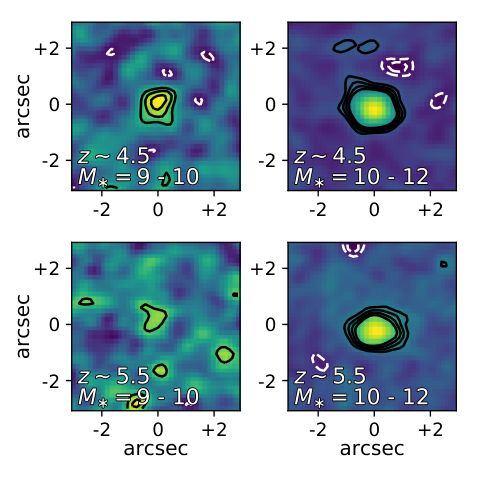
We performed stacking in two different redshift bins of and . In each redshift bin, we further split the sample in bins based both on UV slope and on stellar mass. For the , , and values of each bin, we used the median values of the appropriate sample. The results of our stacking analysis are summarised in Table 1, while the stacked images are shown in Figures 2 and 3.
For the IRX- analysis the bins were chosen to split the sample roughly equally in the two different redshift bins. Specifically, at , we used , , , while for galaxies we used , , (Fig. 2).
From the stacks at , we detected significant continuum emission from all bins, while from the galaxies at we detected all but the bluest bin (i.e., - ). We note that the stellar mass range used in this binning is comparable with the mass range used in several previous studies, such that our results can be directly compared (Álvarez-Márquez et al. 2019; Fudamoto et al. 2017; Fudamoto et al. 2020).
Stacks based on bins were used for the IRX- analysis binned by and for both and galaxies. In total, 111 galaxies are used, while a few very low mass galaxies (7) are not included in these stacks.
From the stacks at , we detected continuum from all bins. In the range , the stack in the high mass bin has a strong detection, while the lower mass bin only shows a tentative signal at , which we report as a nondetection and provide our conservative upper limit (Fig. 3 and Table 1).
| redshifta | a | # of sources | log a | log | logIRX |
| [] | [] | ||||
| Stacks | |||||
| 4.53 | -2.00 | 34 | 9.71 | ||
| 4.53 | -1.47 | 24 | 9.91 | ||
| 4.52 | -0.86 | 8 | 10.37 | ||
| 5.68 | -2.28 | 22 | 9.23 | 10.77 | -0.03 |
| 5.57 | -1.84 | 14 | 9.98 | ||
| 5.51 | -1.43 | 11 | 10.35 | ||
| Stacks | |||||
| 4.53 | -1.71 | 35 | 9.74 | ||
| 4.54 | -1.36 | 28 | 10.24 | ||
| 5.66 | -2.08 | 32 | 9.61 | 10.85 | 0.04 |
| 5.54 | -1.51 | 14 | 10.46 | ||
a Median values in each bin.
4 Results
4.1 IRX- relation
We study the IRX- relations by separating our sample in two different redshift intervals, at and . We then compare our results with existing studies at to investigate the evolution of dust attenuation properties over a wide redshift range between and .
In order to connect the IRX- diagram to the attenuation properties for an ensemble of galaxies, one has to make an assumption about their intrinsic, dust-free UV continuum slope , which depends on stellar population properties (e.g., metallicity, age). Once this is fixed, the slope of the attenuation curve directly determines the position of galaxies in the IRX- space (Salim & Narayanan 2020, see e.g.,). In the following, we parameterize the slope of the attenuation curve as the change in FUV attenuation for a given change in UV continuum slope, , following previous analyses (Meurer et al. 1999; Bouwens et al. 2016, e.g.,). The IRX- relation can then be written as
| (4) |
where the prefactor 1.75 comes from the bolometric correction of the UV luminosity (). Several studies derived (Meurer et al. 1999; Bouwens et al. 2016; Koprowski et al. 2018, e.g.,), and here we used to make our assumption on the IRX- relation consistent with the recent ALMA based study (Bouwens et al. 2016). We refer to “Meurer-like” and “SMC-like” attenuation based on the UV reddening slopes of (Meurer et al. 1999) and , respectively (Reddy et al. 2018, see also). Note that we are thus implicitly treating the extinction curve as measured toward stars in the SMC as an attenuation curve.
4.1.1 The observed IRX- relation
The measured IRX- diagram of our galaxy sample is shown in Figure 4. From the overall distribution of all the individual detections, upper limits, and stacks, we find that our galaxies generally do not follow the Meurer-like IRX- relations from local starbursts, or from massive () star forming galaxies (Bouwens et al. 2019; Álvarez-Márquez et al. 2019; Fudamoto et al. 2017; Fudamoto et al. 2020, e.g.,). The local IRX- relation updated with photometry using larger apertures (Overzier et al. 2011; Takeuchi et al. 2012, i.e.,) are more consistent with our individual detections. However, these IRX- relations require a relatively red or large (Overzier et al. 2011, e.g., ,), which is not consistent with many of our measurements including nondetections and the theoretically predicted evolution of of metal poor high-redshift galaxies (Wilkins et al. 2011; Alavi et al. 2014; Reddy et al. 2018, e.g.,).
The lower IRX values of our sample suggest an evolution of the average dust attenuation properties at , becoming more similar to an SMC-like dust attenuation. However, we note the very large dispersion present in IRX values at fixed for individual detections, which reaches more than 1 dex relative to the stacked values in some cases. Such scatter to higher IRX has been seen before, and can be explained with geometric effects (Howell et al. 2010; Casey et al. 2014; Popping et al. 2017; Narayanan et al. 2018; Faisst et al. 2019, e.g.,). Despite this scatter within the population, it is clear that the average IRX values at fixed , as measured through our stacks, are evolving compared to lower redshift derivations.
In detail, at , more than half of the galaxies which are individually detected (10 out of 15) are located below the M99 relation. Furthermore, all the stacks with lie below the M99 relation. Based on these results, we conclude that the IRX- relation of our sample at does not follow a Meurer-like IRX- relation, but requires a steeper attenuation curve.
At , we detected only a small fraction of galaxies in the dust continuum (8 out of 51), but the majority of these individually detected sources lie somewhat below the M99 relation. Although the stack of the redder galaxies () is perfectly consistent with an SMC-like IRX- relation, the stack of bluer galaxies () lies slightly above the SMC-like relation, while the bluest bin only resulted in an upper limit on the IRX. Nevertheless, we conclude that an SMC-like IRX- relation is more consistent with our galaxy sample than the Meurer-like relation, as indicated also by other studies (Capak et al. 2015; Barisic et al. 2017). We quantify this in detail in the next section.
4.1.2 Fitting the IRX- relation
Given the stacked IRX values as a function of derived above, we can quantify the slope of the attenuation curve of our high-redshift galaxies by fitting the IRX- relation. As shown in Equation 4, the IRX- relation depends both on the shape of the dust curve, through , and on the intrinsic UV continuum slope . While, the classical value derived in M99 for local galaxies is heavily used in the literature also for higher-redshift sources, several authors have pointed out that the physical conditions in early galaxies are likely very different, which affect the intrinsic slope, including younger stellar populations, lower metallicities, or potential changes to the initial mass function (Wilkins et al. 2011; Alavi et al. 2014; Castellano et al. 2014, e.g.,). In particular, Reddy et al. 2018 derived a more appropriate value of for early galaxies, based on the binary population and spectral synthesis model (Eldridge & Stanway 2012; Stanway et al. 2016, BPASS;) with a stellar metallicity of .
Indeed, this bluer is clearly more consistent with the distribution of our sample, which includes several galaxies that are significantly bluer than the nominal dust-free value of M99. In the following, we thus use as our baseline value for our fits of the IRX- relation, but we discuss how our results change by using the classical value of derived in M99.
Using the IRX- relation (Equation 4) with fixed , we fit the stacked IRX values as a function of , which results in at and at (see Figure 4 and Table 2). This is significantly steeper than a Meurer-like attenuation of , meaning that less UV attenuation is required to result in a given reddening of the UV slope. Therefore, in both redshift bins, our data reject a Meurer-like attenuation curve at . The best-fit values even lie below the SMC extinction curve of , as can be appreciated from the comparison of our best-fit curves in Fig. 4 with the line derived in Reddy et al. 2018 using the same .
Our current data are unfortunately not good enough to constrain of our sample, as such constraints require extremely deep IR observations of blue galaxies with accurate measurements. However, the exact value does not affect our conclusion of the SMC-like dust properties at . In particular, even if we change to the classical value from M99 of , we still derive a best-fit for galaxies and values for galaxies (see Table 2). These values also exclude a Meurer-like attenuation at and at , respectively. Thus, our observations indicate that the attenuation curve of UV-selected main-sequence galaxies are SMC-like, irrespective of the intrinsic UV slopes. In the appendix, we summarise the predicted IR luminosities based on our best fit IRX- relations in Table 3, together with the measured for detections.
| Redshift Bin | ||
|---|---|---|
| assuming | assuming | |
| 4.5 | ||
| 5.5 |
As shown in Figure 4, previous studies found that the IRX- relations of UV selected star forming galaxies at are consistent with the M99 relation using stacks of Herschel images (Heinis et al. 2014; Álvarez-Márquez et al. 2016; Koprowski et al. 2018; Álvarez-Márquez et al. 2019). Also from individual detections and stacking analyses of ALMA observations, studies showed that massive UV selected, star forming galaxies at are consistent with the M99 relation, while lower mass galaxies show a relation close to the SMC-like IRX- (Bouwens et al. 2016; Fudamoto et al. 2020). These previous observations are based on UV selected star forming galaxies (such as Lyman Break galaxies) similar to our analysis here, and they included both detections and nondetections in their stacks. Hence, they should be directly comparable to our work. Nevertheless, at the higher redshift probed by our sample here, our results indicate that SMC type relations are more applicable even for massive galaxies. Even within our sample itself, we find tentative evidence for a redshift evolution of the attenuation properties, given the different values derived for at the level between and . This is consistent with the previous analysis at (Capak et al. 2015; Barisic et al. 2017). Overall, these results indicate an evolution of the average dust properties (such as grain size distribution and/or composition) of UV-selected main-sequence galaxies at .
4.1.3 Systematic trends with morpho-kinematics
In addition to the overall relation, we investigated if there is any correlations between a galaxy’s location in the IRX- diagram and its morphology and/or kinematic conditions. Based on the detected [CII] emission lines kinematics and morphology, our sample was classified as rotators (9 galaxies), mergers (31 galaxies), extended dispersion dominated (15 galaxies), and compact dispersion dominated (8 galaxies) galaxies (Le Fèvre et al. 2019). We did not find any clear trends that systematically correlate with the locations of galaxies in the IRX- diagram. Nevertheless, we noted that none of the compact, dispersion dominated galaxies ( of our whole sample) are individually detected in the continuum. However, due to the small sample statistics, it is not yet possible to conclude, if this morpho-kinematic class of galaxies is systematically faint in the FIR.
4.2 IRX- relation
In this section, we study the IRX- relation of our galaxies by splitting the sample in the two redshift bins and again, and we compare our results with previously determined IRX- relations at .
The observed IRX- diagram is shown in Figure 5. As is evident, we find a strong redshift dependence of the relation at , despite the presence of a very large dispersion within the population. The individual detections and the stacked IRX values of our sample are generally lower (on average by , but reaching up to ) than most of the previously determined IRX- relations at lower redshifts . In particular, in many cases, the upper limits of individual nondetections at the massive end of our sample are not consistent with previous relations. While the steep IRX- relation presented in Fudamoto et al. 2020 using galaxies is still consistent with our sample, this is no longer the case at as the average IRX further decreases by from redshift to (Fig. 5).
To compare our results in detail with the IRX- relations previously determined at lower redshift, we use relations that are derived from UV selected star forming galaxies at . The IR observations of these studies are based on Herschel (Heinis et al. 2014; Álvarez-Márquez et al. 2016; Álvarez-Márquez et al. 2019; Koprowski et al. 2018), or ALMA (Fudamoto et al. 2020). Heinis et al. 2014 found no evolution of the IRX- relation up to . However, they do point out that the IRX values decrease at fixed stellar mass as a function of UV luminosity in a way that UV luminous galaxies show systematically lower IRX values than UV fainter ones. To present a fair comparison, we use the IRX- relation from Heinis et al. 2014 obtained by stacks of the highest bin (), which is close to the typical of our sample (median UV luminosities are for and at ). Thus, the sample selection bias of our rest-frame UV luminous galaxies has little, if any, effect on the comparison.
The previously derived IRX- relations up to are mostly consistent with each other, and thus several studies agree on the nonevolution of the IRX- relation over a wide redshift range. However, in a recent study, Fudamoto et al. 2020 found a significantly steeper IRX- relation using an unbiased sample of star forming galaxies at by exploring the entire public ALMA archive data in COSMOS (Liu et al. 2019, A3COSMOS,). The steeper slope in Fudamoto et al. 2020 could reflect a difference in the FIR SED used in previous studies and/or a potential measurement bias in previous stacking analyses, which relied on low-resolution data (e.g., Herschel), however the exact reason is not yet clear.
At , in our ALPINE sample, we find that several individual detections are still consistent with previous relations within uncertainty (Heinis et al. 2014; Bouwens et al. 2016; Fudamoto et al. 2020, e.g.,). However, for individual nondetections at where the sensitivity of our observations provide strong constraints, all of our upper limits lie below the previous relations except for 2 galaxies whose upper limits are still consistent with the Fudamoto et al. 2020 relation. While the stacks show significant detections (upper panels of Fig. 3), and are still consistent with the steep IRX- relation from Fudamoto et al. 2020, the stacks show much lower IRX than the previously determined relations at including the most UV luminous bin from Heinis et al. 2014. Comparing our stacks with the IRX- relation of Bouwens et al. 2016, the IRX of galaxies, on average, are lower at a fixed stellar mass.
Based on these considerations, we conclude the IRX- relation of our sample at is consistent with that of Fudamoto et al. 2020, and deviate from the other previously found relations. This suggests that the IRX- relation of main-sequence galaxies at either rapidly evolves and shows lower IRX at a fixed stellar mass than the relations, or is consistent with the steep IRX- relation of Fudamoto et al. 2020 found at .
At this situation changes rapidly as almost all the individual detections lie below the IRX- relations at , and, at the massive end of our sample (i.e., ), all the individual upper limits are below the IRX- relations, except for one upper limit that is still consistent with Fudamoto et al. 2020. Stacking results emphasise the discrepancies between our sample and the IRX- relations. While the stack of the lower mass bin () does not show a significant detection (lower left panel of Fig. 3), its upper limit lies below the Heinis et al. 2014 and the Bouwens et al. 2016 IRX- relations. The stack of higher mass bin () shows a detection (lower right panel of Fig. 3), however its IRX is below all the previously estimated IRX- relations, suggesting that previously known IRX- relations could over-predict the IR luminosities of star forming galaxies by .
The overall comparisons above demonstrate that the IRX- relations from our observations start to become inconsistent with the previously determined IRX- relations from (except with steeper relation as in Fudamoto et al. 2020), and is no longer consistent with all the previously derived IRX- relations by . The rapid decrease of the IRX from to in massive galaxies suggests a rapid evolution of dust attenuation properties of star formation in the high-redshift Universe, consistent with our conclusions from the IRX- diagram.

4.3 The obscured fraction of star formation
Having estimated both the UV-based SFR and the infrared-based SFRs for our galaxies, we can estimate the obscured fraction of star formation occurring at . This obscured fraction, , represents the fraction of star formation activity observable from IR continuum emission (i.e., dust obscured star formation activity) relative to its total amount, and is defined as , where is the star formation rate observed from IR (equation 2) and is the total star formation rate obtained by adding UV and IR based SFR estimates (i.e., Equation 1 + Equation 2).
Using Spitzer MIPS observations of a mass complete sample at , Whitaker et al. 2017 show that is highly mass dependent, with more than 80% of star formation being obscured in massive galaxies with . Remarkably, Whitaker et al. 2017 find that this relation remains constant over the full redshift range to . Since is directly related to the IRX, the nonevolution of the relation can be considered a product of the nonevolution of the IRX- relation observed at (Heinis et al. 2014, e.g.,). In the same way, our finding of an evolving IRX- relation at (Section 4.2) thus implies an evolution of the obscured fraction of star formation at .
Figure 6 presents the diagram of our galaxy sample. While individual detections and upper limits generally lie between , given our ALMA sensitivity limits, the population average stacked values are significantly lower for 3 out of our 4 stacks. In particular, at , our stacks show lower values than the - relation of Whitaker et al. 2017. While galaxies reach at these masses, we find at and only at . Remarkably, in this high-mass bin at , even all the individual detections and upper limits lie significantly below the lower redshift - relation.
At , Whitaker et al. 2017 discussed that the estimated systematically changes depending on the FIR SED templates used. Using their default template from Dale & Helou 2002, they find a significantly shallower trend with mass compared to a template set based on Béthermin et al. 2015 and Magdis et al. 2012, which incorporate an evolution of dust temperature as a function of redshift. Figure 6 shows both these trends. While the mass trend changes, Whitaker et al. 2017 show that the nonevolution of the - relation up to is conserved, independent of the template choice.
Our stacked data points at result in a mean of at and a 3 upper limit of at . As seen in Figure 6, these numbers are consistent with the lower redshift - relation of Whitaker et al. 2017 using the Béthermin et al. 2015 and Magdis et al. 2012 templates. However, the individual detection and the stacked data points at show rapid decrease of the obscured fractions at for both template sets. This may thus indicate a different redshift evolution for low and high mass galaxies. It is also clear that the obscured fraction of star formation varies significantly from galaxy to galaxy, as is evident from the many individual continuum detections of low-mass galaxies at , which imply , while the stacked median value is only .
One likely caveat of our analysis is that our sample is not perfectly mass complete. While ALPINE galaxies are selected to lie on the main-sequence, they were all required to have spectroscopic redshift measurements, which in most cases are based on rest-frame UV spectra. This could potentially bias our sample to somewhat more UV-luminous, less obscured systems. However, Faisst et al. 2019 show that the ALPINE sample only exhibits a weak bias toward bluer UV continuum slopes compared to a mass-selected parent sample with photometric redshifts . Additionally, the UV selection should affect the or galaxies in a similar way. Simple tests comparing the ALPINE sample with a mass-matched COSMOS parent sample indeed do not find systematic differences in IRX measurements as a function of UV slope.
Nevertheless, it is clear that extremely obscured, dusty sources, which still lie on the main sequence, would be missing from our sample. The existence of such a population of very massive, dusty galaxies at , which can remain undetected at rest-frame UV wavelengths, has recently been suggested in the literature based on ALMA or Spitzer detections (Franco et al. 2018; Wang et al. 2019; Williams et al. 2019; Casey et al. 2019; Gruppioni et al. 2020, e.g.,). The exact contribution to the total SFRD of such sources is still uncertain, given the currently small sample sizes and the difficulty of measuring their exact redshifts and stellar masses. However, it is clear that such UV-faint galaxies have the potential to dominate the SFRD at the massive end of the galaxy population, at . Solving this question will likely have to await the advent of the James Webb Space Telescope, which will provide much deeper rest-frame optical observations.
Keeping this potential sample bias at very high masses in mind, we can nevertheless conclude that our UV selected, main-sequence galaxies at show a much lower obscured fraction than galaxies at . This implies a very rapid build-up of dust in such massive galaxies in the early universe, as the obscured fraction increases from to between to . In contrast, at lower masses, our stacked measurements are consistent with the constant lower redshift - relation of Whitaker et al. 2017 with Béthermin et al. 2015 SED templates, which imply at .
5 Summary and conclusions
We have examined the IRX- relation, the IRX- relation, and the obscured fraction of star formation as a function of stellar mass (- relation) of UV-selected main-sequence star forming galaxies at using continuum observations of 118 galaxies from the ALMA large program, ALPINE. The sample has secure spectroscopic redshifts, but is nevertheless representative of star forming galaxies, that is to say the distribution of SFRs and are consistent with normal main-sequence galaxies in the observed redshift range: and (Faisst et al. 2019, see). From individual FIR measurements and stacks of both detections and nondetections we found:
(i) The IRX- relation of our sample (Fig 4) is generally located below the Meurer relation (Meurer et al. 1999) with average IRX values dex lower for galaxies redder than , as hinted at by earlier studies (Capak et al. 2015; Barisic et al. 2017, e.g.,). Individual measurements of the UV spectral slope suggest that the intrinsic (or dust free) UV spectral slope is smaller than the locally estimated value of (Meurer et al. 1999), and more consistent with a bluer , as expected for younger, more metal poor galaxies (Reddy et al. 2018, e.g., ,). We fit for the slope of the UV attenuation curve, finding it to be significantly steeper than that of local star forming galaxies, and similar to, or even steeper than that of the SMC (treating the SMC extinction curve as an attenuation curve; see Section 4.1).
(ii) Most of the IRX- relations previously reported in the literature at are not consistent with the population average relation of our galaxies at (Fig 5). At , our sample is still consistent with the steep IRX- relation found by Fudamoto et al. 2020 for galaxies, even though individually detected galaxies show a very large scatter around the mean relation. However, at , all the previously found IRX- relations over-predict the IR luminosities by , in particular for galaxies at the high-mass end of our sample, .
(iii) The fraction of dust-obscured star formation among our UV-selected sample shows a decrease from at to only at in massive () galaxies with a potentially large scatter. This average obscured fraction is significantly lower than the found for lower redshift galaxies, and provides direct evidence that the obscured fraction of star forming galaxies rapidly evolves in the early universe.
Taken together, our results indicate that the dust attenuation properties evolve rapidly between , at the end of cosmic reionization, to , around the peak of cosmic star formation. It is possible that we are seeing a transition to supernovae (SNe) driven dust production at , which is predicted theoretically given the limited time available for dust production in lower mass stars (Todini & Ferrara 2001; Nozawa et al. 2003; Schneider et al. 2004, e.g.,). Under certain conditions, such SNe dust might also be consistent with the steeper dust curve we find for our galaxy sample compared to the M99-like attenuation inferred at (Maiolino et al. 2004; Hirashita et al. 2005; Stratta et al. 2007; Gallerani et al. 2010, e.g.,). We refer to a future paper to analyze this possibility in detail.
Importantly, our results indicate that the previous dust attenuation corrections calibrated at will over-predict the of higher-redshift UV selected, star forming galaxies by up to , especially for red and relatively massive galaxies. Future multiwavelength observations of UV-red galaxies (i.e., with ) will be crucial to further constrain the dust attenuation properties of galaxies at and to obtain a complete census of the total SFR density in the early universe. This is one of the key questions that can be addressed in the near future by exploiting the synergy between the FIR observations from ALMA and the rest-frame optical data coming from the James Webb Space Telescope.
Acknowledgements.
This paper is dedicated to the memory of Olivier Le Fèvre, PI of the ALPINE survey. We thank the anonymous referee for insightful comments that improved the quality of this manuscript. This paper makes use of the following ALMA data: ADS/JAO.ALMA#2017.1.00428.L. ALMA is a partnership of ESO (representing its member states), NSF (USA) and NINS (Japan), together with NRC (Canada) and NSC and ASIAA (Taiwan) and KASI (Republic of Korea), in cooperation with the Republic of Chile. The Joint ALMA Observatory is operated by ESO, AUI/NRAO and NAOJ. Based on data products from observations made with ESO Telescopes at the La Silla Paranal Observatory under ESO programme ID 179.A-2005 and on data products produced by TERAPIX and the Cambridge Astronomy Survey Unit on behalf of the UltraVISTA consortium. This work was supported by the Swiss National Science Foundation through the SNSF Professorship grant 157567 ’Galaxy Build-up at Cosmic Dawn’. G.C.J. acknowledges ERC Advanced Grant 695671 “QUENCH” and support by the Science and Technology Facilities Council (STFC). D.R. acknowledges support from the National Science Foundation under grant number AST-1614213 and from the Alexander von Humboldt Foundation through a Humboldt Research Fellowship for Experienced Researchers. A.C., F.P. and M.T. acknowledge the grant MIUR PRIN2017. LV acknowledges funding from the European Union’s Horizon 2020 research and innovation program under the Marie Sklodowska-Curie Grant agreement No. 746119. S.F. is supported by and the Cosmic Dawn Center of Excellence funded by the Danish National Research Foundation under then grant No. 140. R.A. acknowledges support from FONDECYT Regular Grant 1202007.References
- Alavi et al. (2014) Alavi, A., Siana, B., Richard, J., et al. 2014, ApJ, 780, 143
- Alcalde Pampliega et al. (2019) Alcalde Pampliega, B., Pérez-González, P. G., Barro, G., et al. 2019, ApJ, 876, 135
- Álvarez-Márquez et al. (2019) Álvarez-Márquez, J., Burgarella, D., Buat, V., Ilbert, O., & Pérez-González, P. G. 2019, A&A, 630, A153
- Álvarez-Márquez et al. (2016) Álvarez-Márquez, J., Burgarella, D., Heinis, S., et al. 2016, A&A, 587, A122
- Aretxaga et al. (2011) Aretxaga, I., Wilson, G. W., Aguilar, E., et al. 2011, MNRAS, 415, 3831
- Arnouts et al. (1999) Arnouts, S., Cristiani, S., Moscardini, L., et al. 1999, MNRAS, 310, 540
- Barisic et al. (2017) Barisic, I., Faisst, A. L., Capak, P. L., et al. 2017, ApJ, 845, 41
- Béthermin et al. (2015) Béthermin, M., Daddi, E., Magdis, G., et al. 2015, A&A, 573, A113
- Bethermin et al. (2020) Bethermin, M., Fudamoto, Y., Ginolfi, M., et al. 2020, arXiv e-prints, arXiv:2002.00962
- Béthermin et al. (2017) Béthermin, M., Wu, H.-Y., Lagache, G., et al. 2017, A&A, 607, A89
- Bourne et al. (2017) Bourne, N., Dunlop, J. S., Merlin, E., et al. 2017, MNRAS, 467, 1360
- Bouwens et al. (2016) Bouwens, R. J., Aravena, M., Decarli, R., et al. 2016, ApJ, 833, 72
- Bouwens et al. (2015) Bouwens, R. J., Illingworth, G. D., Oesch, P. A., et al. 2015, ApJ, 803, 34
- Bouwens et al. (2019) Bouwens, R. J., Stefanon, M., Oesch, P. A., et al. 2019, ApJ, 880, 25
- Bowler et al. (2018) Bowler, R. A. A., Bourne, N., Dunlop, J. S., McLure, R. J., & McLeod, D. J. 2018, MNRAS, 481, 1631
- Calzetti et al. (2000) Calzetti, D., Armus, L., Bohlin, R. C., et al. 2000, ApJ, 533, 682
- Capak et al. (2015) Capak, P. L., Carilli, C., Jones, G., et al. 2015, Nature, 522, 455
- Casey et al. (2013) Casey, C. M., Chen, C.-C., Cowie, L. L., et al. 2013, MNRAS, 436, 1919
- Casey et al. (2014) Casey, C. M., Scoville, N. Z., Sanders, D. B., et al. 2014, ApJ, 796, 95
- Casey et al. (2019) Casey, C. M., Zavala, J. A., Aravena, M., et al. 2019, ApJ, 887, 55
- Castellano et al. (2014) Castellano, M., Sommariva, V., Fontana, A., et al. 2014, A&A, 566, A19
- Chabrier (2003) Chabrier, G. 2003, PASP, 115, 763
- Condon (1997) Condon, J. J. 1997, PASP, 109, 166
- Dale & Helou (2002) Dale, D. A. & Helou, G. 2002, ApJ, 576, 159
- Davidzon et al. (2017) Davidzon, I., Ilbert, O., Laigle, C., et al. 2017, A&A, 605, A70
- Eldridge & Stanway (2012) Eldridge, J. J. & Stanway, E. R. 2012, MNRAS, 419, 479
- Faisst et al. (2017) Faisst, A. L., Capak, P. L., Yan, L., et al. 2017, ApJ, 847, 21
- Faisst et al. (2019) Faisst, A. L., Schaerer, D., Lemaux, B. C., et al. 2019, arXiv e-prints, arXiv:1912.01621
- Ferrara et al. (2017) Ferrara, A., Hirashita, H., Ouchi, M., & Fujimoto, S. 2017, MNRAS, 471, 5018
- Franco et al. (2018) Franco, M., Elbaz, D., Béthermin, M., et al. 2018, A&A, 620, A152
- Fudamoto et al. (2020) Fudamoto, Y., Oesch, P. A., Magnelli, B., et al. 2020, MNRAS, 491, 4724
- Fudamoto et al. (2017) Fudamoto, Y., Oesch, P. A., Schinnerer, E., et al. 2017, MNRAS, 472, 483
- Fujimoto et al. (2020) Fujimoto, S., Silverman, J. D., Bethermin, M., et al. 2020, arXiv e-prints, arXiv:2003.00013
- Gallerani et al. (2010) Gallerani, S., Maiolino, R., Juarez, Y., et al. 2010, A&A, 523, A85
- Ginolfi et al. (2020) Ginolfi, M., Jones, G. C., Béthermin, M., et al. 2020, A&A, 633, A90
- Grazian et al. (2020) Grazian, A., Giallongo, E., Fiore, F., et al. 2020, ApJ, 897, 94
- Graziani et al. (2020) Graziani, L., Schneider, R., Ginolfi, M., et al. 2020, MNRAS, 494, 1071
- Gruppioni et al. (2020) Gruppioni, C., Bethermin, M., Loiacono, F., et al. 2020, arXiv e-prints, arXiv:2006.04974
- Hashimoto et al. (2019) Hashimoto, T., Inoue, A. K., Mawatari, K., et al. 2019, PASJ, 71, 71
- Hasinger et al. (2018) Hasinger, G., Capak, P., Salvato, M., et al. 2018, ApJ, 858, 77
- Heinis et al. (2014) Heinis, S., Buat, V., Béthermin, M., et al. 2014, MNRAS, 437, 1268
- Hirashita et al. (2005) Hirashita, H., Nozawa, T., Kozasa, T., Ishii, T. T., & Takeuchi, T. T. 2005, MNRAS, 357, 1077
- Howell et al. (2010) Howell, J. H., Armus, L., Mazzarella, J. M., et al. 2010, ApJ, 715, 572
- Ilbert et al. (2006) Ilbert, O., Arnouts, S., McCracken, H. J., et al. 2006, A&A, 457, 841
- Jones et al. (2020) Jones, G. C., Béthermin, M., Fudamoto, Y., et al. 2020, MNRAS, 491, L18
- Kennicutt (1998) Kennicutt, Robert C., J. 1998, ARA&A, 36, 189
- Kennicutt & Evans (2012) Kennicutt, R. C. & Evans, N. J. 2012, ARA&A, 50, 531
- Koprowski et al. (2020) Koprowski, M. P., Coppin, K. E. K., Geach, J. E., et al. 2020, MNRAS, 492, 4927
- Koprowski et al. (2018) Koprowski, M. P., Coppin, K. E. K., Geach, J. E., et al. 2018, MNRAS[arXiv:1801.00791]
- Laporte et al. (2017) Laporte, N., Ellis, R. S., Boone, F., et al. 2017, ApJ, 837, L21
- Le Fèvre et al. (2019) Le Fèvre, O., Béthermin, M., Faisst, A., et al. 2019, arXiv e-prints, arXiv:1910.09517
- Le Fèvre et al. (2015) Le Fèvre, O., Tasca, L. A. M., Cassata, P., et al. 2015, A&A, 576, A79
- Lee et al. (2012) Lee, K.-S., Ferguson, H. C., Wiklind, T., et al. 2012, ApJ, 752, 66
- Liu et al. (2019) Liu, D., Lang, P., Magnelli, B., et al. 2019, ApJS, 244, 40
- Lutz et al. (2011) Lutz, D., Poglitsch, A., Altieri, B., et al. 2011, A&A, 532, A90
- Madau & Dickinson (2014) Madau, P. & Dickinson, M. 2014, ARA&A, 52, 415
- Magdis et al. (2012) Magdis, G. E., Daddi, E., Béthermin, M., et al. 2012, ApJ, 760, 6
- Maiolino et al. (2004) Maiolino, R., Schneider, R., Oliva, E., et al. 2004, Nature, 431, 533
- McLure et al. (2018) McLure, R. J., Dunlop, J. S., Cullen, F., et al. 2018, MNRAS, 476, 3991
- McMullin et al. (2007) McMullin, J. P., Waters, B., Schiebel, D., Young, W., & Golap, K. 2007, in Astronomical Society of the Pacific Conference Series, Vol. 376, Astronomical Data Analysis Software and Systems XVI, ed. R. A. Shaw, F. Hill, & D. J. Bell, 127
- Meurer et al. (1999) Meurer, G. R., Heckman, T. M., & Calzetti, D. 1999, ApJ, 521, 64
- Narayanan et al. (2018) Narayanan, D., Davé, R., Johnson, B. D., et al. 2018, MNRAS, 474, 1718
- Nozawa et al. (2003) Nozawa, T., Kozasa, T., Umeda, H., Maeda, K., & Nomoto, K. 2003, ApJ, 598, 785
- Oesch et al. (2018) Oesch, P. A., Bouwens, R. J., Illingworth, G. D., Labbé, I., & Stefanon, M. 2018, ApJ, 855, 105
- Oliver et al. (2012) Oliver, S. J., Bock, J., Altieri, B., et al. 2012, MNRAS, 424, 1614
- Overzier et al. (2011) Overzier, R. A., Heckman, T. M., Wang, J., et al. 2011, ApJ, 726, L7
- Pannella et al. (2015) Pannella, M., Elbaz, D., Daddi, E., et al. 2015, ApJ, 807, 141
- Popping et al. (2017) Popping, G., Puglisi, A., & Norman, C. A. 2017, MNRAS, 472, 2315
- Prevot et al. (1984) Prevot, M. L., Lequeux, J., Maurice, E., Prevot, L., & Rocca-Volmerange, B. 1984, A&A, 132, 389
- Reddy et al. (2018) Reddy, N. A., Oesch, P. A., Bouwens, R. J., et al. 2018, ApJ, 853, 56
- Salim & Narayanan (2020) Salim, S. & Narayanan, D. 2020, arXiv e-prints, arXiv:2001.03181
- Santini et al. (2014) Santini, P., Maiolino, R., Magnelli, B., et al. 2014, A&A, 562, A30
- Schaerer et al. (2020) Schaerer, D., Ginolfi, M., Bethermin, M., et al. 2020, arXiv e-prints, arXiv:2002.00979
- Schneider et al. (2004) Schneider, R., Ferrara, A., & Salvaterra, R. 2004, MNRAS, 351, 1379
- Schreiber et al. (2018) Schreiber, C., Elbaz, D., Pannella, M., et al. 2018, A&A, 609, A30
- Schreiber et al. (2015) Schreiber, C., Pannella, M., Elbaz, D., et al. 2015, A&A, 575, A74
- Smit et al. (2018) Smit, R., Bouwens, R. J., Carniani, S., et al. 2018, Nature, 553, 178
- Stanway et al. (2016) Stanway, E. R., Eldridge, J. J., & Becker, G. D. 2016, MNRAS, 456, 485
- Steinhardt et al. (2014) Steinhardt, C. L., Speagle, J. S., Capak, P., et al. 2014, ApJ, 791, L25
- Stratta et al. (2007) Stratta, G., Maiolino, R., Fiore, F., & D’Elia, V. 2007, ApJ, 661, L9
- Takeuchi et al. (2012) Takeuchi, T. T., Yuan, F.-T., Ikeyama, A., Murata, K. L., & Inoue, A. K. 2012, ApJ, 755, 144
- Tamura et al. (2019) Tamura, Y., Mawatari, K., Hashimoto, T., et al. 2019, ApJ, 874, 27
- Todini & Ferrara (2001) Todini, P. & Ferrara, A. 2001, MNRAS, 325, 726
- Wang et al. (2019) Wang, T., Schreiber, C., Elbaz, D., et al. 2019, Nature, 572, 211
- Watson et al. (2015) Watson, D., Christensen, L., Knudsen, K. K., et al. 2015, Nature, 519, 327
- Whitaker et al. (2017) Whitaker, K. E., Pope, A., Cybulski, R., et al. 2017, The Astrophysical Journal, 850, 208
- Wilkins et al. (2011) Wilkins, S. M., Bunker, A. J., Stanway, E., Lorenzoni, S., & Caruana, J. 2011, MNRAS, 417, 717
- Wilkins et al. (2018) Wilkins, S. M., Feng, Y., Di Matteo, T., et al. 2018, MNRAS, 473, 5363
- Wilkins et al. (2019) Wilkins, S. M., Lovell, C. C., & Stanway, E. R. 2019, MNRAS, 490, 5359
- Wilkins et al. (2008) Wilkins, S. M., Trentham, N., & Hopkins, A. M. 2008, MNRAS, 385, 687
- Williams et al. (2019) Williams, C. C., Labbe, I., Spilker, J., et al. 2019, ApJ, 884, 154
Appendix A Measured and Predicted Infrared Luminosities
Using the best fit IRX- relations (Equation 4 and Table 2), we estimated the IR luminosity of the galaxies observed in the ALPINE programme (Table 3). While the IRX- assuming is our fiducial relation (Section 4.1), we list estimated using the IRX- relation with . When a is bluer than for each case, the galaxy is consistent to be dust-free, meaning that the estimated is consistent with zero. The estimated with our fiducial IRX- relation are used to estimate the total star formation rates in Schaerer et al. 2020.
| Name | z | ||||
|---|---|---|---|---|---|
| CANDELS_GOODSS_12 | |||||
| CANDELS_GOODSS_19 | |||||
| CANDELS_GOODSS_21 | |||||
| CANDELS_GOODSS_32 | |||||
| CANDELS_GOODSS_37 | |||||
| CANDELS_GOODSS_38 | |||||
| CANDELS_GOODSS_42 | |||||
| CANDELS_GOODSS_47 | |||||
| CANDELS_GOODSS_57 | |||||
| CANDELS_GOODSS_75 | – | ||||
| CANDELS_GOODSS_8 | |||||
| DEIMOS_COSMOS_206253 | |||||
| DEIMOS_COSMOS_224751 | – | – | |||
| DEIMOS_COSMOS_274035 | |||||
| DEIMOS_COSMOS_298678 | |||||
| DEIMOS_COSMOS_308643 | |||||
| DEIMOS_COSMOS_328419 | |||||
| DEIMOS_COSMOS_336830 | – | ||||
| DEIMOS_COSMOS_351640 | |||||
| DEIMOS_COSMOS_357722 | – | ||||
| DEIMOS_COSMOS_372292 | |||||
| DEIMOS_COSMOS_378903 | – | ||||
| DEIMOS_COSMOS_396844 | |||||
| DEIMOS_COSMOS_400160 | |||||
| DEIMOS_COSMOS_403030 | |||||
| DEIMOS_COSMOS_406956 | |||||
| DEIMOS_COSMOS_412589 | – | – | |||
| DEIMOS_COSMOS_416105 | – | ||||
| DEIMOS_COSMOS_417567 | |||||
| DEIMOS_COSMOS_420065 | |||||
| DEIMOS_COSMOS_421062 | |||||
| DEIMOS_COSMOS_422677 | |||||
| DEIMOS_COSMOS_430951 | – | ||||
| DEIMOS_COSMOS_431067 | |||||
| DEIMOS_COSMOS_432340 | |||||
| DEIMOS_COSMOS_434239 | |||||
| DEIMOS_COSMOS_442844 | – | ||||
| DEIMOS_COSMOS_454608 | |||||
| DEIMOS_COSMOS_460378 | |||||
| DEIMOS_COSMOS_470116 | – | ||||
| DEIMOS_COSMOS_471063 | |||||
| DEIMOS_COSMOS_472215 | |||||
| DEIMOS_COSMOS_488399 | |||||
| DEIMOS_COSMOS_493583 | |||||
| DEIMOS_COSMOS_494057 | |||||
| DEIMOS_COSMOS_494763 | |||||
| DEIMOS_COSMOS_503575 | |||||
| DEIMOS_COSMOS_510660 | |||||
| DEIMOS_COSMOS_519281 | |||||
| DEIMOS_COSMOS_536534 | |||||
| DEIMOS_COSMOS_539609 | |||||
| DEIMOS_COSMOS_549131 | |||||
| DEIMOS_COSMOS_550156 | |||||
| DEIMOS_COSMOS_552206 | |||||
| DEIMOS_COSMOS_567070 | |||||
| DEIMOS_COSMOS_576372 | – | – | |||
| DEIMOS_COSMOS_586681 | |||||
| DEIMOS_COSMOS_592644 | |||||
| DEIMOS_COSMOS_627939 | |||||
| DEIMOS_COSMOS_628063 | |||||
| DEIMOS_COSMOS_628137 | – | ||||
| DEIMOS_COSMOS_629750 | |||||
| DEIMOS_COSMOS_630594 | |||||
| DEIMOS_COSMOS_665509 | |||||
| DEIMOS_COSMOS_665626 | |||||
| DEIMOS_COSMOS_680104 | |||||
| DEIMOS_COSMOS_683613 | |||||
| DEIMOS_COSMOS_709575 | |||||
| DEIMOS_COSMOS_722679 | – | – | |||
| DEIMOS_COSMOS_733857 | |||||
| DEIMOS_COSMOS_742174 | |||||
| DEIMOS_COSMOS_743730 | |||||
| DEIMOS_COSMOS_761315 | |||||
| DEIMOS_COSMOS_773957 | |||||
| DEIMOS_COSMOS_787780 | |||||
| DEIMOS_COSMOS_790930 | – | – | |||
| DEIMOS_COSMOS_803480 | – | ||||
| DEIMOS_COSMOS_814483 | |||||
| DEIMOS_COSMOS_818760 | |||||
| DEIMOS_COSMOS_834764 | |||||
| DEIMOS_COSMOS_838532 | |||||
| DEIMOS_COSMOS_842313 | |||||
| DEIMOS_COSMOS_843045 | |||||
| DEIMOS_COSMOS_848185 | |||||
| DEIMOS_COSMOS_859732 | |||||
| DEIMOS_COSMOS_869970 | – | ||||
| DEIMOS_COSMOS_873321 | |||||
| DEIMOS_COSMOS_873756 | |||||
| DEIMOS_COSMOS_880016 | |||||
| DEIMOS_COSMOS_881725 | |||||
| DEIMOS_COSMOS_910650 | |||||
| DEIMOS_COSMOS_920848 | |||||
| DEIMOS_COSMOS_926434 | |||||
| DEIMOS_COSMOS_933876 | |||||
| vuds_cosmos_5100537582 | |||||
| vuds_cosmos_5100541407 | |||||
| vuds_cosmos_5100559223 | |||||
| vuds_cosmos_5100822662 | |||||
| vuds_cosmos_5100969402 | |||||
| vuds_cosmos_5100994794 | |||||
| vuds_cosmos_5101013812 | |||||
| vuds_cosmos_5101209780 | |||||
| vuds_cosmos_5101210235 | |||||
| vuds_cosmos_5101218326 | |||||
| vuds_cosmos_5101244930 | |||||
| vuds_cosmos_5101288969 | |||||
| vuds_cosmos_510148750 | – | ||||
| vuds_cosmos_510327576 | – | ||||
| vuds_cosmos_510581738 | |||||
| vuds_cosmos_510596653 | – | – | |||
| vuds_cosmos_510605533 | – | ||||
| vuds_cosmos_510786441 | |||||
| vuds_cosmos_5110377875 | |||||
| vuds_cosmos_5131465996 | |||||
| vuds_cosmos_5180966608 | |||||
| vuds_efdcs_530029038 |