In situ evidence of firehose instability in multiple reconnection
Abstract
Energy conversion via reconnecting current sheets is common in space and astrophysical plasmas. Frequently, current sheets disrupt at multiple reconnection sites, leading to the formation of plasmoid structures between sites, which might affect energy conversion. We present in situ evidence of the firehose instability in multiple reconnection in the Earth’s magnetotail. The observed proton beams accelerated in the direction parallel to magnetic field and ion-scale fluctuations of whistler type imply the development of firehose instability between two active reconnection sites. The linear wave dispersion relation, estimated for the measured plasma parameters, indicates a positive growth rate of firehose-related electromagnetic fluctuations. Simulations of temporal evolution of the observed multiple reconnection by using a 2.5D implicit particle-in-cell code show that, as the plasmoid formed between two reconnection sites evolves, the plasma at its edge becomes anisotropic and overcomes the firehose marginal stability threshold, leading to the generation of magnetic field fluctuations. The combined results of observations and simulations suggest that the firehose instability, operating between reconnection sites, converts plasma kinetic energy into energy of magnetic field fluctuations, counteracting the conversion of magnetic energy into plasma energy occurring at reconnection sites. This suggests that magnetic energy conversion in multiple reconnection can be less efficient than in the case of the single-site reconnection.
Keywords:
space plasma, magnetic reconnection, plasmoid chain, firehose instabilityI Introduction
The dynamics of magnetized, collisionless astrophysical plasmas implies the formation of current sheets accompanied by the accumulation of magnetic energy (Parker 1994), and the fast release of such energy through magnetic reconnection (Priest & Forbes 2000; Yamada et al. 2010). At the reconnection site, or X-line, nonlinear kinetic-scale processes mediate the large magnetohydrodynamical-scale rearrangement of the magnetic field, leading to plasma bulk acceleration, heating and non-thermal acceleration of particles. Depending on the global conditions, the current sheet disruption may develop into single or multiple reconnection sites. During multiple reconnection, looped magnetic field structures (magnetic islands, plasmoids or flux ropes) tend to form between the adjacent X-lines. Though such plasmoid chains are considered to be an inevitable primary stage of the current sheet disruption (Bhattacharjee et al. 2009; Pucci et al. 2018; Uzdensky & Loureiro 2016, and references therein) as well as an important stage of the single X-line evolution (Daughton et al. 2006), the effect of plasmoid dynamics on the large-scale energy redistribution is not yet fully understood.
Numerical studies showed that plasmoid contraction leads to the acceleration of trapped electrons (Drake et al. 2006) and ions (Drake et al. 2010) parallel to the magnetic field(further referred to as parallel acceleration) by first-order Fermi mechanism. Accordingly, the multi-layered current sheets disrupted into plasmoids, can be responsible for non-thermal acceleration of particles, e.g., at the heliopause (Drake et al. 2010) and in the eruptive solar flares (Guidoni et al. 2016). Ion parallel acceleration is limited by the firehose instability, which manifests at later stages of plasmoids contraction in 2D particle-in-cell (Drake et al. 2010) and 3D hybrid Burgess et al. 2016 simulations.
In space plasmas, statistical analysis of plasma properties showed that the firehose instability limits parallel acceleration of particles in the solar wind (Hellinger et al. 2006; Bale et al. 2009) and in magnetotail reconnection jets (Vörös 2011; Wu et al. 2013), except for an extreme case of long-duration reconnection exhaust (Hietala et al. 2015), where plasma acceleration by reconnection appeared to prevail over the effect of the instability. The plasmoid dynamics in relation to the firehose instability, however, was not studied from observations.
In situ observations of multiple reconnection, showing a plasmoid as well as neighboring reconnection sites, were provided in the Earth’s magnetotail (Hwang et al. 2013; Alexandrova et al. 2015). A case study of a passage of two- X-lines by the spacecraft (Alexandrova et al. 2016) revealed the highly variable magnetic field topology between the X-lines, representing complex stages of the plasmoid evolution.
Here we present in situ observations of multiple reconnection in the Earth’s magnetotail (Alexandrova et al. 2016), with a focus on the ion temperature anisotropy between two reconnection sites. The analysis of particle distribution functions, electromagnetic fluctuations and plasma stability conditions associated with the parallel temperature anisotropy of ions reveal typical conditions for the development of the firehose instability. The observations are supported by 2.5D implicit particle-in-cell (PIC) simulations which allow to follow the space-time dynamics of the plasmoid in relation to development of the instability.
II Overview of the multiple reconnection event in the Earth’s magnetotail
On 2002 August 18, between 17:07:00-17:13:00 UT, the Earth’s magnetosphere was quiet. Ground based observations of the ionosphere showed no signatures of a substorm. Cluster four-probe spacecraft (Escoubet et al. 2001) was moving from northern to southern hemisphere across the magnetotail current sheet, at about 17.7 Earth radii () tailward and 5 dawnward in the Geocentric Solar Magnetic coordinate system (GSM). The spacecraft detected the typical signatures of a consecutive passage of two reconnection sites and of the region in-between, where counterstreaming reconnection jets interact (Alexandrova et al. 2016). The signatures involve three consecutive reversals in the following characteristics: (i) plasma bulk velocity; (ii) magnetic field component in the normal to the current sheet direction (reconnected field) (iii) Hall magnetic field component (see Figure 1 in Alexandrova et al. 2016). A large value of the magnetic field component parallel to the current sheet ( nT) and the jets’ speed ( km/s) being smaller than the characteristic Alfvén speed ( km/s) indicate that the structures were detected at the edge of the current sheet. Between the reconnection sites, two Cluster probes observed two different stages of the jets’ collision process, showing the formation and compression of an ion-scale boundary separating the two counter-streaming jets, which is accompanied by strong wave activity (see Figures 2 and 3 in Alexandrova et al. 2016). All this indicates that the observed plasmoid was not steady during Cluster observations, but was rather evolving in time. Here we focus on the region between the two reconnection sites where one of the Cluster probes, C1, observed enhanced parallel temperature anisotropy of ions.
III In situ observations of firehose instability
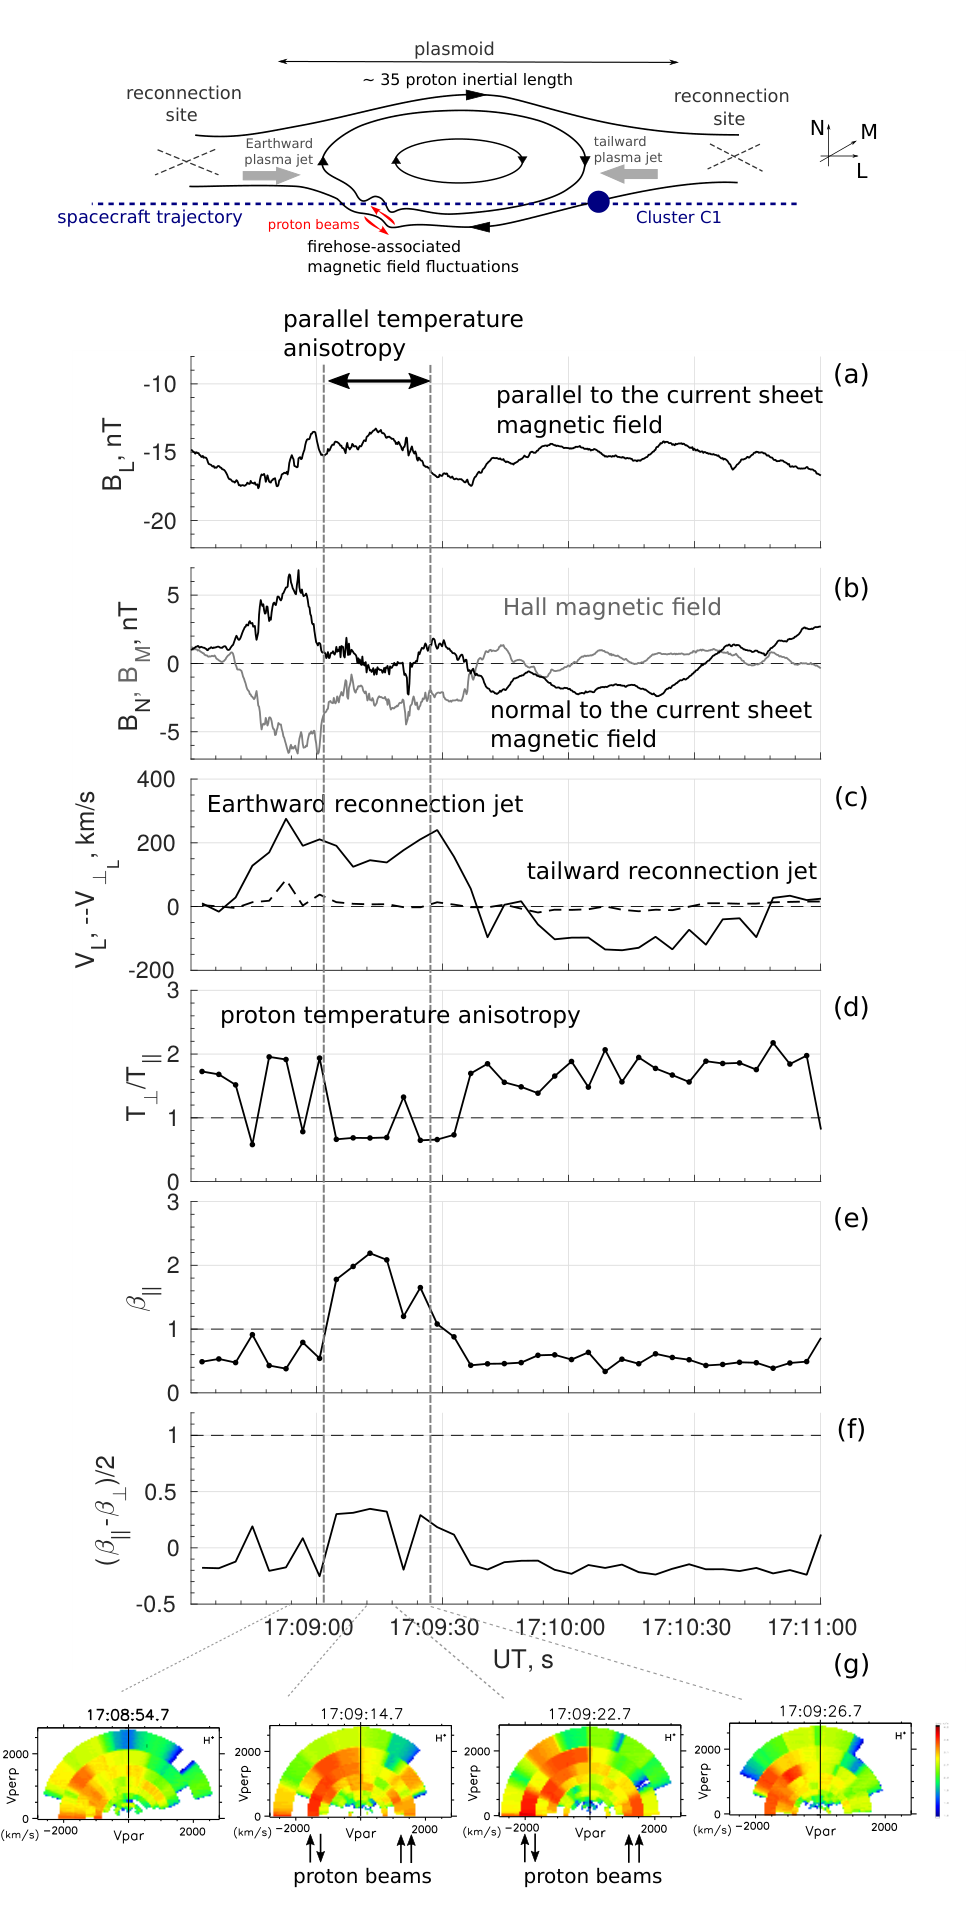
Figure 1 presents Cluster C1 probe observations of magnetic field ( Hz resolution [Balogh et al., 2001]) and plasma ( ion, s resolution plasma moments and distribution functions [Rème et al., 2001]) in the region between the two reconnection sites. Measurements of and ions show densities of more than an order smaller than the density, thus we analyze ions only. Data are represented in the current sheet conventional coordinates LMN, where L is parallel to the current sheet and perpendicular to the reconnection line, M is parallel to the reconnection line, N is perpendicular to the current sheet. LMN was calculated through Minimum Variance Analysis (MVA) of magnetic field [Sonnerup and Cahill, 1967; Sonnerup et al., 2006] to the current sheet crossing prior to the reconnection activity at 16:40 - 17:00 UT for C1 probe (Alexandrova et al. 2016). In GSM coordinates, , , and . In the time interval 17:08:30-17:11:00 the spacecraft were located below the magnetotail current sheet (, Figure 1a). After the first X-line detection at 17:08:30, the probe C1 entered the earthward reconnection jet (, , , Figure 1a-c) and at 17:09:45, it detected the tailward jet (, , , Figure 1a-c) coming from the second X-line observed later at 17:11:00. The velocity perpendicular to the magnetic field, , is negligible, supporting that the spacecraft is located at the current sheet edge where ions propagate mostly in the parallel direction. The magnetic field configuration is consistent with the observations of magnetic field and velocity, see Figure 1 sketch. According to the timing analysis applied to the reversals in the component of magnetic field normal to the current sheet, , (Alexandrova et al. 2015; Alexandrova et al. 2016), the plasmoid observed in between the two reconnection sites is moving tailward with a speed km/s and has a scale in the L direction of km , where km is the ion inertial length. At the time 17:09:04-17:09:26, associated with the region between the first X-line and the jets’ collision site (marked by vertical lines in Figure 1), C1 measurements showed parallel temperature anisotropy of ions, , where and are ion temperatures parallel and perpendicular to the local magnetic field, respectively (Figure 1d). The average temperature ratio is . According to linear analysis in the framework of MHD theory, the parallel temperature anisotropy can cause the firehose instability when , where and are the ratios of the parallel and perpendicular plasma pressures, respectively, to the magnetic field pressure (Gary et al. 1998). At the time corresponding to the temperature anisotropy, the observations show an increase of (Figure 1e) as well as (Figure 1f). However the peak value is lower than the predicted firehose threshold. As for the other Cluster probes, C2 and C3 were far from the region of interest in M and in N direction, respectively, therefore they are not used in this analysis. The probe C4 was observing the region s later and showed parallel temperature anisotropy only in one measurement point, at 09:14.
During the time of interest s associated with the ion parallel temperature anisotropy (in between the vertical lines in Figure 1), the ion velocity distributions show the presence of parallel and anti-parallel beams superposed to the bulk velocity of earthward propagating ions (anti-parallel to the background field), see Figure 1g, 17:09:14.7 and 17:09:22.7 times. These beams are not observed either before (Figure 1g, time 17:08:54.7) or after (Figure 1g, time 17:09:26.7) the region of anisotropy.
We study the magnetic field fluctuations associated with the observed parallel temperature anisotropy. Figure 2a shows the wavelet spectrum of the magnetic field component, which is the reconnected magnetic field component. The fluctuations which directly correspond to the time associated with the ion temperature anisotropy and the increase (17:09:04-17:09:20), are seen in the frequency range of Hz. These frequencies are nearly twice lower than the corresponding ion cyclotron frequency Hz. We apply a bandpass filter for the observed fluctuations (17:09:04-17:09:20, Hz ) and the Minimum Variance Analysis (MVA) (Sonnerup & Cahill 1967) to calculate the direction of propagation and the polarization of these fluctuations (Thorne et al. 1973; Smith & Tsurutani 1976). The wave components in the MVA coordinate system () are shown in Figure 2b. The orientation of the wave coordinate system in the LMN system is , , . The medium to minimum eigenvalue ratio is , which indicates that the normal direction is well defined. The ellipticity, defined as the square root of the medium to maximum eigenvalue ratio is . With respect to the background magnetic field, calculated as an average over the spacecraft spin, , the wave is propagating with an angle . The MVA analysis contains a ambiguity in the normal vector direction. Under the assumption of wave propagation preferentially parallel to the background field, , the elliptically polarized wave exhibit right-hand rotation around the magnetic field, see the wave hodograph in Figure 2c. The observed waves characteristics and frequency ranges are consistent with the low branch whistler waves, which are related to the linear firehose instability (Gary et al. 1998). According to the plasmoid tailward speed km/s (Alexandrova et al. 2016), the ion bulk speed km/s (Figure 1c between the dashed lines), the Alfvén speed km/s, and the period of the ion gyration s, we can roughly estimate the Doppler shift to be about Hz. As long as background plasma propagates in the direction opposite to the wave propagation direction, the expected real wave frequency is therefore about Hz, which is almost equal to the ion cyclotron frequency. The time interval of s corresponding to the temperature anisotropy and increase is associated with one wave period. According to the plasmoid speed, the wave has a scale of km . The amplitude of the observed fluctuation is .
In order to verify whether the firehose instability was operating, we perform a plasma stability analysis. Figure 3a shows comparison between and , measured in between the two reconnection sites (17:08:30-17:11:00), with the predictions of Vlasov linear theory for the marginal stability thresholds of typical plasma instabilities (mirror, ion cyclotron, oblique and parallel firehose) calculated for the maximum growth rate , according to the fitting parameters from Hellinger et al. 2006, Section 2 and Table 1. The five data points, related to the parallel temperature anisotropy observed at 17:09:04-17:09:20, lie close to the parallel firehose threshold (marked with rectangle in Figure 3a). To investigate the growth rate of the possible firehose instability, we solve the Vlasov-Maxwell equations by using WHAMP solver (Rönnmark 1982), assuming a bi-Maxwellian gyrotropic ion distribution and different values of the wave vector direction. It should be noted that the observed ion distribution function is neither bi-Maxwellian, nor gyrotropic. In such a case a recent method developed in Astfalk & Jenko 2017 might give more correct estimates, however it requires better resolution than Cluster provides. Therefore, we use WHAMP calculations to obtain indicative estimates. The solution with positive growth rate is presented in Figure 3b, solid line. For the observed plasma parameters: the average magnetic field nT, electron temperature keV, ion density , ion temperature keV, and temperature anisotropy . The maximum growth rate is about , where is the ion frequency. The dashed line in Figure 3c represents the growth rate calculated for an ion temperature enhanced by and anisotropy enhanced by , to include possible temperature underestimation due to instrumental errors (Paschmann et al. 1998, Figure 6.7 of ). For the enhanced parameters, the growth rate reaches the marginal stability threshold of . For the observed parameters, the solution with the maximum positive growth rate corresponds to a wave with frequency , which is about Hz, see Figure 3c, propagating parallel to magnetic field and have right-hand polarization. The resulting electromagnetic fluctuations are consistent with the firehose instability.
IV Reconstruction of observations with 2.5D PIC simulations
The presented Cluster magnetotail observations represent only single-spacecraft measurements of anisotropic plasma in the localized region of plasmoid between two X-lines, leaving a detailed investigation of the overall large-scale plasmoid spatio-temporal evolution unresolved. Thus, we employ a 2.5D numerical simulation which reproduces the formation of a plasmoid, followed by its compression by reconnected plasma flows and by the development of firehose instability at later stages (Figure 4a-4c). The iPIC3D implicit PIC code (Markidis et al. 2010) is used. The system of coordinates is as follows: the axis is directed parallel to the reconnecting magnetic field (corresponds to the L direction); the axis is normal to the current sheet at time t=0 (corresponds to the N direction); the axis complements the right-hand triple (corresponds to the M direction). The simulation is performed in 2D rectangular domain with the dimensions . The model is translationally invariant in the third direction, z, which is the direction of current. The simulation is initialized with a pair of conventional Harris current sheets located at (active) and (remains quiet in the present study, not shown). A uniform background population of density is added, with being the peak density of the Harris current sheet. The length unit ( km) is computed from the plasmoid edge density ( cm-3) to ease comparison with observations. For such a normalization, the computational box dimensions amount to , and the number of grid points in each dimension is . The magnetic field (asymptotic magnetic field outside of the Harris sheets) is normalized to nT, which is the largest magnetic field observed by the Cluster spacecraft in the parallel temperature anisotropy region (see Figure 1a). Derived units are the Alfvén speed of km/s and the ion cyclotron frequency . The initial ion-to-electron temperature ratio is similar to that of the Cluster observations described above (). The ion-to-electron mass ratio is , the ratio of the speed of light to the characteristic Alfvén speed is 256.
A localized X-point perturbation (Divin et al. 2012, see, e.g.,) ignites reconnection at . Ion jets are formed at early stages once reconnection at the main X-line has reached the steady state. These jets propagate nearly unperturbed in the and directions up to . To mimic the dynamical stage of the plasmoid evolution, we impose periodic boundary conditions and allow plasma jets to run head-to-head producing the domain-large plasmoid (Figures 4a-4c). In essence, such periodic configuration can be viewed as interaction of two X-lines. As reconnection progresses, ion flows compress the plasmoid, producing regions with different kinds of anisotropy: (i) perpendicular anisotropy () is found in the plasmoid core and at reconnection fronts, and for the discussed times); (ii) parallel anisotropy () is found typically in the low- regions close to the edges of the plasmoid (shown with deep blue color in Figures 4a-4c). In Figure 4a-4c, we highlight a few field lines of constant magnetic flux to trace their evolution in time. At the beginning of strong interaction between the counterstreaming jets, approximately at , the plasmoid scale is km. This estimate is rather close to the scale of the observed magnetotail plasmoid described above. In course of simulation time, the plasmoid shrinks and becomes about km by . Further shrinking of the plasmoid, proceeding between and leads to a strong bending of the magnetic field lines at the edges of the plasmoid, while inside the plasmoid the magnetic field structure becomes strongly inhomogeneous following the nonlinear pressure growth.
In Figure 4d we visualize the growth of magnetic field fluctuations at the edge of the plasmoid by plotting the time stack plots of component along a cut through . Very weak at earlier times (, ) are most likely attributed to the weak tearing instability present at earlier stage (see, e.g., Pritchett et al. 1991, Section 3). Colliding jet fronts (peak locations are marked with the squares of corresponding colors) host large variations at and . Note that the colorbar is compressed to reveal weaker perturbations in . Compression of the plasmoid produces conditions favorable for the excitation of the firehose instability. Gray crosses indicate regions where the temperature anisotropy overcomes the firehose marginal stability threshold, calculated according to Hellinger et al. 2006. Notably, fluctuations are strongly amplified at these times (), before saturating at the de-compression stage. Black lines in Figure 4d are virtual streamlines of fluid elements located at (presuming that the velocity component along the direction is unimportant). The streamlines trace well the jet front locations. Although not exactly, the fluctuations follow the streamlines as expected for the firehose instability.
We focus on the region, marked by the white rectangle in Figures 4a-4c: and , which closely reproduces the spacecraft observations by a combination of field and plasma parameters. Figure 4d shows temporal changes in the plasma distribution of plotted against for the selected region. The thresholds for the plasma marginal stability are shown according to Hellinger et al. 2006. The ion temperature anisotropy in relation to indicate isotropic and stable plasma at the early simulation time (, cyan). At later stages, the plasma becomes more anisotropic and the anisotropy exceeds the parallel firehose threshold (, pink and , dark pink). Then, at the time corresponding to the active jets collision (, red), the plasma becomes more isotropic and close to the marginal stability threshold, and at the end of simulations (, dark red), the plasma becomes stable. In order to get a clear visualization in Figure 4d, we plot selected points which represent the overall behavior. Figures 4a, 4b and 4c reflect plasmoid development stages for three selected times from the periods , and , respectively. The magnetic field temporal changes taken in the middle of the selected region, , represent one wave period (Figure 4f). In two locations in direction separated by about km the fluctuations are almost similar and shifted in time by s, indicating the wave phase speed to be about km/s, which is smaller than the corresponding Alfvén speed ( km/s). The MVA analysis (Sonnerup & Cahill 1967) gives the orientation of the normal , the maximum and medium variance components are and , respectively, in the PIC coordinates. Figure 4e shows the wave in the system and the rotation of magnetic field in the plane perpendicular to the normal direction, which indicate right-hand elliptical polarization. Fluctuations show characteristics typical for the firehose instability, with the magnitude of about . Note, that the amplitude of the magnetic field fluctuations changes in time revealing the nonlinear evolution.
V Discussion
At the edge of the plasmoid forming between two X-lines and having a scale of approximately ion inertial lengths (about three Earth’s radii), Cluster observations show distinctive signatures of the firehose instability, including
(2) parallel and anti-parallel ion beams, superimposed to the bulk motion of plasma in the reconnection jet (Figure 1g);
(3) magnetic field fluctuations at frequencies around the ion cyclotron frequency, right-hand polarized and quasi-parallel propagating (Figure 2);
(4) plasma conditions corresponding to the marginal firehose state (Figure 3a), with positive growth rate of the instability (Figure 3b) for the firehose-like fluctuations (Figure 3c) in approximately the ion cyclotron frequency range.
2.5D iPIC simulations of the plasmoid formation between two reconnection jets running head-to-head (see Figures 4a-4c), with plasma and magnetic field parameters, similar to the ones observed, show that
(5) in course of time the plasmoid is compressed, producing regions at its edge with a large parallel temperature anisotropy of the maximum value (Figure 4d, 4e)
(6) firehose-like electromagnetic fluctuations with relatively large amplitude (Figure 4f, 4g) arise when the maximum temperature anisotropy is reached (Figure 4d, ).
(7) at later stages, the anisotropy relaxes though the fluctuations are still present (Figure 4d, ).
(8) the fluctuations at the edge of the plasmoid are affected by the inhomogeneous plasma pressure growth inside the plasmoid and become strongly nonlinear at later stages (Figure 4c).
The combination of Cluster observations and PIC simulations leads to the following interpretation. During multiple reconnection, ions, accelerated by reconnection, propagate mostly parallel to the magnetic field at the edge of the plasmoid forming between two X-lines. As reconnection proceeds, the island contracts which leads to additional acceleration of ions in the magnetic trap between the X-lines. As the temperature anisotropy reaches the firehose marginal stability threshold, the firehose instability excites magnetic field fluctuations, which are confined in the looped magnetic field. Further compression of magnetic field by ongoing reconnection may lead to the nonlinear evolution of these fluctuations and their transformation into bent field lines leading to the formation of a thin boundary, similar to the one observed between the X-lines after the temperature anisotropy was observed (Alexandrova et al. 2016). Note that both active X-lines are observed, thus reconnection does not cease with the development of instability, unlikely to what was shown in simulations by Drake et al. 2006; Drake et al. 2010; Burgess et al. 2016. In such periodic-boundary simulations, the development of the firehose-induced fluctuations, together with the inhomogeneous pressure growth in the plasmoid center, constrains the plasmoid shrinking at later stages and initiate the phase of jet fronts repulsion with consequent decrease of the reconnection rate at the X-lines. Simulations with open boundary conditions, as well as observations covering larger temporal and spatial scales, might be helpful in describing particular conditions for different ways of the plasmoid-chain evolution.
It is important to note that the performed stability analysis was based on the theoretical assumptions of a stable background magnetic field and of bi-Maxwellian particle distributions, while none of these assumptions are rigorously valid in the observations. However, the consistency of the magnetic field fluctuations with the temperature anisotropy of plasma indicates that, despite of these issues, the firehose instability is identified.
Previous studies of plasma stability in the context of temperature anisotropies in the solar wind (Hellinger et al. 2006; Bale et al. 2009; Matteini et al. 2013) and in magnetotail reconnection jets (Vörös 2011; Hietala et al. 2015) performed statistical analysis of the average characteristics of magnetic field fluctuations and typical marginal stability thresholds. In the present study, we analyzed in details the development of the firehose instability and of the associated waves excitation, for the specific magnetic configuration of multiple reconnection with a plasmoid forming between two reconnection sites. The analysis showed that, differently to the average solar wind conditions, multiple reconnection results in highly inhomogeneous anisotropic plasma and nonlinear development of firehose-related fluctuations. Our simulations show that the anisotropy grows far beyond the marginal stability threshold before the firehose-related fluctuations arise. However, fluctuations are present even after plasma reaches the marginal stability. This supports the fact that the observations of relatively small growth rate, but quite intensive fluctuations, indicate that the plasmoid in the magnetotail was detected during instability decaying and plasma isotropisation.
An important aspect is that the instability may affect the global energy conversion in the multiple reconnection configuration. The magnetic energy conversion in the neighboring X-lines leads to particle acceleration, which in turn leads to the development of the firehose instability at the edge of the plasmoid between the X-lines. As a consequence, energy of accelerated particles is converted back to magnetic field fluctuations. Understanding the ratio between the energy converted to plasma by reconnection and the energy withdrawn by the firehose instability might help to better quantify the impact of current sheet disruption to multiple reconnection for space plasma dynamics and would be a valuable direction for a future research.
VI Conclusions
We studied the dynamics of a plasmoid between two active X-lines observed in situ by the Cluster spacecraft in the Earth’s magnetotail current sheet. At the edge of the plasmoid having a scale of about ion inertial lengths (about three Earth’s radii), a parallel temperature anisotropy of ions due to parallel and anti-parallel ion beams was observed. The plasma conditions corresponded to a firehose marginal stability state, as also supported by the excitation of the whistler low-frequency branch waves (at about half of the ion cyclotron frequency). Reconstruction of the magnetotail observations by using PIC simulations allowed us to reproduce the evolution of the firehose instability during multiple reconnection. Simulations support the scenario in which the looped magnetic field of the plasmoid between two reconnection sites undergoes fluctuations due to the firehose instability caused by the excess of parallel ion acceleration at the edges of the plasmoid. In such a way, some part of the plasma energy gained in reconnection might be converted back to magnetic field. The present study indicates that the firehose instability in multiple reconnection can play an important role for energy partition not only in the terrestrial magnetotail, but also in solar and astrophysics plasmas where multiple reconnection is expected to be ubiquitous.
References
- Alexandrova et al. (2015) Alexandrova, A., Nakamura, R., Nakamura, T. K. M., & Semenov, V. S. 2015, Geophys. Res. Lett., 42, 4685, doi: 10.1002/2015GL064421
- Alexandrova et al. (2016) Alexandrova, A., Nakamura, R., Panov, E. V., et al. 2016, Geophys. Res. Lett., 43, 7795, doi: 10.1002/2016GL069823
- Astfalk & Jenko (2017) Astfalk, P., & Jenko, F. 2017, J. Geohpys. Res., 122, 89–101, doi: doi:10.1002/2016JA023522
- Bale et al. (2009) Bale, S. D., Kasper, J. C., Howes, G. G., et al. 2009, Physical Review Letters, 103, 211101
- Bhattacharjee et al. (2009) Bhattacharjee, A., Huang, Y.-M., Yang, H., & Rogers, B. 2009, Phys. Plasmas, 16, 112102, doi: 10.1063/1.3264103
- Burgess et al. (2016) Burgess, D., Gingell, P. W., & Matteini, L. 2016, The Astrophysical Journal, 822:38, 9
- Daughton et al. (2006) Daughton, W., Scudder, J., & Karimabadi, H. 2006, Phys. Plasmas, 13, 072101, doi: 10.1063/1.2218817
- Divin et al. (2012) Divin, A., Lapenta, G., Markidis, S., Newman, D. L., & Goldman, M. V. 2012, Phys. Plasmas, 19, 042110, doi: 10.1063/1.369862
- Drake et al. (2006) Drake, J., Swisdak, M., H.Che, & Shay, M. A. 2006, Nature Physics Letters, 443, 553, doi: 10.1038/nature05116
- Drake et al. (2010) Drake, J. F., Opher, M., Swisdak, M., & Chamoun, J. N. 2010, The Astrophysical Journal, 709, 963
- Escoubet et al. (2001) Escoubet, C. P., Fehringer, M., & Goldstein, M. 2001, Ann. Geophys., 19, 1197
- Gary et al. (1998) Gary, S. P., Li, H., O’Rourke, S., & Winske, D. 1998, J. Geophys. Res., 103, 567
- Guidoni et al. (2016) Guidoni, S. E., DeVore, C. R., Karpen, J. T., & Lynch, B. J. 2016, The Astrophysical Journal, 820, 60, doi: 10.3847/0004-637X/820/1/60
- Hellinger et al. (2006) Hellinger, P., Kasper, P. M. T. J. C., & Lazarus, A. J. 2006, Geophys. Res. Lett., 33, L09101
- Hietala et al. (2015) Hietala, H., Drake, J. F., Phan, T. D., Eastwood, J. P., & McFadden, J. P. 2015, Geophys. Res. Lett., 42, doi: doi:10.1002/2015GL065168
- Hwang et al. (2013) Hwang, K.-J., Goldstein, M. L., Wendel, D. E., Fazakerley, A. N., & Gurgiolo, C. 2013, J. Geophys. Res, 118, 4199–4209, doi: 10.1002/jgra.50403
- Markidis et al. (2010) Markidis, S., Lapenta, G., & Rizwan-Uddin. 2010, Mathematics and Computers in Simulation, 80, 80, 1509
- Matteini et al. (2013) Matteini, L., Hellinger, P., Goldstein, B. E., et al. 2013, J. Geophys. Res., 118, 2771, doi: 10.1002/jgra.50320
- Parker (1994) Parker, E. N. 1994, Spontaneous Current Sheets in Magnetic Fields (200 Madison Avenue, New York, New York 10016: Oxford University Press)
- Paschmann et al. (1998) Paschmann, G., Fazakerley, A. N., & Schwartz, S. J. 1998, Moments of plasma velocity distribution, in Analysis Methods for Multi-Spacecraft Data, edited by G. Paschmann and P. Daly (Eur. Space Agency, Noordwijk, Netherlands), 125–158
- Priest & Forbes (2000) Priest, E. R., & Forbes, T. G. 2000, Magnetic reconnection: MHD Theory and Applications (The Edinburgh Building, Cambridge CB2 2RU, UK: Cambridge University Press)
- Pritchett et al. (1991) Pritchett, P. L., Coroniti, F. V., Pellat, R., & Karimabadi, H. 1991, J. Geophys. Res., 96(A7), 11523
- Pucci et al. (2018) Pucci, F., Velli, M., Tenerani, A., & Sarto, D. D. 2018, Phys. Plasmas, 25, 032113, doi: 10.1063/1.5022988
- Rönnmark (1982) Rönnmark, K. 1982, Tech. Rep. (Kiruna Geophysical Institute)
- Smith & Tsurutani (1976) Smith, E. J., & Tsurutani, B. T. 1976, J. Geophys. Res, 81, 2261
- Sonnerup & Cahill (1967) Sonnerup, B. U., & Cahill, L. 1967, J. Geophys. Res., 72
- Thorne et al. (1973) Thorne, R. M., Smith, E. J., Burton, R. K., & Holzer, R. E. 1973, J. Geophys. Res, 78, 1581
- Uzdensky & Loureiro (2016) Uzdensky, D. A., & Loureiro, N. F. 2016, Physical Review Letters., 116, 105003, doi: 10.1103/PhysRevLett.116.105003
- Vörös (2011) Vörös, Z. 2011, Nonlin. Processes Geophys., 18, 861, doi: 10.5194/npg-18-861-2011
- Wu et al. (2013) Wu, M. Y., Volwerk, M., Lu, Q. M., et al. 2013, J. Geophys. Res., 118, 4875 , doi: 10.1002/jgra.50451
- Yamada et al. (2010) Yamada, M., Kulsrud, R., & Ji, H. 2010, Reviews of Modern Physics, 82, doi: 10.1103/RevModPhys.82.603