A SARS-CoV-2 Microscopic Image Dataset with Ground Truth Images and Visual Features
Abstract
SARS-CoV-2 has characteristics of wide contagion and quick propagation velocity. To analyse the visual information of it, we build a SARS-CoV-2 Microscopic Image Dataset (SC2-MID) with 48 electron microscopic images and also prepare their ground truth images. Furthermore, we extract multiple classical features and novel deep learning features to describe the visual information of SARS-CoV-2. Finally, it is proved that the visual features of the SARS-CoV-2 images which are observed under the electron microscopic can be extracted and analysed.
Keywords:
SARS-CoV-2 Image Dataset Visual Features Ground Truth Image Classical Feature Extraction Deep Learning Feature ExtractionY. Peng et al. (Eds.): PRCV 2020, LNCS 12305, pp. 244–255, 2020.
https://doi.org/10.1007/978-3-030-60633-6_20
1 Introduction
It is reported that the severe acute respiratory syndrome coronavirus 2 (SARS-CoV-2) breaks out since the end of December in 2019 [8]. More than 12,690,000 people have been infected around the world till July 12th, 2020 [17], which becomes a global malignant epidemic.
A novel coronavirus was detected for the first time in the laboratory on January 7th, 2020, and the whole genome sequence of the virus was obtained. The first 15 positive cases of novel coronavirus were detected by nucleic acid detection and the virus was separated from one positive patient and observed under an electron microscope. The detection of pathogenic nucleic acid was completed on January 10th, 2020. The first novel coronavirus with electron microscopic images in China was successfully separated from the Center for Disease Control and Prevention (CDC) on January 24th, 2020. Novel coronavirus nucleic acids were detected in 33 samples from China’s CDC on January 26th, 2020, and the virus was successfully separated from positive environmental samples. SARS-CoV-2 outbreak was announced as a public health emergency of international concern (PHEIC) by the World Health Organization (WHO) on January 30th, 2020. It was officially named as COVD-19 (corona virus disease 2019) by WHO on Febuary 11th, 2020. The International Committee on Taxonomy of Viruses (ICTV) has named the virus as Severe Acute Respiratory Syndrome Coronavirus 2 (SARS-CoV-2) [6].
Coronavirus is a kind of plus-strand RNA virus, which can infect many mammals including human beings and can cause cold and some other serious diseases such as Middle East Respiratory Syndrome (MERS) and Severe Acute Respiratory Syndrome (SARS) [4]. The SARS-CoV-2 is a novel coronavirus that has never been found in human bodies. The SARS-CoV-2 is highly infectious and mainly transmitted through close contact and respiratory droplets. Besides, the severe patients may die [15]. The main symptom of human infection is respiratory disease, accompanied by fever, cough and may cause viral pneumonia[1]. There is no effective medicine developed up to now. Because of the rapid mutation of RNA coronavirus and lack of efficient medicine, there are mainly two methods to confirm the case, the first is detecting the positive nucleic acid of coronavirus by using RT-PCR, the other one is the high homology between the results of the virus gene sequence and the known SARS-CoV-2 [3]. Both of the methods above need professional medical equipments and personnel. So the process is time consuming and expensive. Microscopic image analysis provides a new method for rapid coronavirus screening [10, 13, 11, 12, 14], thus, several visual features are extracted in the experiments below.
2 SARS-CoV-2 Microscopic Image Dataset (SC2-MID)
2.1 SARS-CoV-2 Visual Properties and Ground Truth Image Preparation
SARS-CoV-2 is a type of coronavirus, which has envelope with spinous process. The shape of the virus particle is circular or oval, which seems as a solar corona. The tubular inclusions can be detected in the cell which is infected with coronavirus. The spinous process of different coronaviruses has significant differences. The SARS-CoV-2 has a diameter of 60-140nm. It also has the largest genome as a RNA virus. The mircoscopic image of SARS-CoV-2 is shown in Fig. 1.

In order to obtain the accurate image and extract the visual features of SARS-CoV-2, a dataset is constructed and one of the example images with its Ground Truth (GT) image are shown in Fig. 2. Geometric features and texture features of SARS-CoV-2 are extracted by combining both the original image and GT image.


Based on the visual properties of SARS-CoV-2 images, we prepare the GT images according to the rules as follows:
a
The GT images in the dataset are generated in pixel level. The foreground of GT images is the SARS-CoV-2 and the pixel value is “1” which represents white. The pixel value of the background is zero (“0”) which represents black.
b
Then all part of SARS-CoV-2 is drawn from the observation by naked eyes.
c
When the spinous region of SARS-CoV-2 is not clear, the GT image is drawn following the value of the particle region. If the SARS-CoV-2 particle is bright part, then the bright region around the particle will be drawn as spinous part of SARS-CoV-2, and vice versa.
2.2 Dataset Construction
Most of the SARS-CoV-2 images are kept by National Health Commission at present. One of the images with scale is shown in Fig. 2(a) and the corresponding GT image is shown in Fig. 2(b). The scale of Fig. 2(a) is labelled in the image precisely and can be used to calculate the real size of the SARS-CoV-2.
The SARS-CoV-2 microscopic image dataset (SC2-MID) we built has 17 electron microscopic images which are separated to 48 single SARS-CoV-2 images. We are willing to share the dataset with the researchers for sharing but not for commercial purposes. If you want to obtain the dataset, please contact our data manager Jiawei Zhang (1971087@stu.neu.edu.cn). The horizontal axes of images are roughly the same length with the scale length in Fig. 2(a) which has a length of 100. The other images are resized and cut based on the scale of Fig. 2(a). The image names with their data sources are shown in Table 1.
| ImageName | Source |
|---|---|
| IMG-001 - IMG-004 | https://www.infectiousdiseaseadvisor.com/home/topics/gi-illness/covid-19-symptoms-may-need-to-be-extended-to-include-gi-symptoms/ |
| IMG-005 - IMG-008 | https://wired.jp/2020/03/08/what-is-a-coronavirus/ |
| IMG-009 - IMG-014 | https://www.genengnews.com/news/sars-cov-2-insists-on-making-a-name-for-itself/ |
| IMG-015 - IMG-018 | https://www.h-brs.de/en/information-on-coronavirus |
| IMG-019 - IMG-022 | https://www.medicalnewstoday.com/articles/why-does-sars-cov-2-spread-so-easily |
| IMG-023 - IMG-028 | https://www.upwr.edu.pl/news/51004/coronavirus-sars-cov-2-messages.html |
| IMG-029 - IMG-032 | https://www.infectiousdiseaseadvisor.com/home/topics/gi-illness/covid-19-symptoms-may-need-to-be-extended-to-include-gi-symptoms/ |
| IMG-033 - IMG-035 | https://www.dzif.de/en/sars-cov-2-dzif-scientists-and-development-vaccines |
| IMG-036 - IMG-038 | https://www.charite.de/en/clinical-center/themes-hospital/faqs-on-sars-cov-2/: |
| IMG-039 - IMG-041 | https://news.harvard.edu/gazette/story/2020/03/in-creating-a-coronavirus-vaccine-researchers-prepare-for-future/ |
| IMG-042 | https://newsbash.ru/society/health/17116-kak-vygljadit-koronavirus-pod-mikroskopom-rossijskie-uchenye-sdelali-foto.html |
| IMG-043 | https://www.rbc.ru/rbcfreenews/5e735ff09a7947be392f2bec |
| IMG-044 | http://www.ellegirl.ru/articles/foto-dnya-kak-vyglyadit-koronavirus/ |
| IMG-045 - IMG-046 | https://mp.weixin.qq.com/s/zO8rW8W2TgzN2o6JEKcLnQ |
| IMG-047 - IMG-048 | https://br.sputniknews.com/asia-oceania/2020012415043397-china-publica-foto-do-coronavirus-visto-por-microscopio-eletronico/ |
The database of SARS-CoV-2 is built which contains 48 electron microscopic images. The corresponding GT images are also shown in Fig. 3.


3 SARS-CoV-2 Visual Feature Extraction
Visual feature extraction is one of the important parts of computer vision. We extract several shape features including basic geometric feature and Hu invariant moment. We also extract several texture features including Histogram of Oriented Gradient (HOG) and Gray-Level Co-occurrence Matrix (GLCM). And we use deep learning such as VGG-16, Xception and DenseNet121 to get the feature map of images. All the features above can be extracted from the dataset we constructed. An example of feature extraction is shown as follows.
3.1 Shape Feature Extraction
Shape feature extraction is one of the most important research topics in describing the true nature of images. The original shape of an object can be precisely stored by using shape features, which is significant for computer vision and image recognition.
Basic Geometric Features:
Perimeter refers to the boundary length of the object in the image. The perimeter of the image is composed of several discrete pixel points, which is calculated as the sum of pixel points of the target edge.
The area of an object in an image is usually represented by calculating the sum of pixel points of the object. The GT image is used to calculate the area of SARS-CoV-2 in the original image. The SARS-CoV-2 in GT image is shown as white which is represented by 1, and the background is shown as black which is represented by 0. Scan the GT image and sum the number of pixel points that the value is 1. The process is defined as below:
| (1) |
The area of SARS-CoV-2 is represented by the sum of the pixels that .
The major axis and the minor axis are the longest length and the shortest length while linking two random points of an oval. They are usually represented as the major axis and minor axis of the smallest oval which can contain all of the objects in an irregular figure. The major axis and minor axis are defined as below:
| (2) |
where is the length of the major axis, , , , are boundary points of the connected region in four directions.
| (3) |
where is the length of minor axis, is the perimeter, is the ovality factor defined by .
From Fig. 2, we segment the image scale and match it to pixels. The pixels of part of the scale are black and the rest pixels of the image are white. So it is easy to calculate the length of scale and calculate the proportion of the image size to true size. And then the proportion can be used to calculate the values of the shape features. The length of scale consists of 206 pixels which means 100nm for real size, so the proportion is about 0.4854 nm/pixels.
| Feature | Value | Unit |
|---|---|---|
| Area | 2808.98 | |
| Perimeter | 477.4689 | |
| MajorAxis | 71.5500 | |
| MinorAxis | 56.8100 | |
| Eccentricity | 1.2595 | – |
The shape features of SARS-CoV-2 are extracted by combining the GT image and original image, and the true size of these features are calculated by using the proportion above and the values are shown in Table 2. The eccentricity is the ratio of the major axis to the minor axis.
Hu Invariant Moment:
Hu invariant moment creates seven invariant moment functions by using the normalized second and third order center distance. The central moment is defined as bellow:
| (4) |
where is the center of gravity coordinates of the image.
HU is used to describe the properties of images. The Hu invariant moment is widely used because of its high stability while changing the geometric characteristics of the images, which is invariant to translation, rotation and scale transformation. Hu invariant moment is generally used to identify large objects in an image, which can describe the shape of objects well and recognize them quickly. The seven values of Hu invariant moment for Fig. 2 are shown in Table 3.
| 0.9584 | 0.1854 | 0.0270 | 0.0125 | -0.0004 | -0.0021 | -0.0002 |
The geometric values are roughly consistent with the morphology of the virus when observed by the naked eyes. It is much more accurate to obtain the geometric values of the virus through the GT image. The geometric values are all objective values obtained by computer, but the conclusion is a little more subjective.
3.2 Texture Feature Extraction
HOG Feature Extraction:
HOG is a classical method to recognize the object and extract the texture features[5]. The local HOG can describe the texture features of particular part in an image. The principle of HOG is selecting the gradient of image edge area and extracting the density distribution coefficient. The first step is dividing the global image into several sub-images based on pixels. Then calculate the oriented gradient values and save them into a matrix. Finally, integrate the matrix based on initial image.
Because of the rich information and high diversity of image, the dimensions of extracted HOG feature are different. So it is necessary to normalize the HOG feature into a 36 dimensional vector, which has 4 blocks in a region with 9 dimensions per block. We extract the HOG feature of SARS-CoV-2 by combining the GT and original images. The normalized histogram with 36 dimensional vectors is shown in Fig. 4.

The vector graph of HOG feature is shown in Fig. 5. The red arrows describe the change of oriented gradient precisely. The vector graph shows good ability in describing the HOG feature of the part of SARS-CoV-2.

GLCM Feature Extraction:
GLCM is one of the general methods to describe the texture features of images. The principle is measuring the spatial information between two pixels to describe the texture features. The texture feature refers to the gray-scale relationship between two pixels. Find the corresponding relationship between the pixel and the pixels in eight directions. The GLCM is to combine the co-occurrence matrix between every two pixels in the image. There are four kinds of eigenvalues in GLCM, which are contrast, homogeneity, correlation and energy.Every feature above has 4 dimensional vectors. The normalized histogram with 16 dimensional vectors is shown in Fig. 6.
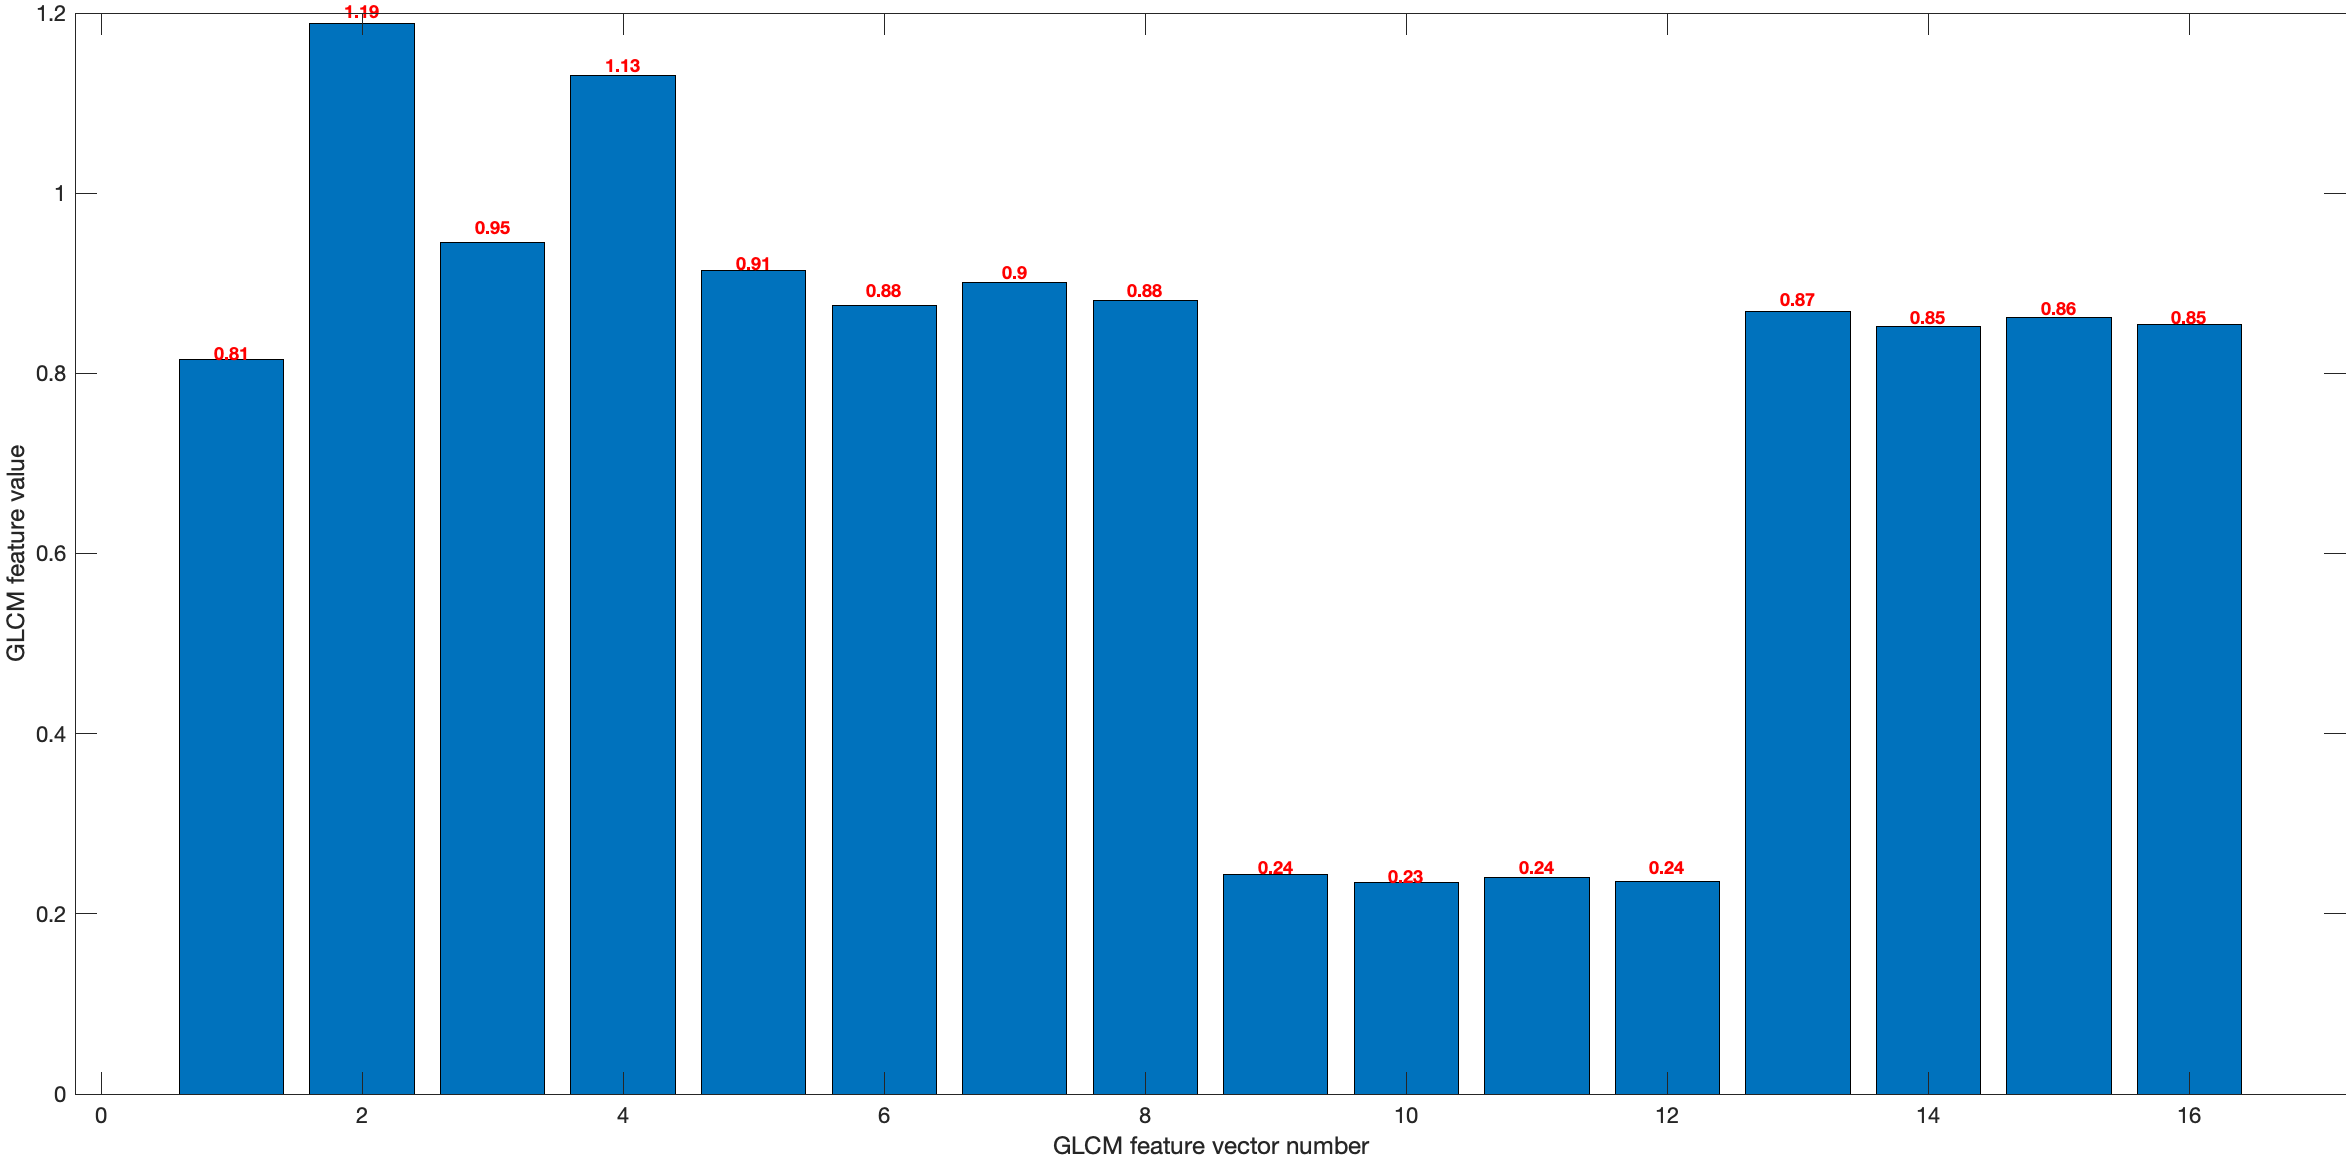
The edge feature of the image can be well extracted without losing much local details, and the feature of low sensitivity for local geometry and optical transformation can be acquired by HOG and GLCM feature extraction, which can express the texture feature of SARS-CoV-2 effectively.
3.3 Deep Learning Feature Extraction
Convolution neural networks (CNN) have the ability to learn deep features which are substituted to hand crafted features such as corners, edges, blobs and ridges. These features are very robust and invariant to image translational changes.
CNN uses multiple convolution layers to progressively extract high and low level features from raw input images. They use convolution matrix (kernel) for blurring, sharpening, embossing and edge detection. The lower layers identify general features such as corners and edges, while deep layers extract features specific to the organisms. Example of the CNN is shown in figure 7, which shows deep layers of VGG-16 model. With such high extraction power of CNNs, we can use them to extract deep learning features which can be used for detection and classification of SARS-CoV-2. Additionally, the scarcity of SARS-CoV-2 dataset on training CNN can be overcome by the use of transfer learning. Thus, we extract deep learning features from SARS-CoV-2 images using VGG-16 [16], Xception [2] and DenseNet [7] which have been pre-trained on ImageNet dataset. The feature maps extracted from different layers are shown in figure 8.


3.4 Analysis
The SARS-CoV-2 has strong texture heterogeneity by combining the HOG feature and GLCM feature. The shape features and texture features can be extracted from the images in SC2-MID which can be combined and used as eigenvectors in image classification. The combination of texture and geometric features can describe the surface features of the virus precisely, which contains much more abundant information that can help for better classification accuracy in image classification.
Moreover, we can leverage strong feature learning power of deep learning networks (CNN) by extracting deep learning features from SARS-CoV-2, which are robust, invariant to translation changes, do not need image pre-processing and can reduce the need of hand crafted features in segmentation, detection and classification of SARS-CoV-2.
4 Conclusion and Future Work
The SARS-CoV-2 has some recognizable visual information which can be represented by visual features, such as texture and shape features, providing a possibility to describe the morphological property of SARS-CoV-2 for medical workers.
We may get more electron microscopic images in the future to enlarge our dataset. We will establish the evaluation index of the SC2-MID. We will extract more visual features for image classification in future work. The dataset can be used to help medical workers to identify and classify the SARS-CoV-2.
Acknowledgements
We thank B.E. Jiawei Zhang, due to his great work is considered as important as the first author in this paper. We also thank the websites which provide SARS-CoV-2 images.
References
- [1] Chen, N., Zhou, M., Dong, X., Qu, J., Gong, F., Han, Y., Qiu, Y., Wang, J., Liu, Y., Wei, Y., Xia, J., Yu, T., Zhang, X., Zhang, L.: Epidemiological and clinical characteristics of 99 cases of 2019 novel coronavirus pneumonia in wuhan, china: a descriptive study. The Lancet 395(10223), 507–513 (2020)
- [2] Chollet, F.: Xception: Deep learning with depthwise separable convolutions. In: Proceedings of the IEEE conference on computer vision and pattern recognition. pp. 1251–1258 (2017)
- [3] Chu, D., Pan, Y., Cheng, S., Hui, S., Krishnan, P., Liu, Y., Ng, D., Wan, C., Yang, P., Wang, Q., Peiris, M., Poon, L.: Molecular Diagnosis of a Novel Coronavirus (2019-nCoV) Causing an Outbreak of Pneumonia. Clinical Chemistry (01 2020)
- [4] Cui, J., Li, F., Shi, Z.: Origin and evolution of pathogenic coronaviruses. Nature Reviews. Microbiology 17(3), 181–192 (2019)
- [5] Dalal, N., Triggs, B.: Histograms of oriented gradients for human detection. In: Proc. of ICPR 2005. pp. 886–893 (2005)
- [6] Gorbalenya, A., Baker, S., Baric, R., Groot, R., Drosten, C., Gulyaeva, A., Haagmans, B., Lauber, C., Leontovich, A., Neuman, B., Penzar, D., Perlman, S., Poon, L., Samborskiy, D., Sidorov, I., Sola, I., Ziebuhr, J.: Severe acute respiratory syndrome-related coronavirus: The species and its viruses – a statement of the coronavirus study group. bioRxiv (2020)
- [7] Huang, G., Liu, Z., Van Der Maaten, L., Weinberger, K.Q.: Densely connected convolutional networks. In: Proceedings of the IEEE conference on computer vision and pattern recognition. pp. 4700–4708 (2017)
- [8] Hui, D., Azhar, E., Madani, T., Ntoumi, F., Kock, R., Dar, O., Ippolito, G., Mchugh, T., Memish, Z., Drosten, C., Zumla, A., Petersen, E.: The continuing 2019-ncov epidemic threat of novel coronaviruses to global health — the latest 2019 novel coronavirus outbreak in wuhan, china. International Journal of Infectious Diseases 91, 264–266 (2020)
- [9] Image, B.: The electron microscopic image of SARS-CoV-2. Available at: https://baike.baidu.com/item/2019%E6%96%B0%E5%9E%8B%E5%86%A0%E7%8A%B6%E7%97%85%E6%AF%92/24267858?fromtitle=%E6%96%B0%E5%9E%8B%E5%86%A0%E7%8A%B6%E7%97%85%E6%AF%92&fromid=7904360&fr=aladdin
- [10] Kulwa, F., Li, C., Zhao, X., Cai, B., Xu, N., Qi, S., Chen, S., Teng, Y.: A State-of-the-art Survey for Microorganism Image Segmentation Methods and Future Potential. IEEE Access 7(1), 100243–100269 (2019)
- [11] Li, C.: Content-based Microscopic Image Analysis. Logos Verlag Berlin GmbH, Gubener Str. 47, Berlin, Germany (2016)
- [12] Li, C., Kulwa, F., Zhang, J., Li, Z., Xu, H., Zhao, X.: A Review of Clustering Methods in Microorganism Image Analysis. In: Pietka, E., Badura, P., Kawa, J., Wieclawek, W. (eds.) Advances in Intelligent Systems and Computing xxxxxx, p. Accepted for publication. Springer, Germany (2020)
- [13] Li, C., Wang, K., Xu, N.: A Survey for the Applications of Content-based Microscopic Image Analysis in Microorganism Classification Domains. Artificial Intelligence Review 51(4), 577–646 (2019)
- [14] Li, C., Xu, N., Jiang, T., Qi, S., Han, F., Qian, W., Zhao, X.: A Brief Review for Content-based Miroorganism Image Analysis Using Classical and Deep Neural Networks. In: Pietka, E., Badura, P., Kawa, J., Wieclawek, W. (eds.) Advances in Intelligent Systems and Computing 762, pp. 3–14. Springer, Germany (2018)
- [15] Malik, Y., Sircar, S., Bhat, S., Sharun, K., Dhama, K., Dadar, M., Tiwari, R., Chaicumpa, W.: Emerging novel coronavirus (2019-ncov)-current scenario, evolutionary perspective based on genome analysis and recent developments. The Veterinary Quarterly 40(1), 68–76 (12 2020)
- [16] Simonyan, K., Zisserman, A.: Very deep convolutional networks for large-scale image recognition. arXiv preprint arXiv:1409.1556 (2014)
- [17] University, J.H.: Coronavirus covid-19 global cases by the center for systems science and engineering (csse) at johns hopkins university (jhu). Available at: https://coronavirus.jhu.edu/map.html