Star Formation Enhancement in Barred Disk Galaxies in Interacting Galaxy Clusters
Abstract
A recent study shows that bars can be induced via interaction of galaxy clusters, but it has been unclear if the bar formation by the interaction between clusters is related to the enhancement of star formation. We study galaxies in 105 galaxy clusters at detected from Sloan Digital Sky Survey data, in order to examine whether the fraction of star-forming galaxies () in 16 interacting clusters is enhanced compared with that of the other non-interacting clusters and to investigate the possible connection between the enhancement and the bar formation in interacting clusters. We find that is moderately higher () in interacting clusters than in non-interacting clusters and that the enhancement of star formation in interacting clusters occurs only in moderate-mass disk-dominated galaxies ( and the bulge-to-total light ratio is ). We also find that the enhancement of in moderate-mass disk-dominated galaxies in interacting clusters is mostly due to the increase of the number of barred galaxies. Our result suggests that the cluster–cluster interaction can simultaneously induce bars and star formation in disk galaxies.
Keywords:
galaxies: clusters: general — galaxies: interactions — galaxies: star formation — galaxies: structureI Introduction
Galaxy clusters grow by accretion of galaxies and mergers of galaxy groups and clusters in the cold dark matter universe (Berrier et al. 2009; McGee et al. 2009; Schellenberger et al. 2019). A merger or interaction between galaxy clusters is the most violent event in the universe with kinetic energies up to . Thus, the interacting cluster is a good laboratory to understand how galaxy properties are affected under a violent change of the large-scale environment. For example, Yoon et al. 2019 recently found observational evidence that cluster–cluster interaction can form bars in disk galaxies, suggesting that such a violent phenomenon is an important mechanism for bar formation.
One of possible interesting consequences of the cluster–cluster interaction is the enhancement of star formation in the cluster member galaxies. Hence, many studies have been carried out to reveal whether the star formation in galaxies is affected by cluster mergers or interactions. However, the results are somewhat controversial. Several studies based on observation (Owen et al. 1999; Owen et al. 2005; Miller, & Owen 2003; Hwang & Lee 2009; Hou et al. 2012; Cohen et al. 2014; Cohen et al. 2015; Stroe et al. 2014; Stroe et al. 2017; Sobral et al. 2015; Ebeling, & Kalita 2019; Soares, & Rembold 2019) and simulations (Bekki 1999; Bekki et al. 2010) show that the star formation is enhanced in merging or interacting clusters. Some of the observational studies (Hou et al. 2012; Cohen et al. 2014; Cohen et al. 2015) found that the fraction of star-forming galaxies is as much as – higher in interacting clusters (clusters with substructures or unrelaxed clusters), and galaxies transform to quiescent ones as the cluster merger process proceeds (Cava et al. 2017, e.g.,). These studies suggest various physical mechanisms to enhance star-formation activities of galaxies in interacting clusters: the enhanced time-dependent tidal gravitational field (Bekki 1999; Owen et al. 2005), turbulence induced by cluster-wide shock waves in intracluster medium (Stroe et al. 2014; Sobral et al. 2015, ICM;), and compression of cold gas by increased external pressure of ICM during interaction (Bekki et al. 2010).
On the other hand, a number of studies suggest that star formation is suppressed or not enhanced in interacting clusters (Tomita et al. 1996; Fujita et al. 1999; Poggianti et al. 2004; Chung et al. 2009; Haines et al. 2009; Shim et al. 2011; Tyler et al. 2014; Deshev et al. 2017; Mansheim et al. 2017). In a recent work, Okabe et al. 2019 examined the fraction of red galaxies with in merging clusters and single clusters from the Hyper Supreme-Cam Subaru Strategic Program. They found that the red fractions are consistent between two cluster classes at , although they caution that their result does not exclude the possibility of star formation triggered by cluster interactions. Fujita et al. 1999 argued in their simulation that the increased ram-pressure during cluster–cluster interaction can strip interstellar medium (ISM) of galaxies and thereby suppress star-formation activities. They also showed that the star-formation enhancement by compression of ISM is not significant, which is contrary to the results of Bekki et al. 2010. Mansheim et al. 2017 suggested that the amplified tidal force and its time variation can remove bound gas in galaxies, which results in suppression of star formation. This is an opposite stand to those of Bekki 1999 and Owen et al. 2005.
Another important aspect in interacting clusters is the bar formation by cluster–cluster interactions and how it is related to the star formation in cluster galaxies. For example, Bekki 1999 shows that time-dependent tidal force in interacting clusters can not only trigger star formation but also can contribute to bar formation. In our earlier study (66), we have shown that the bar formation can be enhanced by a factor of 1.5 in interacting clusters, backing up the theoretical prediction of Bekki 1999.
The bar fraction enhancement in interacting clusters suggests that the bar fraction enhancement might be responsible for the star-formation enhancement in the interacting clusters. Due to the elongated potentials of the structures and materials in bars, it has been suggested that bars can efficiently channel cold gas to the central regions of galaxies and thereby trigger the nuclear star formation in galaxies (Kim et al. 2012; Oh et al. 2012; Seo & Kim 2013; Carles et al. 2016) or even trigger active galactic nuclei (Oh et al. 2012). Therefore, if the bars are preferentially induced in interacting clusters, one would expect that the star formation in such clusters is also induced in relation to the bar formation.
Motivated by the need for confirming the previously reported star-formation enhancement in interacting clusters and the possible connection between the bar and star formation enhancement in such clusters, we carried out a statistical study using 16 interacting clusters and 89 non-interacting clusters from 66. Member galaxies in these clusters are classified as barred or non-barred galaxies, and thus this cluster sample is ideal for investigating the connection between bars and star formation in clusters. In the following, we show that star formation is indeed enhanced in interacting clusters as found in previous studies but the enhancement is dependent on the stellar mass of member galaxies and that the star-formation enhancement is closely related to the bar fraction enhancement in interacting clusters.
Throughout this paper, we use H km s-1 Mpc-1, , and as cosmological parameters, which is supported by observational studies in the past decades (Im et al. 1997, e.g.,).
II Sample and Method
The samples of galaxies and clusters used in this study are identical to those of 66. Details about the samples, cluster identification, selection of interacting clusters, and bar classifications can be found in 66. Here, we only briefly describe them.
II.1 Cluster Identification
Our sample is based on the MPA--JHU catalog11 1 http://www.sdss.org/dr14/spectro/galaxy_mpajhu/ that lists positions and spectroscopic redshifts of galaxies in the Sloan Digital Sky Survey (SDSS) Data Release (DR) 8 (Aihara et al. 2011). This catalog also provides galaxy properties such as stellar masses () and specific star formation rates (sSFRs: star formation rate per unit ).
Galaxy clusters were selected from a volume-limited sample of galaxies with at . The stellar mass cut ensures that galaxies satisfy the magnitude cut () of SDSS main galaxy sample (Strauss et al. 2002) for spectroscopy. We note that of the spectroscopy target galaxies in the cluster regions (within ) were observed in spectroscopic follow-up,22 2 The fraction is for targets in all environments. while this fraction decreases to in the case of the cluster core regions (within ) due to the fiber collision between close targets (within ). Here, is a radius within which the mean density is 200 times the critical density of the universe. This lowered fraction of spectroscopically observed galaxies in the cluster core may slightly increase the fraction of star-forming galaxies in clusters, but this should not cause a problem in comparing the star-forming galaxy fractions between clusters of different kinds, since the same spectroscopic target selection bias applies to all the clusters. We also note that there is virtually no difference in the sampling rate for the spectroscopy between the areas of interacting clusters and non-interacting clusters (difference of ).
The cluster search is performed in the following way. First, we measured the number of galaxies around each galaxy within a projected radius of 1 Mpc and a rest-frame redshift slice of km s-1 from the galaxy.33 3 We note that the application of wider velocity slices of 1800 and 2500 km s-1 here does not find additional clusters but reduces the number of discovered clusters by , especially for those with lower mass. Also see Lee et al. 2019 regarding how the cluster selection can be affected if one chooses a wide velocity cut. Then, we applied the Friends-of-friends algorithm to connect galaxies in dense environments44 4 Environments of which surface number densities of galaxies are above 95.4 percentile (or ). into an overdense region, with a linking length of 1 Mpc in the projected distance and km s-1 in the radial velocity.
For the overdense regions, we measured that is a cluster mass in . and were calculated using all galaxies with within a 1 Mpc radius from the center of the overdense region. After excluding non-member galaxies and outliers in the radial velocity space, the one-dimensional (radial) velocity dispersion was derived. and were calculated from the one-dimensional velocity dispersions of overdense regions and equations used in the previous studies (Demarco et al. 2010; Kim et al. 2016).55 5 Equations 2 and 3 in 66 Through this procedure, we identified 105 galaxy clusters with at .66 6 Halos with can be called groups, rather than clusters. However, for convenience, we define them as clusters in this study. Note that this redshift range is a bit smaller than the redshift range of the volume-limited galaxy sample to avoid exclusion of member galaxies of clusters near the redshift limits. In total, 4595 galaxies are used in this study, and they are all members of the 105 clusters.77 7 Member galaxies of a cluster were defined as galaxies within from the cluster center and within a rest-frame velocity slice of , centered on the redshift of the cluster; is the radial velocity dispersion of the galaxies.
Among these clusters, we define interacting clusters as clusters that are in close pairs or clusters with substructures in the space and velocity space. The clusters in close pairs are defined as clusters that do not largely overlap within their , yet that are close enough so that they can be considered to be in a gravitational bound orbit. The conditions can be summarized as (1) the radial velocity difference of the two clusters, , to be km s-1 (equivalent to Mpc), and (2) the projected distance between the two clusters 1 and 2, , to be , where and are values of the two clusters in close separation. For more details, see 66. We identified clusters with clear substructures using the Dressler–Shectman test (Dressler & Shectman 1988) that finds substructures in clusters by detecting large deviations of local velocity distributions in clusters.88 8 See Equation 6 in 66
The clusters in a pair are regarded as two individual clusters and hence cluster masses were calculated individually. On the other hand, we regard the cluster with substructure as a single cluster, since substructures are intermingled in the same projected region, which makes it difficult to split the cluster into multiple components. This may lead to overestimation in of clusters with substructures. Indeed, three out of five clusters with substructures have (see Supplementary Table 1 of 66).
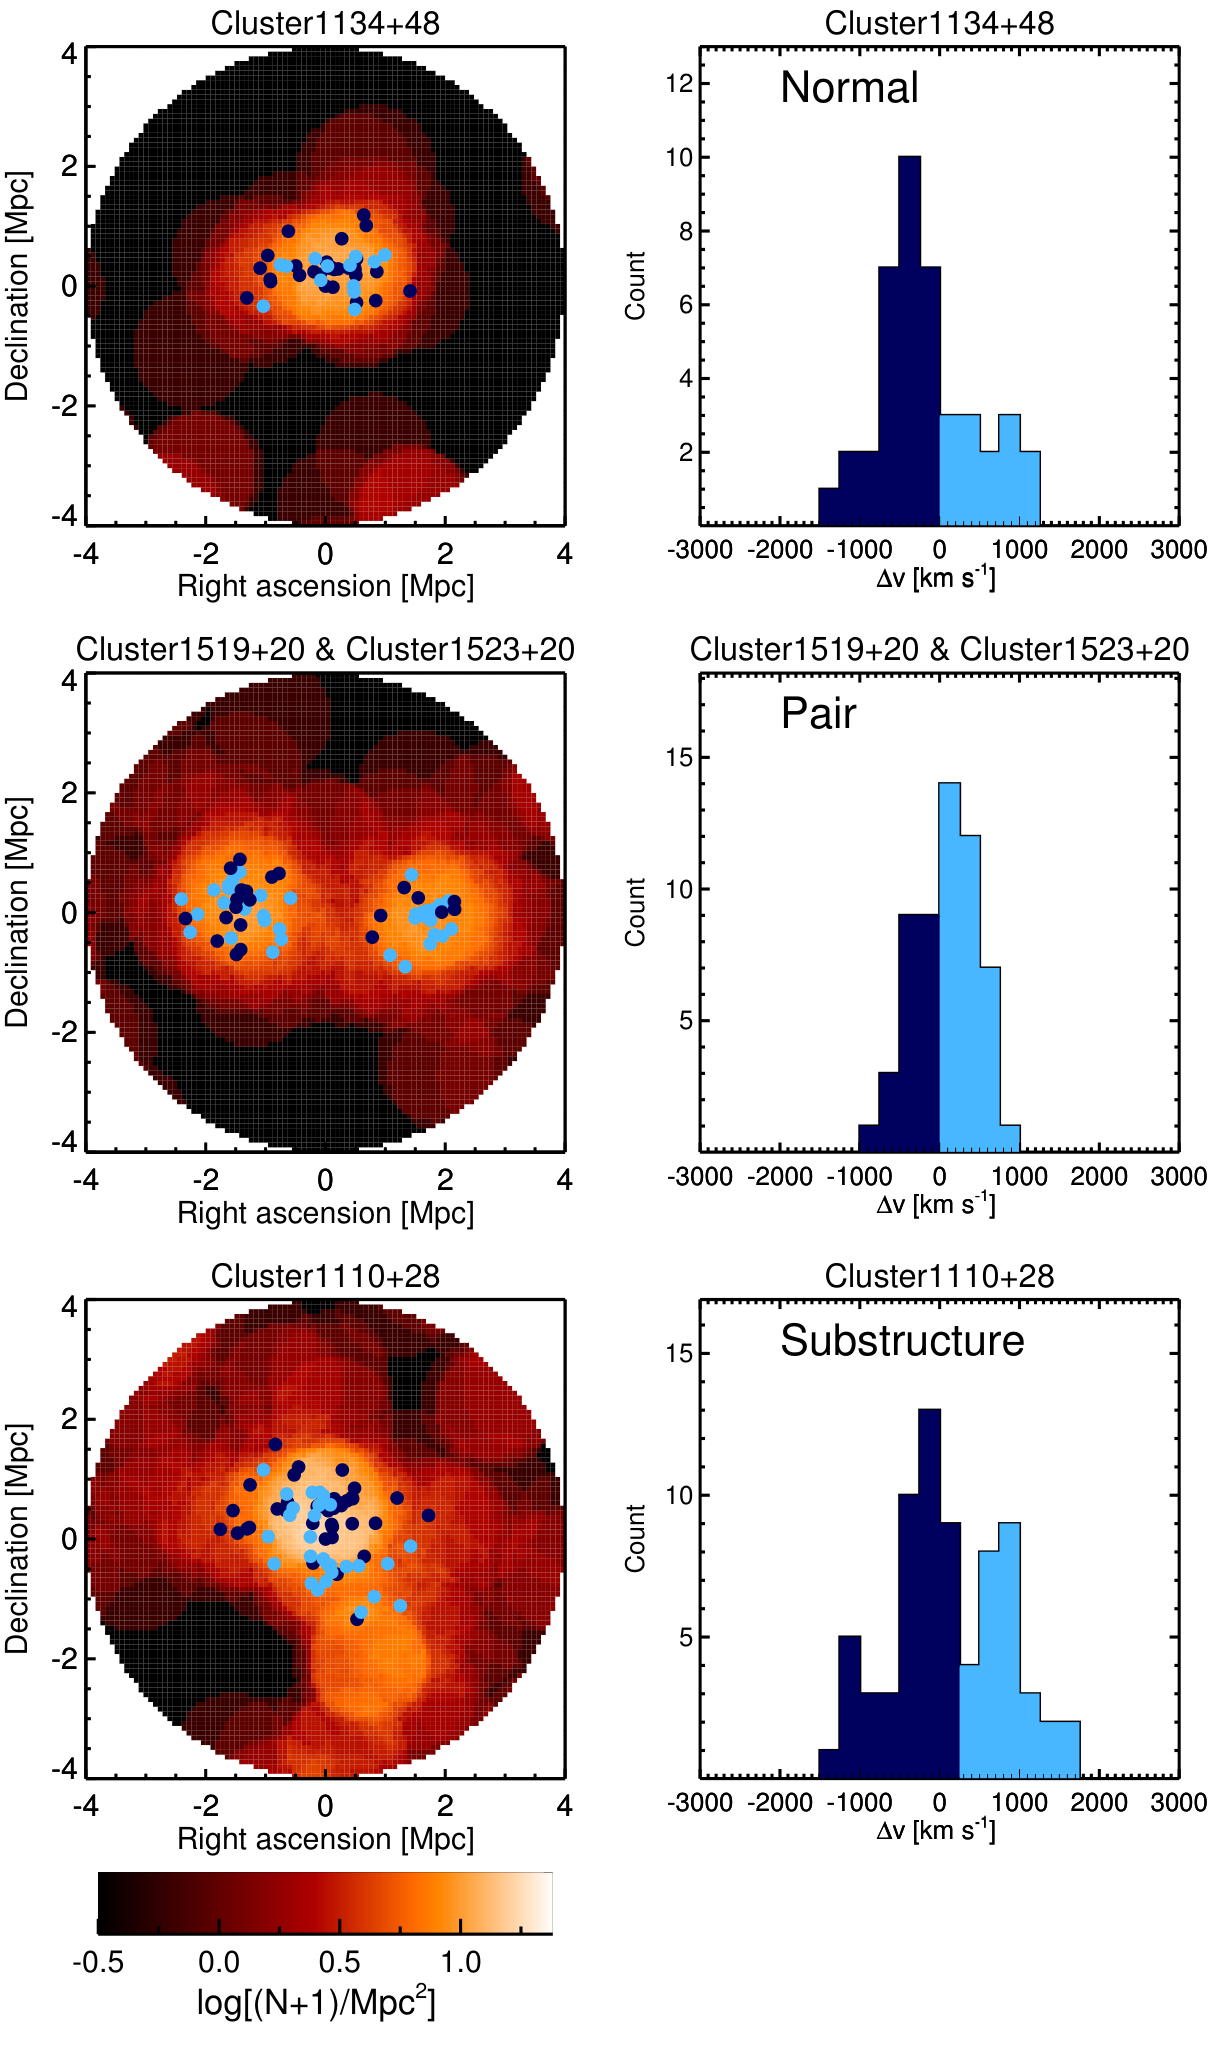
We found five clusters that have substructures and seven cluster pairs (hence in total 14 clusters are in pairs). Since three clusters belong to both categories, we identified 16 interacting clusters in total. Figure 1 shows examples of the surface number density maps and velocity distributions of galaxies for clusters in isolation, in a pair, and with substructures. The distributions for all the clusters, interacting clusters, and non-interacting clusters used in this study are shown in Figure 2. The top panel of Figure 2 compares our cluster mass function99 9 The cluster mass function was calculated by dividing the number of clusters in each bin by the bin size and the comoving volume within the SDSS DR8 Legacy spectroscopic coverage of 7966 square degrees (Aihara et al. 2011) and . with those of previous studies (Reiprich, & Böhringer 2002; Rines et al. 2007; Böhringer et al. 2017), showing that they are all consistent with each other. The bottom panel shows that the fraction of interacting clusters is higher for higher-mass clusters. This trend is also in the clusters used in Stroe et al. 2017 and Okabe et al. 2019. This is perhaps due to the overestimation for clusters with substructures and/or due to more frequent merging history of massive clusters. The fact that finding substructures could be more efficient for massive clusters with a large number of member galaxies (Okabe et al. 2019, e.g.,) could also be the reason for the trend.
To check the robustness of the cluster-finding method, we matched the clusters detected here with the Abell clusters (Abell et al. 1989) in the SDSS survey area and at . The richness parameters (from 0 to 5), indicating how rich the group is in terms of member galaxies, are assigned to the Abell clusters. We find that (20/22) of the Abell clusters with richness larger than or equal to 1 were detected by our cluster-finding method. This value is the same as the detection rate (; 91/100) of mock clusters in GALFORM simulation (Cole et al. 2000; Lagos et al. 2012), as found in the test in 66 that used the same cluster-finding method. For clusters with richness larger than or equal to 2, our method detected all (; 5/5). However, only (11/22) of the Abell clusters with the richness of 0 were detected by our method. Therefore, our cluster-finding method is robust in detecting clusters with the Abell richness from 1 to 5.
The definition of interacting or unrelaxed clusters varies between different works, some defining it from the existence of radio-emitting structures (Stroe et al. 2017), symmetry of member galaxy distribution (Cohen et al. 2014; Cohen et al. 2015; Okabe et al. 2019), and the dynamical state detected from Sunyaev–Zeldovich effect or X-ray emission (Rossetti et al. 2016). Although the fraction of unrelaxed or interacting clusters is found to be in Okabe et al. 2019, some works find , significantly more than what we found here. This discrepancy must be due to how interacting clusters are defined. If we loosen our criteria for selecting interacting clusters, using the (projected and radial) pair separation distance that is 1.25 (or 1.5) times larger than what we originally adopted and the probability of having substructures above (or ) instead of , the number of interacting clusters is 41 (or 52). We note that the use of the loosened definition does not reverse the basic results on the difference between interacting and non-interacting clusters in Section III, although the difference is reduced from a factor of 1.2 to 1.1.
II.2 Bar Classification, , and sSFR of Galaxies
Bars were identified through a quantitative method using the IRAF ELLIPSE (Jedrzejewski 1987), augmented by visual classification. For the bar classification, we used galaxies that have ellipticities less than or equal to 0.5, which corresponds to an inclination angle smaller than or equal to . This is because it is difficult to detect bars in highly inclined galaxies. We detected bars with several quantitative criteria that find an elongated structure (high ellipticity) for several consecutive ellipses, but an abrupt drop of the ellipticity at the end of the elongated structure, and an almost constant position angle over the high-ellipticity region. We visually inspected all galaxies to complement the automated bar classification. By doing so, we excluded false detections and added apparent bar galaxies that were missed in the automated classification.
We derived the (-band) bulge-to-total light ratio () of each galaxy based on radial surface brightness profiles that were extracted by the ELLIPSE and using a model that is combination of the de Vaucouleurs law for bulges and the exponential profile for disks. The value traces how a bulge is dominant in a galaxy total luminosity. Thus, values are usually used to quantitatively define the morphology of galaxies: generally, corresponds to disk-dominated late-type galaxies, while indicates bulge-dominated early-type galaxies (Fukugita et al. 1998; Im et al. 2002; Oohama et al. 2009).

We used galaxy sSFRs from the MPA--JHU catalog. In the catalog, SFRs were derived from nebular emission lines. In addition, galaxy photometry is also used to compute SFRs outside of fibers. In the case of active galactic nuclei and galaxies with weak emission lines, SFRs were derived from photometry.1010 10 We find that the linear Pearson correlation coefficient between sSFRs and color values of galaxies is . The sSFR values have a strong anticorrelation with color, which is a well-known proxy for young stellar populations. We note that use of color instead of sSFRs does not change our main results.
Because 34 among 4595 galaxies do not have sSFR information, we assigned sSFRs derived from spectral energy distribution fitting to these galaxies. For this purpose, we utilized the code Fitting and Assessment of Synthetic Templates (Kriek et al. 2009, FAST;1111 11 http://w.astro.berkeley.edu/~mariska/FAST.html), which performs fitting of the broadband photometry ( and in this study) and works with stellar population grids to derive the best-fit model and its properties.1212 12 More specifically, we used the initial mass function of Chabrier 2003 and assumed a delayed exponentially decreasing SFR. We modeled the stellar population with the -folding time scales, (/yr) with a step size of 0.1 and the ages of (/yr) with a step size of 0.1. We used several metallicity values (Z = 0.004, 0.008, 0.02, and 0.05). For dust attenuation model, we used the attenuation law from Calzetti et al. 2000. We adopted the extinction values at band in with a step size of 0.1.
Figure 3 shows the distribution of all galaxies in the and sSFR plane. Low-sSFR galaxies are clustered at but with a gradient in the --sSFR plane. Therefore, to divide galaxies into high- and low-sSFR ones, rather than adopting a single sSFR cut, we fit the low-sSFR sequence and divide galaxies into high- and low-sSFR ones. To do so, we conducted a linear fit using robust least absolute deviation1313 13 IDL LADFIT procedure to galaxies with . During the process, we obtained the mean of the absolute deviation (in a logarithmic value) between the linear relation and sSFR values (hereafter, MAD). Then, galaxies that have sSFRs higher than above the linear relation were excluded. With the remaining galaxies, we repeated the above procedure until the linear fit result converged. The converged linear relation represents the low-sSFR sequence, indicated by the yellow solid line in Figure 3. The converged MAD is 0.26 dex. Finally, we set a dividing line between high- and low-sSFR galaxies at (i.e., 0.91 dex) above the low-sSFR sequence relation, denoted by the green dashed line in Figure 3. The equation of this dividing line is
| (1) |
We note that use of a simple cut of instead of the dividing line for separation does not change the results presented in Section III, which means our results are insensitive to minor changes in the specific definition for high- and low-sSFR galaxies.
In this study, we divide galaxies into several categories according to sSFR, , , and presence of bar. In Table 1, we show the total numbers of galaxies in each category.
| Category | Non-interacting Clusters | Interacting Clusters |
|---|---|---|
| All | 3577 | 1018 |
| and | 903 | 272 |
| and | 803 | 251 |
| and | 691 | 195 |
| and | 1072 | 285 |
| Barred, and | 130 | 53 |
| Non-barred, and | 457 | 111 |
| Barred, and | 158 | 79 |
| Non-barred, and | 314 | 75 |
Note. — Among all 4595 galaxies, 123 galaxies do not have information. They are too compact to constrain or edge-on galaxies. See 66 for more information. For the categories in which bars were classified, we used galaxies that have ellipticities less than or equal to to avoid galaxies with large inclination angles that are difficult to detect bars.
III Results
We calculated fractions of high-sSFR galaxies () of interacting and non-interacting clusters. is defined as , where is the number of galaxies located above the sSFR dividing line (Equation 1) in Figure 3 and is the number of all galaxies (high- and low-sSFR galaxies). The error for the fraction in this study is the standard error for the proportion for a binomial distribution (see Equation 8 in 66).
As shown in the left panel of Figure 4, we find that is times higher in interacting clusters than in non-interacting clusters ( versus ). In order to find out which galaxies account for the difference in , we divided galaxies into four categories on the basis of their and values: (moderate mass), (high mass),1414 14 We can clearly see a different trend, when galaxies are segregated at , which is also close to the median of 4595 galaxies. In this paper, we use the expression “moderate-mass galaxies” instead of “low-mass galaxies” as a counterpart of the high-mass galaxies, since the stellar masses of these galaxies () are barely below , which is (Kelvin et al. 2014). (bulge dominated), and (disk dominated). 66 show that the bar fraction enhancement in interacting clusters is significant at . Thus, 66 used the criterion of to define disk-dominated galaxies for further investigation. Here, we also used the same criterion as in 66 to define disk-dominated galaxies for the purpose of examining correlation between the enhancement of bar fraction in interacting clusters and star formation. Minor adjustments of this criterion (e.g., –) do not essentially change our main conclusion.
The middle and right panels of Figure 4 show of each category. We find that of bulge-dominated galaxies in non-interacting clusters is comparable to that of interacting clusters within the error, for both mass ranges. of high-mass disk-dominated galaxies in non-interacting clusters is also similar to that of interacting clusters within the error. However, in the case of moderate-mass disk-dominated galaxies only, of the non-interacting clusters is different from that of interacting clusters, in such a way that of interacting clusters is times higher than that of non-interacting clusters ( versus ). This is confirmed by sSFR distributions for moderate-mass disk-dominated galaxies in interacting clusters and non-interacting clusters shown in Figure 5. The probability of the null hypothesis that the two distributions in the figure are drawn from the same distribution is 0.044 by the Kolmogrov–Smirnov test. We note that the increase in moderate-mass disk-dominated galaxies is responsible for of the total increase in interacting clusters compared to non-interacting clusters.
A similar result is derived from distributions for of individual clusters in which only moderate-mass disk-dominated galaxies are used. The distributions are shown in Figure 6. In the figure, the distribution for interacting clusters is skewed to higher compared to that of non-interacting clusters. The probability of the null hypothesis that the two distributions are drawn from the same distribution is 0.105 based on the Kolmogrov–Smirnov test.
To understand the interplay between bars in galaxies and their sSFRs, we investigated changes in proportions of four populations of disk-dominated galaxies (barred high-sSFR, non-barred high-sSFR, barred low-sSFR, and non-barred low-sSFR galaxies) in each mass bin (moderate-mass or high-mass bin).1515 15 As mentioned in Section II, we used galaxies with hereafter. The results are shown in Figure 7 as bar charts and differences of the normalized counts of each population. The difference in the normalized counts were derived by subtracting the normalized counts of non-interacting clusters from those of interacting clusters.
In the case of , the fraction of non-barred low-sSFR galaxies in interacting clusters decreases by point in comparison with that of non-interacting clusters. Meanwhile, almost the same amount of barred high-sSFR galaxies () increases. However, the barred low-sSFR and non-barred high-sSFR galaxies show negligible changes in the proportion within the errors. The net effect is that in interacting clusters increases by point (or a factor of ) compared with that of non-interacting clusters, which is consistent with the middle panel of Figure 4. Another net effect is the enhancement of bar fraction ( times) in interacting clusters as in 66. Although many different paths can be considered for the change in of galaxies in each category, the most straightforward interpretation is that the enhancement of in interacting clusters is almost entirely due to the transformation of non-barred low-sSFR galaxies into barred high-sSFR galaxies. This implies that the star-formation enhancement in moderate-mass disk-dominated galaxies of interacting clusters is related to the bar formation via cluster–cluster interactions.
In the case of , the transition between low-sSFR galaxies and high-sSFR galaxies is negligible ( point), when comparing interacting clusters to non-interacting clusters, which is also in agreement with the middle panel of Figure 4. However, the fraction of barred galaxies in interacting clusters increases by a factor of within each low- or high-sSFR bin as in 66. Adopting the most simplistic interpretation again, this result suggests that the bar formation by cluster–cluster interaction is not noticeably related to star-formation enhancement in high-mass disk-dominated galaxies, which is in contrast with their moderate-mass counterparts.
IV Discussion
In the previous section, we show that is moderately enhanced in interacting clusters compared with non-interacting clusters, and the enhancement occurs only in moderate-mass disk-dominated galaxies. This is in contrast to the bar fraction enhancement that was found to occur more in high-mass disk-dominated galaxies in interacting clusters (66). Furthermore, the enhancement of in moderate-mass disk-dominated galaxies is found to be directly related to the increase in the number of galaxies with bars.
Our result on the enhancement of in interacting clusters is comparable to the results found in Cohen et al. 2014; Cohen et al. 2015, who used SDSS data and a large number (over 100) of clusters. They found that is – higher in clusters with substructures or unrelaxed clusters, which is similar to or slightly higher than the value of our result ( or up to depending on the galaxy types). The result of Cohen et al. 2014 is mainly based on galaxies brighter than . Borrowing the – conversion formula1616 16 in Yoon et al. 2017, corresponds to for star-forming galaxies and for quiescent galaxies. Therefore, their magnitude-cut sample is similar to our mass-cut sample, except that they miss moderate-mass quiescent galaxies in our sample, and hence their result is consistent with ours.
Our result is also similar to the result of Hou et al. 2012, in which they used 15 rich groups and reported the enhancement of () in groups with substructures. Stroe et al. 2017 used 19 clusters with a total sample of over 3000 galaxies and found that the H luminosity function for clusters in mergers shows a higher characteristic density than relaxed clusters, which qualitatively agrees with our result. Overall, our finding of the enhancement in interacting clusters confirms results from previous works.
On the other hand, we find an unique aspect of the enhancement in that the enhancement is mostly from moderate-mass galaxies with . Note that Okabe et al. 2019 did not find the enhancement (within ) between merging and single clusters for galaxies with , although they did not completely reject the possibility of star-formation enhancement in merging clusters. Their result can be understood as a result of the mass dependence of the enhancement.
The -dependent trend in can be explained by the different amount of gas in disk galaxies with different . It is known that lower-mass disk galaxies have more plentiful gas than higher-mass disk galaxies (Erb et al. 2006; Hopkins et al. 2009; Masters et al. 2012). According to this notion, for moderate-mass disk-dominated galaxies, the bar formation in interacting clusters can be easily accompanied with the SFR enhancement, since they have a relatively high amount of gas.1717 17 Several previous studies show that some galaxies in clusters in merging processes or with substructures can have large amounts of H I gas or molecular gas contents that are comparable to field galaxies (Stroe et al. 2015; Cybulski et al. 2016; Cairns et al. 2019). On the other hand, the gas contents are less abundant for high-mass disk-dominated galaxies. Thus, bars can be triggered easily in those galaxies as shown in 66 and Figure 7, since the less abundant gas contents for a given in disk galaxies are more favorable for formation of bars (Berentzen et al. 1998; Berentzen et al. 2004; Bournaud et al. 2005; Villa-Vargas et al. 2010; Masters et al. 2012). However, due to the low amount of gas, the formation of bars in interacting clusters is not translated into the triggering of star formation in high-mass disk-dominated galaxies.
In 66, we argued that the time-dependent tidal gravitational field during the cluster–cluster interaction is responsible for inducing bars as suggested by a simulation work of Bekki 1999. The enhancement of in moderate-mass disk-dominated galaxies can be understood under the same framework. Specifically, the time-dependent tidal force in interacting clusters exerts non-axisymmetric perturbation to a disk galaxy and subsequently creates a bar. Then, the bar structure exerts forces onto gas components and makes the gas funnel into the central region of the galaxy, thereby triggering the star formation there (Kim et al. 2012; Seo & Kim 2013; Carles et al. 2016). In this manner, galaxies with the newly formed bars in interacting clusters can also become the newly triggered high-sSFR galaxies. Indeed, as shown in sSFR distributions in Figure 8, the of barred moderate-mass disk-dominated galaxies in interacting clusters () is far higher than that of non-barred ones () in the same clusters.
As shown in Figure 8, the in barred moderate-mass disk-dominated galaxies in non-interacting clusters () is slightly higher (but not statistically significant as in the case of the interacting clusters) than that of non-barred ones in non-interacting clusters (). This could be also attributed to the bar-driven enhancement of star formation. However, in non-interacting clusters, the bar formation is likely not due to a cluster-wide mechanism occurring in a narrow time period as in the case of interacting clusters. Therefore, a number of bars formed recently (and subsequent star-formation activities triggered recently) would be smaller in non-interacting clusters than in interacting clusters. Accordingly, the value in barred moderate-mass disk-dominated galaxies is not as high as that of the counterparts in interacting clusters, since cluster environments are disadvantageous for preservation of star-formation activities.
According to our results, the ages of bar structures in interacting clusters are expected to be statistically younger than their counterparts in non-interacting clusters. Future studies on the ages of bar structures in interacting and non-interacting clusters should be able to verify this fact.
V Summary
The first aim of this study is to investigate whether in interacting clusters is enhanced compared with that of non-interacting clusters. The second aim is to examine the link between the enhancement and the bar fraction enhancement in interacting clusters. To do so, we used the samples of galaxies and clusters from 66, which are based on the MPA–JHU catalog. In total, 105 galaxy clusters at were examined, among which 16 are interacting clusters. The main conclusions are summarized as follows.
- 1.
is moderately enhanced in interacting clusters compared with non-interacting clusters: is times higher in interacting clusters than in non-interacting clusters.
- 2.
The enhancement of in interacting clusters occurs only in moderate-mass disk-dominated galaxies ( and ). This can be attributed to the relatively abundant gas contents in those galaxies compared to high-mass or bulge-dominated ones.
- 3.
The enhancement of in moderate-mass disk-dominated galaxies in interacting clusters is directly related to the increase of the number of barred galaxies, which implies a connection between the star-formation enhancement and the bar formation by cluster–cluster interactions.
- 4.
Our results can be well explained by a mechanism that induces bars and triggers subsequent star-formation through the newly induced bars in disk galaxies in interacting clusters. One plausible physical mechanism is the time-dependent tidal gravitational field during the cluster–cluster interaction (Bekki 1999).
Our results imply that the most energetic phenomenon in large-scale environments such as cluster–cluster interaction can induce bars (66) and star formation at the same time in cluster galaxies. The exact details of how the cluster–cluster interaction induces star formation and bars need to be understood through future simulation and observational studies with a larger sample.
References
- Abell et al. (1989) Abell, G. O., Corwin, H. G., & Olowin, R. P. 1989, ApJS, 70, 1
- Aihara et al. (2011) Aihara, H., Allende Prieto, C., An, D., et al. 2011, ApJS, 193, 29
- Bekki (1999) Bekki, K. 1999, ApJ, 510, L15
- Bekki et al. (2010) Bekki, K., Owers, M. S., & Couch, W. J. 2010, ApJ, 718, L27
- Berentzen et al. (2004) Berentzen, I., Athanassoula, E., Heller, C. H., & Fricke, K. J. 2004, MNRAS, 347, 220
- Berentzen et al. (1998) Berentzen, I., Heller, C. H., Shlosman, I., & Fricke, K. J. 1998, MNRAS, 300, 49
- Berrier et al. (2009) Berrier, J. C., Stewart, K. R., Bullock, J. S., et al. 2009, ApJ, 690, 1292
- Böhringer et al. (2017) Böhringer, H., Chon, G., & Fukugita, M. 2017, A&A, 608, A65
- Bournaud et al. (2005) Bournaud, F., Combes, F., & Semelin, B. 2005, MNRAS, 364, L18
- Cairns et al. (2019) Cairns, J., Stroe, A., De Breuck, C., et al. 2019, ApJ, 882, 132
- Calzetti et al. (2000) Calzetti, D., Armus, L., Bohlin, R. C., et al. 2000, ApJ, 533, 682
- Carles et al. (2016) Carles, C., Martel, H., Ellison, S. L., et al. 2016, MNRAS, 463, 1074
- Cava et al. (2017) Cava, A., Biviano, A., Mamon, G. A., et al. 2017, A&A, 606, A108
- Chabrier (2003) Chabrier, G. 2003, PASP, 115, 763
- Chung et al. (2009) Chung, S. M., Gonzalez, A. H., Clowe, D., et al. 2009, ApJ, 691, 963
- Cohen et al. (2014) Cohen, S. A., Hickox, R. C., Wegner, G. A., et al. 2014, ApJ, 783, 136
- Cohen et al. (2015) Cohen, S. A., Hickox, R. C., & Wegner, G. A. 2015, ApJ, 806, 85
- Cole et al. (2000) Cole, S., Lacey, C. G., Baugh, C. M., et al. 2000, MNRAS, 319, 168
- Cybulski et al. (2016) Cybulski, R., Yun, M. S., Erickson, N., et al. 2016, MNRAS, 459, 3287
- Demarco et al. (2010) Demarco, R., Wilson, G., Muzzin, A., et al. 2010, ApJ, 711, 1185
- Deshev et al. (2017) Deshev, B., Finoguenov, A., Verdugo, M., et al. 2017, A&A, 607, A131
- Dressler & Shectman (1988) Dressler, A., & Shectman, S. A. 1988, AJ, 95, 985
- Ebeling, & Kalita (2019) Ebeling, H., & Kalita, B. S. 2019, ApJ, 882, 127
- Erb et al. (2006) Erb, D. K., Steidel, C. C., Shapley, A. E., et al. 2006, ApJ, 646, 107
- Fujita et al. (1999) Fujita, Y., Takizawa, M., Nagashima, M., et al. 1999, PASJ, 51, L1
- Fukugita et al. (1998) Fukugita, M., Hogan, C. J., & Peebles, P. J. E. 1998, ApJ, 503, 518
- Haines et al. (2009) Haines, C. P., Smith, G. P., Egami, E., et al. 2009, ApJ, 704, 126
- Hopkins et al. (2009) Hopkins, P. F., Somerville, R. S., Cox, T. J., et al. 2009, MNRAS, 397, 802
- Hou et al. (2012) Hou, A., Parker, L. C., Wilman, D. J., et al. 2012, MNRAS, 421, 3594
- Hwang & Lee (2009) Hwang, H. S., & Lee, M. G. 2009, MNRAS, 397, 2111
- Im et al. (1997) Im, M., Griffiths, R. E., & Ratnatunga, K. U. 1997, ApJ, 475, 457
- Im et al. (2002) Im, M., Simard, L., Faber, S. M., et al. 2002, ApJ, 571, 136
- Jedrzejewski (1987) Jedrzejewski, R. I. 1987, MNRAS, 226, 747
- Kim et al. (2016) Kim, J.-W., Im, M., Lee, S.-K., et al. 2016, ApJ, 821, L10
- Kim et al. (2012) Kim, W.-T., Seo, W.-Y., Stone, J. M., Yoon, D., & Teuben, P. J. 2012, ApJ, 747, 60
- Kelvin et al. (2014) Kelvin, L. S., Driver, S. P., Robotham, A. S. G., et al. 2014, MNRAS, 444, 1647
- Kriek et al. (2009) Kriek, M., van Dokkum, P. G., Labbé, I., et al. 2009, ApJ, 700, 221
- Lagos et al. (2012) Lagos, C. del P., Bayet, E., Baugh, C. M., et al. 2012, MNRAS, 426, 2142
- Lee et al. (2019) Lee, S.-K., Im, M., Hyun, M., et al. 2019, MNRAS, 490, 135
- Mansheim et al. (2017) Mansheim, A. S., Lemaux, B. C., Tomczak, A. R., et al. 2017, MNRAS, 469, L20
- Masters et al. (2012) Masters, K. L., Nichol, R. C., Haynes, M. P., et al. 2012, MNRAS, 424, 2180
- McGee et al. (2009) McGee, S. L., Balogh, M. L., Bower, R. G., et al. 2009, MNRAS, 400, 937
- Miller, & Owen (2003) Miller, N. A., & Owen, F. N. 2003, AJ, 125, 2427
- Oh et al. (2012) Oh, S., Oh, K., & Yi, S. K. 2012, ApJS, 198, 4
- Okabe et al. (2019) Okabe, N., Oguri, M., Akamatsu, H., et al. 2019, PASJ, 71, 79
- Oohama et al. (2009) Oohama, N., Okamura, S., Fukugita, M., et al. 2009, ApJ, 705, 245
- Owen et al. (1999) Owen, F. N., Ledlow, M. J., Keel, W. C., et al. 1999, AJ, 118, 633
- Owen et al. (2005) Owen, F. N., Ledlow, M. J., Keel, W. C., et al. 2005, AJ, 129, 31
- Poggianti et al. (2004) Poggianti, B. M., Bridges, T. J., Komiyama, Y., et al. 2004, ApJ, 601, 197
- Reiprich, & Böhringer (2002) Reiprich, T. H., & Böhringer, H. 2002, ApJ, 567, 716
- Rines et al. (2007) Rines, K., Diaferio, A., & Natarajan, P. 2007, ApJ, 657, 183
- Rossetti et al. (2016) Rossetti, M., Gastaldello, F., Ferioli, G., et al. 2016, MNRAS, 457, 4515
- Schellenberger et al. (2019) Schellenberger, G., David, L., O’Sullivan, E., et al. 2019, ApJ, 882, 59
- Seo & Kim (2013) Seo, W.-Y., & Kim, W.-T. 2013, ApJ, 769, 100
- Shim et al. (2011) Shim, H., Im, M., Lee, H. M., et al. 2011, ApJ, 727, 14
- Soares, & Rembold (2019) Soares, N. R., & Rembold, S. B. 2019, MNRAS, 483, 4354
- Sobral et al. (2015) Sobral, D., Stroe, A., Dawson, W. A., et al. 2015, MNRAS, 450, 630
- Strauss et al. (2002) Strauss, M. A., Weinberg, D. H., Lupton, R. H., et al. 2002, AJ, 124, 1810
- Stroe et al. (2015) Stroe, A., Oosterloo, T., Röttgering, H. J. A., et al. 2015, MNRAS, 452, 2731
- Stroe et al. (2017) Stroe, A., Sobral, D., Paulino-Afonso, A., et al. 2017, MNRAS, 465, 2916
- Stroe et al. (2014) Stroe, A., Sobral, D., Röttgering, H. J. A., et al. 2014, MNRAS, 438, 1377
- Tomita et al. (1996) Tomita, A., Nakamura, F. E., Takata, T., et al. 1996, AJ, 111, 42
- Tyler et al. (2014) Tyler, K. D., Bai, L., & Rieke, G. H. 2014, ApJ, 794, 31
- Villa-Vargas et al. (2010) Villa-Vargas, J., Shlosman, I., & Heller, C. 2010, ApJ, 719, 1470
- Yoon et al. (2017) Yoon, Y., Im, M., & Kim, J.-W. 2017, ApJ, 834, 73
- Yoon et al. (2019) Yoon, Y., Im, M., Lee, G.-H., et al. 2019, Nature Astronomy, 3, 844