A phase separation of active colloidal suspension via Quorum-sensing
Abstract
We present the Brownian dynamics simulation of active colloidal suspension in two dimensions, where the self-propulsion speed of a colloid is regulated according to the local density sensed by it. The role of concentration-dependent motility on the phase-separation of colloids and their dynamics is investigated in detail. Interestingly, the system phase separates at a very low packing fraction () at higher self-propulsion speeds (Pe), which coexists with a homogeneous phase and attains long-range crystalline order beyond a transition point. The transition point is quantified here from the local density profiles, local and global-bond order parameters. We have shown that the phase diagram’s characteristics are qualitatively akin to the active Brownian particle (ABP) model. Moreover, our investigation reveals that the density-dependent motility amplifies the slow-down of the directed speed, which facilitates phase-separation even at low packing fractions. The effective diffusivity shows a crossover from quadratic rise to a power-law behavior of exponent with Pe in the phase-separated regime. Furthermore, we have shown that the effective diffusion decreases exponentially with packing fraction in the phase-separated regime while linear decrease in the single phase regime.
I Introduction
A collection of self-propelled units constitutes an out-of-equilibrium system that harvests ambient energy from the environment to perform a long-persistent motion Marchetti et al. 2013; Cates 2012; Zöttl and Stark 2016. These systems exhibit complex collective dynamics which are markedly different from their passive counterpart, such as self-organisation at low density Corte et al. 2008; Peruani et al. 2006; Gopinath et al. 2012; Pohl and Stark 2014; Lin et al. 2018; Narayan et al. 2007; Chaté et al. 2006; Redner et al. 2013, flocking Mora et al. 2016; Ballerini et al. 2008, swarming Cavagna et al. 2017, vortex-formation Bricard et al. 2015, the formation of linear chains Yan et al. 2016, anomalously large density fluctuations Fily and Marchetti 2012, non-monotonic behavior in the active pressure Winkler et al. 2015; Solon et al. 2015; Takatori et al. 2014, etc. In the past, phase separation of the self-propelled systems has been rigorously explored in the laboratories where dynamical structures are contrived by employing light controlled motion of active colloids Palacci et al. 2013; Bricard et al. 2015; Singh et al. 2017, diffusiophoretic motion or concentration-gradient driven motion Buttinoni et al. 2013; Buttinoni et al. 2012; Ginot et al. 2018; Singh et al. 2017; Theurkauff et al. 2012; Palacci et al. 2014; Schmidt et al. 2019.
Within the framework of theory and simulations, the phase-separation of a self-propelled system of hard colloids has been explored by treating their motion either as a ‘run and tumble’ model Lee et al. 2019; Berg and Brown 1972; Turner et al. 2000; Ariel et al. 2018, active Ornstein-Uhlenbeck (AOU) particles Paoluzzi et al. 2016; Maggi et al. 2020; Caprini et al. 2019, or as an active Brownian particle (ABP) model Bialké et al. 2012; Speck et al. 2014; Speck et al. 2015; Bialké et al. 2013; Pu et al. 2017; Cates et al. 2010; McCandlish et al. 2012; Redner et al. 2013; Anand and Singh 2018; Anand and Singh 2020. The self-propulsion causes phase separation referred as motility-induced phase separation (MIPS) Bialké et al. 2015; Cates and Tailleur 2015; Cates and Tailleur 2013; Digregorio et al. 2018; Gonnella et al. 2015; Barré et al. 2015; Suma et al. 2014; Sese-Sansa et al. 2018; Fily and Marchetti 2012; Redner et al. 2013; Cates and Tailleur 2013; Digregorio et al. 2018; Caprini et al. 2020; Solon et al. 2018, which is a consequence of the slow-down of the active colloids produced by steric-interactions Patch et al. 2017; Solon et al. 2018. In MIPS, a liquid-like dense aggregate of slow-moving colloids coexists with a gas-like phase of fast-moving colloids at low-density Bialké et al. 2015; Cates and Tailleur 2015; Cates and Tailleur 2013; Digregorio et al. 2018; Gonnella et al. 2015; Barré et al. 2015; Suma et al. 2014; Sese-Sansa et al. 2018; Fily and Marchetti 2012; Redner et al. 2013; Cates and Tailleur 2013; Digregorio et al. 2018; Solon et al. 2018. In the standard ABP model, the phase-separation arises at packing fractions () even in the absence of any attractive or alignment interactions Fily and Marchetti 2012. Additionally, the presence of an attractive short-range interaction among ABPs causes significant changes on local inhomogeneity, separation of mixtures, and also adds to re-entrant phase behavior Redner et al. 2013; Agudo-Canalejo and Golestanian 2019.
The aggregation in biological systems at low density is a ubiquitous phenomenon Ishimoto and Gaffney 2018; Reid et al. 1990; Schramm et al. 2020. Concurrently, coordinated motion in these systems is often a consequence of complex communication pathways among their individual units. Bacterial colonies, like Aliivibrio fischeri, Vibrio harveyi, Erwinia carotovora, etc., produce extracellular enzymes called auto-inducers, which regulate their gene expression Fuqua et al. 1996; Brown and Johnstone 2001; Lupp and Ruby 2005; Sperandio et al. 2002; Bassler 1999; Crespi 2001, thus act as a means of communication among cells Bäuerle et al. 2018; Bassler 1999. For instance, Aliivibrio fischeri Lupp and Ruby 2005 produces luminescence after their local population growth surpasses a threshold density. The communication among the bacterial cells triggered by the variation in local population density is termed ‘quorum-sensing’. It plays vital role in the regulation of various physiological processes like manoeuvring local population density, regulation of gene expression Lupp and Ruby 2005; Sperandio et al. 2002; Bassler 1999, communication among cells Bäuerle et al. 2018; Bassler 1999, motility Bäuerle et al. 2018; Sperandio et al. 2002, etc. Despite the vast applications of ‘quorum-sensing’ in biology, this subject has been addressed far less in simulations, especially for the ABPs McCandlish et al. 2012; Velasco et al. 2018; Solon et al. 2018.
The variation of self-propulsion speed as a function of local density has been accounted in theoretical continuum models using phenomenological hydrodynamic equations with local density as a coarse-grained field. Interestingly, this model also unveils MIPS. Importantly, it provides a unified approach for the phase-separation using quorum-sensing rule and the generic constant activity model with pair-wise interactions Farrell et al. 2012; Solon et al. 2018; Cates and Tailleur 2015. A detailed study on the role of controlled and explicit density-dependent activity on the MIPS would provide more insights into the underlining behavior. We attempt here to reveal the role of quorum-sensing contribution along with pair-wise repulsive forces in the phase separation. Additionally, we compare our results to that of generic ABP model.
The article presents Brownian dynamics simulation of ABPs whose motility is regulated by linearly decreasing self-propulsion force with local density. The density-dependent motility induces cluster formation with hexatic ordering at relatively low packing fractions , in the high activity regime. The local density distribution confirms the presence of large dense clustered phase coexisting with a homogeneous low-density phase beyond a critical density. The local and global order parameters such as and , respectively, ascertain the presence of hexatic ordering at higher Péclet numbers. We have shown that the emergence of the coexistence of low and high-density phases at very low packing is a consequence of multi-body collisions leading to drastic slow-down of the swim speed. In addition, the effective diffusion coefficient in the phase-separated state displays a cross over from a parabolic rise to a power-law behavior with an exponent with Péclet number Winkler et al. 2015; Takatori et al. 2014. Moreover, the total pressure exhibits a sharp decrease in the phase-separated regime, as expected.
The article is organised as follows: Section 2 elaborates the simulation approach, all the results are presented in section 3 that consists 5 different sub-sections, with the summary in section 4.
II Simulation Model
We model self-propelled discs, in two dimensions, interacting with each other via repulsive-shifted Lennard Jones (LJ) potential,
| (1) |
Where is the distance between the pair and , is the LJ energy, and is the diameter of disc.
The equation of motion for the position and its orientation vector are governed by the over-damped Langevin equation,
| (2) |
Where is the drag coefficient, is the thermal noise with zero mean, is the magnitude of the active force, and its orientation is given by the unit vector . The direction of polar vector obeys the equation of motion of rotational diffusion, angle measured from the x-axis.
The friction coefficient and the thermal noise are coupled via fluctuation-dissipation relation, . Similarly, is a random torque on a particle, and the relation of random torque with rotational diffusion is given as . Where, and are the translational and rotational diffusion constants, respectively.
The effect of local environment on the motility is taken in an approximate manner. For simplicity, motility () of a particle is assumed to be a linear function of its nearest neighbors within a fixed cut-off distance, . Thus the active force linearly diminishes with the increase in local population as,
| (3) |
and for , where stands for the number of nearest neighbors of the particle, is the active force on an isolated particle that is modified to in the presence of neighbors within a cut-off distance of . Here, is chosen approximately to the first minimum in the radial distribution function of a dense system. The cut-off is chosen larger than the pair-wise interaction potential.
The constants and are chosen so that the function is calibrated in a linearly decreasing form from to . If the center of a neighboring particle crosses the cut-off distance, then it is assumed to be completely inside the screening area. The apparent local area fraction of the circle of radius within the neighbors of particle and itself at the center is approximated as , with , is the approximate maximum area of the neighboring disk to located within the cut-off distance , which is same as at .
The parameters are presented in the dimensionless form with the length scaled by , energy in the unit of (thermal energy), and time in unit of . The Brownian dynamics simulation is employed with a time step in the range of to . The simulation box is taken to be a square with a side of length and periodic in each direction. All the results are quantified in the parameter landscape of packing fraction , and dimensionless Péclet number in equivalence with self-propulsion speed. The number of particles , unless stated otherwise. The box length is varied to achieve the packing fractions to and Pe is varied in the range of to . The good statistics for each simulation data set is generated by averaging over ten independent ensembles.
III Results
III.1 Phase Separation
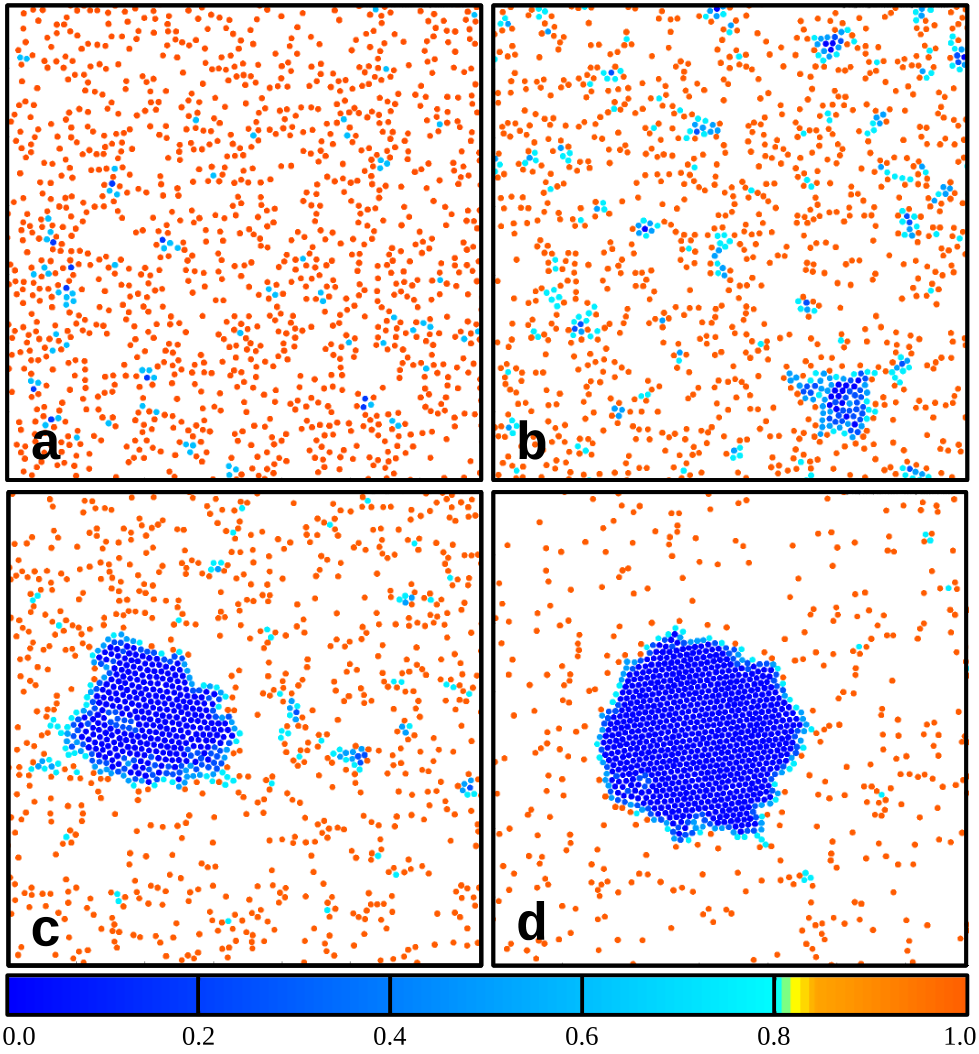
The considered system of quorum sensing ABPs is observed to display phase-separation at a high activity strength even at very low densities. The simulation snapshots in Fig. 1- a, b, c, and d, at , , , and respectively, illustrate the emergence of the aggregated-dense structures. For low Péclet numbers, the system exhibits mostly gas-like homogeneity, with a few small aggregates having a short life-time. These aggregates grow in the intermediate regime ( for ) with liquid-like characteristics (see Fig. 1-a and b). However, the dense aggregate grows further for large Pe and remains stable for all time scales. The size of the largest aggregate attains the order of the system size in the asymptotic limit for (see Fig. 1-d). Moreover, once in the steady-state at high Péclet numbers, the aggregate acquires a long-range ordering, as Fig. 1-c and d illustrate, concurrent with the previous studies Redner et al. 2013; Fily and Marchetti 2012.
The phase separation in ABPs is a consequence of multi-body collisions at large Pe causing slow-down of the speed in the denser region, which further leads to the aggregation of slow-moving colloids. Figure 1 illustrates this effect, where blue color represents slow-moving colloids while the reds are fast-moving. The chosen model for density-dependent motility imparts influence on microscopic dynamics. Hence, it is imperative to examine the structural properties from a microscopic perspective. For that, we probe the heterogeneous local density profiles appearing at large Pe. In order to compute the normalised local density profile (Fig.2-a), the simulation box is divided into smaller subsystems (), which is approximately 500 times smaller than the original system. The local packing fraction is estimated in these subsystems at . In the large Pe limit ( for ), the normalised density distribution displays a bimodal peak, one at a lower density and the other at higher density (aggregated phase). The characteristic feature of phase-separation, i.e. coexistence of low and high density phases, is distinctly captured in the local density profile beyond a transition Péclet number termed here onward as .
The distribution suggests that beyond the transition point, the system also consists of a dense aggregate, which we call the largest cluster (). The growth of the clustered phase is quantified using , where is the size of any cluster in the simulation box. Fig. 2-b illustrates as a function of Pe for a range of to . The presence of a prominent dense clustered phase results in a sharp transition in the largest cluster size and its size tends to saturate in the limit of high Pe far beyond the transition point.
III.2 Structure of Cluster
A hexagonal crystalline order is prevalent in the dense clustered phase beyond . To corroborate our claim of hexagonal ordering in the largest cluster in 2D, we employ a bond orientational order parameter frequently used in the literature, Theers et al. 2018; Bialké et al. 2012; Zöttl and Stark 2014; Steinhardt et al. 1983; Tung et al. 2016,
| (4) |
where is the set of six nearest neighbors of particle and is the bond angle between a pair around an arbitrary axis. From the local defined parameter , we derive a global order parameter Bialké et al. 2012,
| (5) |
The global order parameter lies in the range of , where represents the isotropic phase of the system, is for the perfect crystalline phase, and the intermediate value corresponds to a fraction of region with hexagonal ordering Theers et al. 2018; Bialké et al. 2012; Zöttl and Stark 2014; Steinhardt et al. 1983; Tung et al. 2016. The order parameter in the considered system of quorum sensing ABPs is vanishing in the limit of small Péclet numbers (). In the phase-separated state, a non-zero value of appears with a sharp monotonic rise as depicted in Fig. 3. This reveals the presence of a long-range ordered structure. As expected, the degree of ordering increases as a function of Pe and . Analogous to , a correlation , is generally used as a measure of local bond-order parameter to distinguish from local crystalline to homogeneous phase. The distribution also highlights a bimodal peak in the phase-separated states (see Fig. SI-3), which manifest local crystalline ordering.

The phase-diagram of the quorum sensing ABPs are quantified and presented in Fig. 4 in the parameter space of Pe and . The solid line in Fig. 4 indicates the transition Péclet number, (), for which the local density distribution (Fig 2-b) reveals a bimodal curve. The phase diagram is mapped using values of corresponding to the color bar in Fig. 4. A homogeneous state is represented by the predominantly red region below the solid line, while the green and blue regions represent the aggregate phase. A thin yellow region illustrates the initiation of hexagonal ordering within the dense clustered phase (also shown by a dashed line in Fig. 4). The narrow region between the phase boundary and the dashed line marks the phase, where the aggregates are formed as a result of phase separation but do not have a significant hexagonal ordering. The values in this region is negligible compared to the ordered phase. The aggregate attains hexagonal ordering at slightly higher Péclet number. At sufficiently low packing fraction, i.e., , the system remains homogeneous for all Pe in the simulated window. The transition Péclet number decreases rapidly with and saturates at higher values, as displayed from the solid line with bullets in Fig. 4.
III.3 Swim Speed
The inherent mechanism of MIPS, without attractive or alignment interactions, involves the local slow-down of individual colloids due to an increase in local density. The local inhomogeneity near the transition point is apparent from local density distribution in Fig. 2- a. The existing continuum theoretical models for MIPS is mostly based on swim speed as an input parameter; therefore, it is crucial to obtain this quantity from the microscopic approach Stenhammar et al. 2013; Fily and Marchetti 2012. The numerical values of can be directly accessed from the simulations. The expression of is given by,
| (6) |
The above expression can also be written as , where the first term is from the self-propulsive force , and the second term is the contribution from the interactions, which in general is negative for repulsive potentials. Additionally, the self-propulsion force itself is a function of local density unlike the generic ABP models where it remains a constant value Stenhammar et al. 2013; Fily and Marchetti 2012. In the dilute limit , the interaction contribution vanishes, and the active contribution is nearly unchanged thus , where is the swim speed of an active colloids in dilute limit.
For the case of low Pe regime, the directed speed follows approximately a linear decay with (see Fig. 5- a), which is in congruence with the previous observations in MIPS in ABPs Stenhammar et al. 2014; Stenhammar et al. 2013; Fily and Marchetti 2012. The linear behavior of weakly deviates even in the single-phase at packing reasonably close to the transition point even for small Pe. Notably, the deviations from linearity attain a sharp jump with a non-linear decline in the phase-separated state as displayed in Fig. 5- a for . A noteworthy point at small and Pe is that all the curves follow a universal behavior with linear variation.
It is indispensable to analyse the role of active contribution () and the interaction contribution () to the swim speed separately to gain further insight. Fig. 5-b shows that the magnitude of the normalised interaction term increases linearly with for low Pe. The linear behaviour of even in homogeneous phase is likewise of generic ABP models at low Pe. However, the linearity deviates at higher densities even for low Pe in the homogeneous phase. For large , sharply decreases with a non-monotonic behavior. Additionally, the inset of Fig. 5- b displays the normalised active contribution, . Here, all curves follow a universal decreases at low densities. The deviation from this universal behavior appears at small Pe, for high densities, even for . The deviation displayed for is congruent with the behavior of in Fig. 5- a. Moreover, near the phase-separation (), also consist a sharp drop similar to Fig. 5-a. It reveals that a drastic change in is predominately responsible for the sharp decrease in the directed speed at larger Pe. Here, the range of quorum-sensing is larger than the short-range LJ interaction. This causes the speed to sharply decrease even before they undergo direct pair-wise collision. Thereby, as expected the slow moving particles will have smaller interaction values of to that of fast moving particles. Accordingly, the impact of collision contribution becomes weaker, hence for denser system sharply diminishes which is captured in Fig. 5-b main plot, at and ).
Furthermore, we have computed local swim speed with local packing fraction , which is illustrated in Fig. SI-6. The behavior is very similar to the globally averaged quantity, which additionally corroborates the claim of local slow-down at the microscopic level. To summarise, multi-body collisions emerges at higher Pe and , causing to set in the quorum-sensing behavior, which plays dominant role in the reduction of the directed speed unlike the generic ABP model where interaction term is vital.
III.4 Dynamics of cluster
The dynamical behavior of a colloid in the aggregate can be assessed through its mean-square-displacement (MSD). At the boundary of the aggregate, the colloid moves in and out from the cluster. Therefore, a convenient way to compute the MSD of the clustered particles is to consider those particles which are close to the centre of the cluster so that they do not leave the cluster in the characterised time window. As expected, at short time scales, the particles exhibit sub-diffusive behavior due to the constraint from the presence of several neighboring colloids in its proximity (see Fig. 6-a). At intermediate time scale, the self-propulsion is suppressed as the particles are caged within the aggregate. Consequently, MSD attains a plateau at this timescale. More importantly, the width of the plateau widens and becomes more prominent at higher Pe, as Fig. 6-a illustrates for a range of to . In the long time limit, colloid attains diffusive behavior. The enhanced diffusive dynamics of colloids are evident from MSD curves in the timescale . A dashed line indicates the super-diffusive behavior, where the MSD is super-diffusive according to with an exponent . The super-diffusive behavior is a consequence of large active force on the surface of the cluster, which drives significant fluctuations in its shape and additionally the propagation of fast-moving defects inside the cluster. The defect dynamics and shape of the cluster is illustrated in SI-Movie-1 and 2 for visualisation.
The characteristic dynamical features of the colloids can be presented in terms of the effective diffusion coefficient. For this, the MSD of the colloids is averaged over all particles (Fig. SI-4). The measured effective diffusion coefficient, from the diffusive regime, is plotted as a function of Pe in Fig. 6-b. For , the effective diffusion coefficient increases quadratically with Pe. On contrary, for and , grows with a power of exponent with Pe (see Fig. 6-b). The effective diffusion coefficient shows a cross-over from quadratic growth in the homogeneous state to behavior in the phase-separated state.
The inset of Fig.6-b shows behavior of the normalised , where is the effective diffusion coefficient for ideal active particles at the same Pe Winkler et al. 2015; Solon et al. 2015. As expected from the effective diffusion coefficient, the diffusive dynamics of particle substantially slows down with , as decreases with for all Pe Winkler et al. 2015. In the homogeneous phase, the effective diffusion coefficient follows approximately a linear behaviour, with with a larger slope reported in previous studies Stenhammar et al. 2014; Stenhammar et al. 2013; Fily and Marchetti 2012. However, for , the diffusion is suppressed sharply, as result shows an exponential behavior as, with .
III.5 Pressure
The total pressure of a system undergoing MIPS is used to identify phase boundaries as it exhibits a non-monotonic behavior on the density with a sharp jump at the transition point Winkler et al. 2015; Digregorio et al. 2018. The total pressure exhibits contributions from the thermal fluctuations, the interaction force, and the active force (active pressure). Total pressure can be expressed as , with individual contributions as, , the ideal gas pressure in 2D, , the active pressure, and , the standard virial term due to inter-particle interactions. The explicit forms of and are given as,
| (7) |
The total pressure defines an equation of state of ABPs without confinement. The ideal swim pressure is given as at a temperature in two dimensions Winkler et al. 2015; Solon et al. 2015. This expression acts as pressure for the ideal active particles at any density.
Figure 7 presents the scaled total pressure with multiplied by . Importantly, shows a universal behavior until the onset of phase separation. In the single-phase, we can write pressure as with . A sudden drop in pressure occurs at the transition point Winkler et al. 2015; Takatori et al. 2014; Solon et al. 2015 in Fig. 7. It suggests a discontinuous drop in active particles’ pressure due to slowdown of their speed in clusters. This behavior is in contrast to the plot of a continuous parabolic profile for , where system exist in a homogeneous single phase. The change in the behavior of pressure in the phase-separated state is a consequence of large-number fluctuations in the active systems Fily and Marchetti 2012 (see Fig. SI-1). It is important to emphasize here that relatively more pronounced drop in pressure is noticeable at the transition point than the previous studies Winkler et al. 2015; Takatori et al. 2014; Solon et al. 2015. In phase separated state, active contribution dominates (see Fig. SI-5), which shows that the surface effects are more prominent in the behavior of global variables.
III.6 Non-vanishing Motility of Quorum-Sensing
All the results so far discussed corresponds to the particular case where the active force becomes zero whenever a colloid gets surrounded by six or more colloids as defined in Eq. 3. Now we test our approach to a broader class of problem by mimicking non-zero motility in the dense region for . The mathematical equation for the density-dependent motility is same as given in Eq. 3, while the choice of and dictates a non-zero active force at , and are listed in table I. A series of simulations are carried out for a range of , where is the active force at , to test its influence on the phase-separation and robustness of the choice of the approach. The summary of results are translated into a phase diagram in Fig. 8, where it displays the aggregation of colloids in the parameter space of Pe and ratio of at . The shaded area in the plot displays phase separated state with hexagonal ordering. It indicates that the system continues to retain phase separation up to . As expected, phase-separation disappears for larger residual motility, and system attains the homogeneous phase further for .
| 1.0 | 1.8 | 0.0 |
| 1.06 | 1.62 | 0.1 |
| 1.14 | 1.44 | 0.2 |
| 1.24 | 1.26 | 0.3 |
| 1.37 | 1.08 | 0.4 |
| 1.55 | 0.8 | 0.5 |
IV Summary
We have presented over-damped Langevin dynamics simulations of active colloids whose motility vary with their local density. The alteration of self-propulsion speed with density is observed in nature for example bacterial systems Sokolov et al. 2007. A local model of quorum-sensing has been adopted in the past for the study of collective phenomena in active systems, and it displays fascinating global dynamics Velasco et al. 2018; Mishra et al. 2012; Farrell et al. 2012; Fischer et al. 2020. Our study reports that the system phase separates into a dense phase coexisting with a low-density phase at very small packing fractions () Redner et al. 2013; Bialké et al. 2015; Bialké et al. 2012. The dense clustered phase acquires hexatic ordering at higher activity strength beyond the critical point. Active particles in the cluster exhibit sub-diffusive dynamics at a short time due to local caging from neighboring particles. The effective diffusion coefficient grows according to in the phase-separated state, Winkler et al. 2015; Takatori et al. 2014 while a parabolic increase in the homogeneous phase is reported.
It has previously been established that MIPS is a consequence of a positive feedback mechanism between accumulation induced slow down, and slow speed drives accumulation in ABP models Cates and Tailleur 2013; Tailleur and Cates 2008. In our study, the mechanism behind aggregation is instigated by quorum-sensing phenomenon due to emergence of multi-body collisions at higher density and Pe. This sets up an apparent slow-down causes a sharp decline in the relative directed speed. Further, we have revealed that the slow down is dominated by quorum-sensing contribution (see Fig.5-b). Notably, the role of interaction contribution is weaker in contrast to the generic models. Slow down of speed also accounts for the reduction in effective-diffusivity, facilitating a crossover from the linear to exponential behavior.
The phase-separation strongly depends on the choice of the , a larger will push the phase-separation at slower self-propulsion speeds or smaller packing fractions. A smaller values will lead our model towards the standard ABP model, and the phase-separation at lower packing disappears. Additionally, it can also be visualized in simulations that the density-dependent contribution is sufficient enough to bring the phase-separation, likewise in the theoretical studies Solon et al. 2015, at relatively small Péclet numbers. Besides, these phase-separated states lag the long-range ordering present in largest cluster without pair-wise repulsive force (see Figure SI-7).
The linear behavior of and in single phase with existing models Fily and Marchetti 2012; Solon et al. 2015 exhibits the coefficients and larger than the previously reported approach Cates and Tailleur 2013; Tailleur and Cates 2008; Fily and Marchetti 2012. The Eq .3 suggests quorum-sensing influence causes a bigger effective diameter of colloidal interaction () than the generic repulsive ABP models, consequently they exhibit a larger effective scattering cross-section. This attributes to steeper slope ( and ) in the reduction of directed speed and effective diffusion coefficient.
The presented results are not unique for the adopted linear model proposed in Eq. 3; an exponentially decaying self-propulsion force also yields a similar phase-separation nearly at the same packing fraction. The qualitative behavior is presented in the supplementary text; see Fig. SI-7, and 8. In conclusion, a microscopic model of local density-dependent motility plays a crucial role in the kinetics of MIPS at low density, and the same mechanism also facilitates phase separation. The reduction in local directed speed (see SI-Fig. 6) of colloids asserts the importance of probing the microscopic dynamics, it may be useful in providing a complete picture of phase-diagram. Our approach considers simpler interactions; however various other effects may play a vital role in the collective dynamics. For example, viscous lubrication, hydrodynamics, and anisotropic shape of colloids may be worth considering for the realistic models. Additionally, a model of coarse-grained density (where local density is computed in weighted averaged fashion) over microscopic model might serve a better purpose in direct comparison with theoretical results Solon et al. 2018.
Acknowledgements
The authors would like to thank the HPC facility at IISER Bhopal for the computation time and DST SERB Grant No. YSS/2015/000230 and CRG/2020/000661 for the financial support. SKA and FJ thank Harsh Kumar for indulging in useful discussions at the initial stage of the work.
References
- Marchetti et al. (2013) M. C. Marchetti, J.-F. Joanny, S. Ramaswamy, T. B. Liverpool, J. Prost, M. Rao and R. A. Simha, Reviews of Modern Physics, 2013, 85, 1143.
- Cates (2012) M. E. Cates, Reports on Progress in Physics, 2012, 75, 042601.
- Zöttl and Stark (2016) A. Zöttl and H. Stark, Journal of Physics: Condensed Matter, 2016, 28, 253001.
- Corte et al. (2008) L. Corte, P. M. Chaikin, J. P. Gollub and D. J. Pine, Nature Physics, 2008, 4, 420.
- Peruani et al. (2006) F. Peruani, A. Deutsch and M. Bär, Physical Review E, 2006, 74, 030904.
- Gopinath et al. (2012) A. Gopinath, M. F. Hagan, M. C. Marchetti and A. Baskaran, Physical Review E, 2012, 85, 061903.
- Pohl and Stark (2014) O. Pohl and H. Stark, Physical review letters, 2014, 112, 238303.
- Lin et al. (2018) Z. Lin, C. Gao, M. Chen, X. Lin and Q. He, Current opinion in colloid & interface science, 2018, 35, 51–58.
- Narayan et al. (2007) V. Narayan, S. Ramaswamy and N. Menon, Science, 2007, 317, 105–108.
- Chaté et al. (2006) H. Chaté, F. Ginelli and R. Montagne, Phys. Rev. Lett., 2006, 96, 180602.
- Redner et al. (2013) G. S. Redner, A. Baskaran and M. F. Hagan, Phys. Rev. E, 2013, 88, 012305.
- Mora et al. (2016) T. Mora, A. M. Walczak, L. Del Castello, F. Ginelli, S. Melillo, L. Parisi, M. Viale, A. Cavagna and I. Giardina, Nature physics, 2016, 12, 1153–1157.
- Ballerini et al. (2008) M. Ballerini, N. Cabibbo, R. Candelier, A. Cavagna, E. Cisbani, I. Giardina, V. Lecomte, A. Orlandi, G. Parisi, A. Procaccini et al., Proceedings of the national academy of sciences, 2008, 105, 1232–1237.
- Cavagna et al. (2017) A. Cavagna, D. Conti, C. Creato, L. Del Castello, I. Giardina, T. S. Grigera, S. Melillo, L. Parisi and M. Viale, Nature Physics, 2017, 13, 914–918.
- Bricard et al. (2015) A. Bricard, J.-B. Caussin, D. Das, C. Savoie, V. Chikkadi, K. Shitara, O. Chepizhko, F. Peruani, D. Saintillan and D. Bartolo, Nature communications, 2015, 6, 1–8.
- Yan et al. (2016) J. Yan, M. Han, J. Zhang, C. Xu, E. Luijten and S. Granick, Nature materials, 2016, 15, 1095.
- Fily and Marchetti (2012) Y. Fily and M. C. Marchetti, Physical review letters, 2012, 108, 235702.
- Winkler et al. (2015) R. G. Winkler, A. Wysocki and G. Gompper, Soft matter, 2015, 11, 6680–6691.
- Solon et al. (2015) A. P. Solon, J. Stenhammar, R. Wittkowski, M. Kardar, Y. Kafri, M. E. Cates and J. Tailleur, Phys. Rev. Lett., 2015, 114, 198301.
- Takatori et al. (2014) S. C. Takatori, W. Yan and J. F. Brady, Phys. Rev. Lett., 2014, 113, 028103.
- Palacci et al. (2013) J. Palacci, S. Sacanna, A. P. Steinberg, D. J. Pine and P. M. Chaikin, Science, 2013, 339, 936–940.
- Singh et al. (2017) D. P. Singh, U. Choudhury, P. Fischer and A. G. Mark, Advanced Materials, 2017, 29, 1701328.
- Buttinoni et al. (2013) I. Buttinoni, J. Bialké, F. Kümmel, H. Löwen, C. Bechinger and T. Speck, Physical review letters, 2013, 110, 238301.
- Buttinoni et al. (2012) I. Buttinoni, G. Volpe, F. Kümmel, G. Volpe and C. Bechinger, Journal of Physics: Condensed Matter, 2012, 24, 284129.
- Ginot et al. (2018) F. Ginot, I. Theurkauff, F. Detcheverry, C. Ybert and C. Cottin-Bizonne, Nature communications, 2018, 9, 696.
- Theurkauff et al. (2012) I. Theurkauff, C. Cottin-Bizonne, J. Palacci, C. Ybert and L. Bocquet, Physical review letters, 2012, 108, 268303.
- Palacci et al. (2014) J. Palacci, S. Sacanna, S.-H. Kim, G.-R. Yi, D. Pine and P. Chaikin, Philosophical Transactions of the Royal Society A: Mathematical, Physical and Engineering Sciences, 2014, 372, 20130372.
- Schmidt et al. (2019) F. Schmidt, B. Liebchen, H. Löwen and G. Volpe, The Journal of chemical physics, 2019, 150, 094905.
- Lee et al. (2019) M. Lee, K. Szuttor and C. Holm, The Journal of chemical physics, 2019, 150, 174111.
- Berg and Brown (1972) H. C. Berg and D. A. Brown, Nature, 1972, 239, 500–504.
- Turner et al. (2000) L. Turner, W. S. Ryu and H. C. Berg, Journal of bacteriology, 2000, 182, 2793–2801.
- Ariel et al. (2018) G. Ariel, M. Sidortsov, S. D. Ryan, S. Heidenreich, M. Bär and A. Be’er, Physical Review E, 2018, 98, 032415.
- Paoluzzi et al. (2016) M. Paoluzzi, C. Maggi, U. M. B. Marconi and N. Gnan, Physical Review E, 2016, 94, 052602.
- Maggi et al. (2020) C. Maggi, M. Paoluzzi, A. Crisanti, E. Zaccarelli and N. Gnan, arXiv preprint arXiv:2007.12660, 2020.
- Caprini et al. (2019) L. Caprini, E. Hernández-García, C. López and U. M. B. Marconi, Scientific reports, 2019, 9, 1–13.
- Bialké et al. (2012) J. Bialké, T. Speck and H. Löwen, Physical review letters, 2012, 108, 168301.
- Speck et al. (2014) T. Speck, J. Bialké, A. M. Menzel and H. Löwen, Physical Review Letters, 2014, 112, 218304.
- Speck et al. (2015) T. Speck, A. M. Menzel, J. Bialké and H. Löwen, The Journal of chemical physics, 2015, 142, 224109.
- Bialké et al. (2013) J. Bialké, H. Löwen and T. Speck, EPL (Europhysics Letters), 2013, 103, 30008.
- Pu et al. (2017) M. Pu, H. Jiang and Z. Hou, Soft Matter, 2017, 13, 4112–4121.
- Cates et al. (2010) M. E. Cates, D. Marenduzzo, I. Pagonabarraga and J. Tailleur, Proceedings of the National Academy of Sciences, 2010, 107, 11715–11720.
- McCandlish et al. (2012) S. R. McCandlish, A. Baskaran and M. F. Hagan, Soft Matter, 2012, 8, 2527–2534.
- Redner et al. (2013) G. S. Redner, M. F. Hagan and A. Baskaran, Physical review letters, 2013, 110, 055701.
- Anand and Singh (2018) S. K. Anand and S. P. Singh, Physical Review E, 2018, 98, 042501.
- Anand and Singh (2020) S. K. Anand and S. P. Singh, Physical Review E, 2020, 101, 030501.
- Bialké et al. (2015) J. Bialké, T. Speck and H. Löwen, Journal of Non-Crystalline Solids, 2015, 407, 367–375.
- Cates and Tailleur (2015) M. E. Cates and J. Tailleur, Annu. Rev. Condens. Matter Phys., 2015, 6, 219–244.
- Cates and Tailleur (2013) M. E. Cates and J. Tailleur, EPL (Europhysics Letters), 2013, 101, 20010.
- Digregorio et al. (2018) P. Digregorio, D. Levis, A. Suma, L. F. Cugliandolo, G. Gonnella and I. Pagonabarraga, Physical review letters, 2018, 121, 098003.
- Gonnella et al. (2015) G. Gonnella, D. Marenduzzo, A. Suma and A. Tiribocchi, Comptes Rendus Physique, 2015, 16, 316–331.
- Barré et al. (2015) J. Barré, R. Chétrite, M. Muratori and F. Peruani, Journal of Statistical Physics, 2015, 158, 589–600.
- Suma et al. (2014) A. Suma, G. Gonnella, D. Marenduzzo and E. Orlandini, EPL (Europhysics Letters), 2014, 108, 56004.
- Sese-Sansa et al. (2018) E. Sese-Sansa, I. Pagonabarraga and D. Levis, EPL (Europhysics Letters), 2018, 124, 30004.
- Cates and Tailleur (2013) M. E. Cates and J. Tailleur, EPL (Europhysics Letters), 2013, 101, 20010.
- Digregorio et al. (2018) P. Digregorio, D. Levis, A. Suma, L. F. Cugliandolo, G. Gonnella and I. Pagonabarraga, Phys. Rev. Lett., 2018, 121, 098003.
- Caprini et al. (2020) L. Caprini, U. M. B. Marconi and A. Puglisi, Physical Review Letters, 2020, 124, 078001.
- Solon et al. (2018) A. P. Solon, J. Stenhammar, M. E. Cates, Y. Kafri and J. Tailleur, Physical Review E, 2018, 97, 020602.
- Patch et al. (2017) A. Patch, D. Yllanes and M. C. Marchetti, Physical Review E, 2017, 95, 012601.
- Agudo-Canalejo and Golestanian (2019) J. Agudo-Canalejo and R. Golestanian, Physical review letters, 2019, 123, 018101.
- Ishimoto and Gaffney (2018) K. Ishimoto and E. A. Gaffney, Scientific reports, 2018, 8, 15600.
- Reid et al. (1990) G. Reid, A. W. Bruce, M. Llano, J. McGroarty and M. Blake, Current Microbiology, 1990, 20, 185–190.
- Schramm et al. (2020) F. D. Schramm, K. Schroeder and K. Jonas, FEMS Microbiology Reviews, 2020, 44, 54–72.
- Fuqua et al. (1996) C. Fuqua, S. C. Winans and E. P. Greenberg, Annual review of microbiology, 1996, 50, 727–751.
- Brown and Johnstone (2001) S. P. Brown and R. A. Johnstone, Proceedings of the Royal Society of London. Series B: Biological Sciences, 2001, 268, 961–965.
- Lupp and Ruby (2005) C. Lupp and E. G. Ruby, Journal of bacteriology, 2005, 187, 3620–3629.
- Sperandio et al. (2002) V. Sperandio, A. G. Torres and J. B. Kaper, Molecular microbiology, 2002, 43, 809–821.
- Bassler (1999) B. L. Bassler, Current opinion in microbiology, 1999, 2, 582–587.
- Crespi (2001) B. J. Crespi, Trends in ecology & evolution, 2001, 16, 178–183.
- Bäuerle et al. (2018) T. Bäuerle, A. Fischer, T. Speck and C. Bechinger, Nature communications, 2018, 9, 1–8.
- Velasco et al. (2018) C. A. Velasco, M. Abkenar, G. Gompper and T. Auth, Physical Review E, 2018, 98, 022605.
- Farrell et al. (2012) F. Farrell, M. Marchetti, D. Marenduzzo and J. Tailleur, Physical review letters, 2012, 108, 248101.
- Theers et al. (2018) M. Theers, E. Westphal, K. Qi, R. G. Winkler and G. Gompper, Soft matter, 2018, 14, 8590–8603.
- Zöttl and Stark (2014) A. Zöttl and H. Stark, Physical review letters, 2014, 112, 118101.
- Steinhardt et al. (1983) P. J. Steinhardt, D. R. Nelson and M. Ronchetti, Physical Review B, 1983, 28, 784.
- Tung et al. (2016) C. Tung, J. Harder, C. Valeriani and A. Cacciuto, Soft Matter, 2016, 12, 555–561.
- Stenhammar et al. (2013) J. Stenhammar, A. Tiribocchi, R. J. Allen, D. Marenduzzo and M. E. Cates, Physical review letters, 2013, 111, 145702.
- Stenhammar et al. (2014) J. Stenhammar, D. Marenduzzo, R. J. Allen and M. E. Cates, Soft matter, 2014, 10, 1489–1499.
- Solon et al. (2015) A. P. Solon, H. Chaté and J. Tailleur, Physical review letters, 2015, 114, 068101.
- Sokolov et al. (2007) A. Sokolov, I. S. Aranson, J. O. Kessler and R. E. Goldstein, Phys. Rev. Lett., 2007, 98, 158102.
- Mishra et al. (2012) S. Mishra, K. Tunstrøm, I. D. Couzin and C. Huepe, Physical Review E, 2012, 86, 011901.
- Fischer et al. (2020) A. Fischer, F. Schmid and T. Speck, Physical Review E, 2020, 101, 012601.
- Tailleur and Cates (2008) J. Tailleur and M. Cates, Physical review letters, 2008, 100, 218103.