Far-infrared nebular spectral features from growing massive black holes Far-infrared nebular spectral features from growing massive black holes–2119
Abstract
Supermassive black holes (BHs) and their host galaxies are interlinked by virtue of feedbacks and are thought to be co-eval across the Hubble time. This relation is highlighted by an approximate proportionality between the BH mass and the mass of a stellar bulge of the host galaxy. However, a large spread of the ratio and a considerable excess of BH mass at redshifts , indicate that the coevolution of central massive BHs and stellar populations in host galaxies may have experienced variations in its intensity. These issues require a robust determination of the relevant masses (BH, stars and gas), which is difficult in the case of distant high-redshift galaxies that are unresolved. In this paper, we seek to identify spectral diagnostics that may tell us about the relative masses of the BH, the gas mass and stellar mass. We consider general features of SEDs of galaxies that harbour growing massive BHs, forming stars and interstellar/circumgalactic gas. We focus on observational manifestations of possible predominances or intermittent variations in evolutionary episodes of growing massive BHs and forming stellar populations. We consider simplified scenarios for star formation and massive BHs growth, and simple models for chemical composition of gas, for dust free gas as well as for gas with dust mass fraction of of the metal content. We argue that wideband multi-frequency observations (X-ray to submillimeter) of the composite emission spectra of growing BH, stellar population and nebular emission of interstellar gas are sufficient to infer their masses.
Keywords:
Accretion, accretion discs — black hole physics — galaxies: quasars: supermassive black holes — ISM: general — infrared: ISM — submillimeter: ISM1 Introduction
All massive galaxies in local universe are believed to host supermassive black holes (SMBHs) in their centres. Moreover, the mass of SMBHs are found to correlate with the mass of stellar population of host galaxies (Marconi & Hunt 2003; Häring & Rix 2004; Sani et al. 2011; Kormendy & Ho 2013; Heckman & Best 2014), which suggests a synergy between the formation and growth of SMBHs and their host galaxies. The correlation is however ambiguous. The dominant source of uncertainty stems from measurements of the SMBH mass, because most observational techniques require a calibration of to the observables used to measure it (Bentz et al. 2013; Kormendy & Ho 2013; Woo et al. 2013; Heckman & Best 2014). Further, the determination of stellar mass relies on the ‘mass-to-light’ ratio, which is only known within an accuracy of % (Kauffmann et al. 2003). For late-type low-mass galaxies (), there can also be uncertainties arising from strong starbursts during the last 1 Gyr (Salim et al. 2005). As a result, the relation between SMBH mass and stellar mass exhbits a spread of more than an order of magnitude (Heckman & Best 2014, see Fig 9b in). This has led Heckman & Best 2014 to conclude that the correlation between and in the local universe cannot be approximated as a simple linear proportionality. These complications reflect the nature of mutual feedbacks at work in the process of star formation and a growing SMBH in a host galaxy. At the same time, the analyses by Graham & Scott 2013; Woo et al. 2013 and Kormendy & Ho 2013 indicate that and stellar velocity dispersion in galactic centres are coupled tighter than . This implies that black hole growth is regulated mainly by the galaxy gravity, rather than by feedbacks between the growing SMBH and the stellar population, and it is essentially important to identify the contributions of all variables in this interplay. However, given the observational uncertainties, it is challenging to disentangle the mutual influences of growing BHs, the assemblage of the host galaxy itself, and the formation of stellar population in it during these epochs.
The problem regarding the relation becomes particularly acute when host galaxies at are concerned. Observations of [CII] 158 m line in a set of quasars have led Volonteri & Reines 2016 and Decarli et al. 2018 to conclude that the ratio at epochs is more than an order of magnitude higher than that in the local Universe. While at redshifts , the mean ratio of the BH to the dynamical mass is for sufficiently strong () [CII] lines (Decarli et al. 2018, see Fig. 12 in ), at low redshifts the BH to stellar mean mass ratio is only when host galaxies with AGNs are concerned (Reines & Volonteri 2015, see Fig 10 left in ). Under normal circumstances, the ratio of BH mass to dark matter mass would have been smaller in comparison with its ratio to stellar mass. The observed ratios, which are the other way around, perhaps reflect the dynamical features of mutual influences of growing BHs and stellar populations of host galaxies on the initial episodes or during the entire evolution. Examples of such models with up to are described in Agarwal et al. 2013; Volonteri et al. 2016. However, observational selection effects cannot be neglected in such observations (Decarli et al. 2018), and complementary direct observations would be crucially important for unveiling the synergy between SMBHs and their hosts.
It therefore appears that there may have been periods during the co-eval evolution of SMBH and its host galaxy in which the black hole mass may dominate over stellar and gas mass. It then becomes important to ask if this idea can be tested through observations. Although the masses of BH and stars can be estimated from the spectra of galaxies, such estimates become difficult in the presence of gas and dust. Previous works have identified some spectral features in optical, near- and mid-infrared bands for the case of SMBHs surrounded by interstellar medium of low-metallicity () based on a few scenarios (Agarwal et al. 2013; Natarajan et al. 2017; Volonteri et al. 2017). One scenario implies a black hole remnant of a massive Population III star as a SMBH seed (Tanaka & Haiman 2009; Madau et al. 2014; Volonteri et al. 2015; Lupi et al. 2016; Pezzulli et al. 2016), while in the other a more massive direct collapse black hole (DCBH) of acts as a seed. In both cases the stellar population is supposed to remain underdeveloped, such that growing BHs dominate the production of photons11 1 Agarwal et al. 2013 named such stages of galactic evolution as OBG – Obese Black hole Galaxies.. Spectral lines in mid-infrared (MIR) range turn out to be sensitive to heating and ionization regimes, which makes them possible in principle to identify with the upcoming James Webb Space Telescope (JWST). However, scenarios with Pop III black hole seeds predict the MIR line intensities to be weaker than the JWST detection limit (Valiante et al. 2016; Valiante et al. 2018), which makes it difficult to discriminate between the two scenarios, requiring alternative approaches to be pursued.
In the current paper we address the question whether observations of spectral energy distributions (SED) consisting of contributions from SMBHs, stellar populations and galactic gas of a distant host galaxy can be disentangled to infer the masses of these three actors. For this purpose we explore the multi-wavelength spectra: X-ray, optical, infrared and far-infrared wavebands to probe the synergy between growing massive BHs and their host galaxies when gas and dust shroud the central BH and stellar population. More specifically, we address the question whether the interrelations between the masses of black hole , of galactic gas , and galactic stellar population can be inferred through observations of the multi-wavelength spectra from such sources. In order not to increase the number of free parameters, we do not consider an evolutionary scenario. We focus only on whether the observed emissions from a galaxy consisting of stars, gas and a supermassive black hole can be discriminated in order to measure the masses of the constituents if the galaxy is not spatially resolved.
The paper is organized as follows. Section 2 contains the model description and numerical setup, Section 3 describes the results, while in Section 4 we discuss observational diagnostics, Section 5 summarizes the results.
2 Model description
2.1 Spectral energy distribution of a SMBH
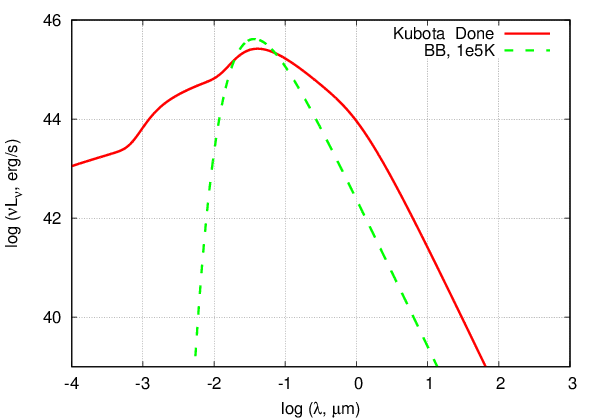
Following Natarajan et al. 2017 and Kubota & Done 2018 we assume that SMBH radiation comes from a slim disc (Abramowicz et al. 1988), with the Novikov-Thorne spectrum (Novikov & Thorne 1973) modified by a Comptonised extention up to high ( keV) energies (Kubota & Done 2018, see for more detail in). This choice is motivated by the fact that slim discs are radiatively inefficient and that the accretion flow is stable against Rayleigh-Taylor instability even for super-Eddington accretion rate (Abramowicz et al. 1988; Sadowski et al. 2009; Pacucci et al. 2015, see discussion in). An example of the spectrum is shown in Figure 1. For comparison, we also show a blackbody spectrum, which illustrates that in longer wavelengths (infrared to submm) the BH spectrum can be approximated as thermal radiation with effective temperature depending on the BH mass (Kubota & Done 2018, see ).

2.2 Stellar population
For the host galaxy we assume a spectral energy distribution (SED) of a single stellar population (SSP) based on the Padova 2000 stellar evolutionary tracks (Girardi et al. 2000) with the Salpeter inital mass function (IMF) (Bruzual & Charlot 2003). For SSP we consider two models with a low (, ) and with solar metallicity. The bolometric luminosity of the SSP is taken to be and , equal to Eddington luminosities of BHs with and , respectively. The corresponding stellar masses can be roughly estimated as and for local late-type galaxies (Faber & Gallagher 1979, see in ).
Figure 2 presents three SEDs models of stellar population from the spectra library of Bruzual & Charlot 2003: a young population of an age 30 Myr for , a middle-aged (200 Myr) population for and a moderately old population of 1 Gyr for solar metallicity. Increasing the metallicity for the young SSP leads to an enhanced luminosity at the IR/submm wavelengths. Older populations show two noticeable features in the SEDs. On one hand, in the initial 100 Myr young massive stars dominate in the UV part of the spectrum, and at later epochs, the most massive stars leave the main sequence and evolve into red giants, making the UV part to decline and the infrared emission to rise. On the other hand, low-mass stars at later stages Myr evolve through the post-AGB phase and maintain far-UV emission up to several Gyr.
We are interested in the full spectrum consisting of the cumulative intrinsic spectra of the stars and the SMBH, transmitted through the interstellar gas, and the nebular emission of the ISM ionized and heated by these sources. Our aim is to determine how the spectral features— in the continuum and in lines— in the IR/submm range are connected with the BH and stellar masses, as well as the ISM gas mass (with and without dust). Our hope is that such a connection will allow us to infer a possible correlation between them.
2.3 CLOUDY Setup
Ionization states of various elements and the ionic spectral lines are calculated with the CLOUDY code (Ferland et al. 2017). The gaseous layer is exposed to radiation from the central sources, i.e. a BH and stellar population. We assume spherical geometry, in which the inner radius of the layer is fixed at pc, and the outer radius is determined by the gas mass . The density and metallicity are distributed homogeneously; calculations are done for three gas metallicities: and 0, corresponding to the stellar population models presented in Figure 2, the fiducial density is cm-3. A decrease in the metallicity leads to a nearly proportional decrease of luminosities in metal lines. In runs with gas density different from the fiducial value, the gas mass is kept fixed. We assume that the mass of the layer is fixed, such that the outer radius of the layer varies as . We also assume that the gas is in thermal equilibrium.


3 Results
In low-metallicity cases (), we consider for illustrative purposes a wide range of BH masses . Even though their contribution in heating and ionizing galastic gas in the low BH mass end is not significant (see below in Figure 3), they may reveal anticipated interrelations between emission characteristics of galaxies with BHs at their initial growth episodes. However, when galaxies with higher metallicity are concerned, the effects of interstellar opacity come into play and complicate the calculations. Therefore, in models with high metallicity we limit our calculation to BH masses , because BHs with masses are able to ionize absorbing species (carbon, oxygen and nitrogen) in ambient interstellar gas and make it more transparent. Higher gas transmittance also prevents the BHs from producing dynamical (gravitational) feedback effects on the very inner gas and dust layers.
3.1 Dust-free gas
Let us first consider the combined effect of the stellar and BH radiation on emissivity of galactic gas with a sub-solar metallicity . We consider a set of models with a fixed mass of stellar population corresponding to bolometric luminosity , complemented by radiation from an accreting BH with masses from to ; the mass of a surrounding interstellar gas is assumed . The total radiation from stars and the BH irradiates the diffuse gas, resulting in its ionization, heating and consequently affecting its emissivity.
Figure 3 presents for a low metallicity gas the sum of the stellar and the BH incident flux (red lines), the continuum and line emission spectrum from photo-ionized diffuse interstellar gas (green lines), and the net transmitted spectrum (blue lines). It is seen that, regardless of the low metallicity , UV and soft X-ray photons produced by BH are absorbed in a partially neutral gaseous layer, with a fraction of the absorbed energy being converted to IR/sub-mm lines of hydrogen and low ionization states of metals, such as [NII] 121 m, [CII] 158 m, [NII] 205 m and others. However, the most important effect of these photons is an increase in heating and ionization in the gas layer. This manifests in an enhanced free-free nebular continuum.
It is readily seen that gas nebular emission is predominantly due to hard radiation from the BH. As the BH mass increases the nebular luminosity increases proportionally. When the ionization fraction approaches unity (Figure 4), this proportionality in continuum emission weakens, while line emission decreases. The corresponding decrease of the neutral fraction makes the outer gas layer more transparent, as can be seen from comparing the mid-left and mid-right panels on Figure 3 for BH mass to . For higher BH masses (two bottom panels), Hydrogen is completely ionized, and the incident SED remains practically unchanged after passing through the gas layer. Further increase of BH mass above results in decreasing the intensities of H, He and metal lines. Note that for the same BH mass limit, , the BH outshines the stellar radiation from the SSP with bolometric luminosity .
The luminosity of free-free nebular emission in the IR/submm range increases as until the BH masses exceeds a critical value , and afterwards it saturates and remains nearly constant at higher . Assuming that gas in the layer is ionized mostly by EUV and X-ray photons from the BH one can estimate its mass when free-free emission saturates as the BH mass crosses the limit, as follows,
| (1) |
where cm3 s-1, the case B hydrogen recombination rate (Draine 2011), keV is the mean energy of ionized photons, is the energy flux of X-ray photons, erg s-1 is the Eddington luminosity for a black hole, is gas density in the layer, is its mass. We assume cm2 for H + He plasma (Wilms et al. 2000).
For a gas mass of Eq. (1) gives . The fractional ionization , as seen in Figure 4 and further growth of does not increase the luminosity of nebular emission. Assuming for H + He plasma the cooling rate erg cm3 s-1 – the sum of free-free and free-bound emission (Draine 2011)– one can estimate the fraction of bolometric BH luminosity being radiated as nebular emission,
| (2) |
For , this fraction is for fiducial parameters, and it decreases with an increase in .

In the long-wavelength limit, the free-free nebular spectral luminosity . This scaling is shallower than that of the sum of stellar and BH spectra, . Therefore, at a certain wavelength , the nebular emission outshines the radiation from the original sources. At , the net transmitted spectrum changes from the slope shortward to longward. In Figure 3, we show the spectra in the form of , which changes from in the short-wavelength side to after the inflection point, located in the far-IR or the sub-mm wavelength range depending on masses of SPP, BH and the ambient gas layer. The presence of such an inflection point in spectrum of a distant source would indicate the prevalence of the nebular emission.
Magenta points in Figure 3 depict the intersection between the free-free continuum and stellar/BH thermal background. One can observe that for a given SSP luminosity an increase of BH mass leads to a shift of the intersection towards shorter wavelengths with simultaneous increase of the luminosity, until the SSP dominates in the optical and IR range – it is seen in the four upper panels of Figure 3, for BH masses from to . For more massive and brighter BHs the free-free continuum saturates and further increase of the BH mass shifts the inflection point to longer wavelengths with simultaneous decrease of luminosity.
For clarity, we collect all spectra in a schematic plot on Figure 5. The thick dark grey line depicts the SSP incident spectrum. A set of thick light grey lines presents the total transmitted spectra of SSP+BH source with increasing values of . The straight thin lines follow pure free-free continuum. Colour symbols depict the location of intersection points. One can note that there is a turning point for the BH mass value , when the free-free emission saturates. Another representation of such loop-like behaviour of the inflection wavelength on the mass of an illuminating BH is given in Figure 6.
The colours on lines in this figure correspond to the luminosity at the inflection point as coded in the colour bar. The BH mass is a two-valued function of and the luminosity . The dropping branch of reflects that SPP optical and IR emission outshines the BH emission. On the right hand side of the Figure, turns to grow when this relation reverses, approximately at .

3.1.1 Spectral lines
Nebular spectral emission is fed by both UV from stars and by X-ray and UV from the growing black hole. As mentioned above, the contribution from young stellar population (SSP) is restricted by a very narrow UV band Å from OB stars. As a result, in optical and near infrared range, the emission from stars dominates and nebular line emission remains weak. This is clearly seen in Figure 3: when the BH mass lies within all optical and even a fraction far IR nebular lines fall below the stellar emission. Only from onward, the nebular lines emerge over and above the stellar continuum due to a predominant contribution of the BH towards ionization. However, further increase of the BH mass results in a higher ionization and in a suppressed hydrogen recombination optical emission. Ultimately at nebular emission becomes saturated.

We illustrate this in Figure 7 where relative intensities of nebular emission lines , are shown against the black hole X-ray luminosity in the 0.1–3 keV energy band. Here is the line-centre intensity, is the net continuum intensity on both sides of the line. The upper row shows the dependences of relative line intensities when the gas layer is illuminated only by a BH with different masses. From left to right, optical hydrogen recombination lines H, H and B, mid- and far-IR high ionization ions lines: [MgVII] 5.5, 9 m, [NeVI] 7.6 m, and [NeV] 24 m, [NIII] 57 m, [OIII] 88 m respectively, in middle column panels, and far-IR lines of neutrals and low-ionization species: [SiII] 34 m, [OI] 63 m, [NII] 121 m, [OI] 145 m, [CII] 158 m in the right column panels, are presented. All lines with similar behaviour are joined by grey shade in order to clearly illustrate their similarity. It is readily seen that when the gas is illuminated only by a BH, the Hydrogen lines do not show an increase in intensity with increasing BH mass until (corresponding to erg s-1). Nearly the same dependence is shown by [NeV], [NIII], [OIII] in middle column panel. Intensities of ions with mid-IR lines [MgVII] and [NeVI] reveal a gradual growth with the BH mass () for . In contrast, far-IR lines of low ionization and neutral species: [SiII], [OI], [NII], [OI], [CII] (right panel) drop quickly, as , and practically disappear at .

The second row in Figure 7 demonstrates the changes in line intensities, when irradiated by a young (30 Myr) SSP with the luminosity (the equivalent mass is for a Salpeter IMF). Being strongly suppressed by stellar continuum in m range, the relative intensities of nebular optical lines drop by two orders of magnitude in the low end of the BH X-ray luminosity. The decrease factor remains nearly constant when the SSP luminosity grows: (third panel from top, left column), and (lowest panel, left column). This approximate constancy stems from the fact that while the BH with masses contributes less towards nebular luminosity in m than the stellar continuum, the nebular emission grows nearly proportionally with stellar luminosity. The intensities of optical lines grow with the BH mass, (nearly , with ), for for and , respectively.
Mid-IR lines (dark grey shades) in the middle column panels show a behaviour similar to the optical (H, H and B) lines, though with a noticeable steepening of growth with from SSP luminosity to , correspondingly. Far-IR lines of high ionization species (light-dark shades) in the middle columns show a rather weak dependence on BH mass to 1 within in the whole range of SSP luminosities, from upper to lower rows of panels. Given this ‘conservative’ trend, the ratios of intensities of hydrogen optical lines, mid-IR lines of the ions [MgVII] and [NeVI] as well as of far-IR lines of low ionization and neutral species to the lines of [NIII] and [OIII] can serve to measure the ratio of the BH mass (luminosity) to the young SSP luminosity within the range shown in Figure 7 ( for ).


The ratios of intensities between the lines from the three bands – optical, mid-IR and far-IR/submm to [NIII] 57m – versus the BH mass are presented in Figure 8, for several values of the SSP luminosities from to . The relative intensities of [B/NIII], [NeVI/NIII] and [CIV/NIII] vary in a wide range spanning more than two orders of magnitude, with [B/NIII] and [NeVI/NIII] growing from to when BH mass increases from to , depending on the SSP luminosity. At the same time, [CIV/NIII] drops from to in the same range. Note that the line ratios are not single-valued functions of the to ratio.
As seen from Figure 7, for all line intensities decrease steeply because of a growing contribution of the BH beyond the optical band. Another consequence is that BHs with masses in this range outshine stellar light even with , so that stellar population becomes difficult to identify. Only the submm continuum nebular emission becomes the sole carrier of information about the ionized gas, as shown in the right column of Figure 6.
The results discussed above and illustrated in Figures 7 and 8 weakly depend on gas mass, and therefore the intensity ratios [B/NIII], [NeVI/NIII] and [CIV/NIII] can serve as direct measures of masses of the stellar population and the BH feeding the nebular line emissions, unless the BH mass exceeds . The results however change with gas metallicity: the line intensities of heavy elements grow approximately linearly with metallicity () as shown in Figure 12 in Appendix A. The intensities of Hydrogen recombination lines slightly decrease with metallicity as because of a decrease in the recombination rates due to a metal enhanced radiative cooling (see left column in Figure 12). This results in a nearly proportional increase in the intensity ratio [B/NIII] with at given and , leaving the ratios [NeVI/NIII] and [CIV/NIII] unchanged.
3.2 Signatures of stellar and BH in thermal dust emission
As seen in Sec. 3.1.1, the presence of metals in the gas layer clearly manifests itself in a characteristic line spectrum, with line intensities proportional to the metallicity, which can be a useful tool as a diagnostic of the mutual evolution of growing black holes and stellar evolution in a host galaxy, unless dust overwhelms in optical/UV extinction and thermal IR emission.
However, the presence of dust particles in the interstellar gas complicates the picture. Assuming a Milky Way dust extinction law with cm2 per H atom (Draine 2011), the extinction depth of the gas layer is , where is a metallicity scaling factor, and is the gas mass in our fiducial model in the unit of . In the longer wavelength domain up to m, the extinction cross-section decreases as , for our estimates we assumed the approximation cm2 (Compiègne et al. 2011, see Fig. 5 in ). As a result, the gas layer becomes transparent, , in the near IR and beyond m.
Dust is heated by UV and X-ray radiation from stars and the BH. A considerable fraction of energy absorbed by ambient gas, as seen in Figures 9 and 10, transforms into ionization and heating of the gas and dust. This energy is then partly irradiated in nebular and dust emission. Contribution of the BH dominates gas and dust heating when its mass – it is shown by cyan lines in Figures 9 and 10 (which are similar to Figure 3 but for higher metallicity gas, with and ) . It is also seen that not only the absolute value of dust emission but even its fraction – the ratio of dust luminosity to the sum of luminosity of stars and BH absorbed in the gas layer— increases with the BH mass, as illustrated in the lower panel of Figure 4.
We also find that for , the optical depth of the gas volume with radius cm in X-ray and UV bands exceeds one. Therefore for a rough estimate of dust temperature, one can assume that the most of the heating radiation is absorbed by dust. We also assume the Planck-averaged absorption efficiency , (Dwek & Arendt 1992; Draine 2011), where is the grain size in cm, and also that the dust spectral index : . With these assumptions the dust temperature is given by
| (3) |
where is the dust radius in 0.1m, and are the stellar and black hole luminosities in , the gas mass in , (see Lower panel on Figure 4) is the fraction of energy from the sources – stars and BH, that is used in dust heating, is the mean solid angle of X-ray and UV photons impinging on the dust grain. In estimates, the absorption efficiencies of dust particles in visual (), EU and X-ray () bands are assumed to be (Draine 2011, see, Fig. 24.1 in ). This implies that the characteristic wavelength at the peak dust emission is
| (4) |
with . The estimate is roughly consistent with the peak position in Figure 9.
The in Eq. (3) is obviously a lower estimate of the dust temperature, whereas in reality, a large fraction of dust is at a higher temperature, predominantly contributing into the peak at m. This hot dust is associated with the internal layers with for UV and visual photons, and for X-ray photons with energy keV, where most of heating and ionizing radiation from the stars and the BH is absorbed. This situation is also reflected in a very weak dependence of on the gas mass on lower panel of Figure 4. Correspondingly, the peak wavelengths in (4) should be treated as a upper limit of the peak wavelength. This explains the fact that the dust emission in Figure 10 cannot be fit by an isothermal (single temperature) dust. In the left column lowermost panel of Figure 10, we show a modified Planck curve with the emissivity spectral index and temperature 70 K for by thick dashed brown line. A deficit of emission (of factor at m to nearly two orders at m in the lower panel) is clearly seen between the modified Planck spectrum and the modeled one, which reflects the negative radial gradient of the dust temperature.
With this stipulation, an upper limit of the dust luminosity can be estimated if one assumes that the fraction of the total (stellar and BH) luminosity heats the entire dust mass in the galaxy: with being the mass fraction of dust. Assuming the average input rate of heating radiation impinging a dust grain to be and the total number of dust particles in the galaxy , with , and , one arrives then at,
| (5) |
with g cm-3 being the dust grain density. For , , and one arrives at
| (6) |
The contribution from the BH in dust heating obviously prevails when its bolometric luminosity becomes larger than the stellar bolometric luminosity . For the model shown in Figure 9, it occurs when , assuming the critical (Eddington) accretion rate. Beyond this limit information about the stellar population cannot be retrieved from the net spectrum.
At lower masses of BHs , contributions from BH and stars can be distinguished by making use of the hard X-ray emission of the BH. One can estimate from Figures 3 and 9 that the luminosity in the hard X-ray (energies keV) varies approximately as ). The luminosity of dust emission grows as . Combining the observed fluxes of the hard X-ray and the dust peak emission one can infer separately and unless .
More specifically, the two equations connecting the X-ray and thermal dust observables are: erg s-1 and erg s-1 as follows from Eq. (6). Here the second term in the parenthesis is the Eddington luminosity normalized by , and is in unit. As a result,
| (7) |
and
| (8) |
Here the luminosities and are normalized by their fiducial values in . Note that Eq. (8) is valid for erg s-1, i.e. it is within the limits of the BH contribution in dust heating not exceeding the stellar one, or, equivalently, ).
3.2.1 Spectral lines in a dusty environment
Galaxies with higher stellar and gas metallicities [Z/H]=0 are supposed to be further evolved, and as a consequence, to be more massive, harbouring more massive black holes. In Figure 10 we show the spectra for galaxies with an age of Gyr, stellar luminosity , and metallicity [Z/H]=0. Panels from left uppermost to right lowermost show cumulative spectra with black holes of masses , respectively.
In a high-metallicity gas spectral lines are obviously more pronounced as compared to those in low-metallicity gas (see Figure 12). However, dust emission floods into the IR/submm range m, and the majority of lines become immersed into the dust emission (Figures 9 and 10). Therefore, in presence of dust, only a few of relatively strong spectral lines in optical and near-IR range are available for . For gas metallicity spectral lines are marginally distinguishable only for black hole masses , and can hardly serve to measure the interrelations between the masses of BH, gas and stellar population. Spectral lines in a gas with higher metallicity are stronger and a few of them remain distinguishable up to (Figure 10). These are: [FeII] 5.3m from regions of low ionization, and [NeVI] 7.6m, [MgVII] 5.5m, 9m in from high ionization regions. The ratios of their relative luminosities , and vary with and and might be utilised to measure them. However, their interrelation becomes degenerate in the higher limit of gas mass , and in addition does not form a regular sequence along the stellar luminosity.

4 Discussion
The main emphasis of the present paper is on finding a method of determining the masses of three important constituents of high redshift galaxies — central supermassive black hole, stars and gas — with the aid of spectral information in X-ray, optical, mid and far infrared wavelengths.
- •
Observations of very distant () galaxies hosting growing supermassive black holes provide only their spectra without spatial (angular) structure, and do not allow resolving stellar population and the black hole separately. Therefore, in such conditions, estimates of their masses can only be made from the spectra. Hovewer, even though spectral features of relatively young (with the age less than 200 Myr) stellar population are to a certain extent distinguishable from those of black holes, the presence of gas and dust of unknown masses may complicate the situation, thus making a separate determination of masses of stellar population and the hosted SMBH challenging.
- •
A possible way to overcome this difficulty may involve measurements of emissions that can separately characterize the contributions from the stellar population, the black hole, the gas nebular emission and the dust emission: i) high energy X-ray emission keV can come mostly from the central BH, ii) thermal dust emission is supported by heating from the BH and the stars, iii) far IR nebular continuum emission in m can give information about the gas mass. With such a multi-wavelength approach, the three observables would provide us with necessary information to infer the three unknowns. Presence of dust complicates such a robust approach and urges additional consideration.
- •
The role the gas component plays in shaping the cumulative spectrum of a host galaxy bearing a growing black hole is dual: one is that gas absorbs X-ray, UV and optical emission from the BH and stars, the other is that nebular emission contains spectral lines, dust continuum and free-free continuum in far IR and submm. One can therefore expect that increasing of the gas mass suppresses X-ray and UV/optical light from the sources, and simultaneously enhances nebular emissions. Such a trend is clearly seen in the left upper panel of Figure 10: the solid red line depicts the cumulative spectrum of stars and BH without absorption and emission from gas. As soon as these effects are turned on, they immediately decrease the amount of X-ray and UV photons – the higher the gas mass, the lower is the ionizing photon energy – and of UV/optical/NIR photons in the range from Å to m. The diagram on Figure 11 show such an inverse dependence of an increased of submm free-free m flux and a decrease of the ratio of X-ray fluxes at Å to Å along with an increasing gas mass.
- •
This trend can be observed particularly at the high end of BH masses in Figure 11. It is seen that with an increase in the gas mass, the 200 m flux enhances, with a simultaneous decline of the Å to Å fluxes. Such a concerted anti-correlation of 200 m and Å to Å fluxes with a growing gas mass can also be seen at smaller BH masses, though becoming flatter with smaller the BH masses. This is because of the fact that the ionizing radiation flux decreases as , where is the optical depth in X-ray/UV (for the assumed parameters ), while the 200 m flux grows as a shallow power-law scaling .
- •
In our consideration we explicitly used the black hole spectral energy distribution based on the model described by Kubota & Done 2018, with the X-ray luminosity ( keV) scaling as . Observationally the interrelation between the X-ray luminosity and the BH mass seems challenging to be robustly inferred, mostly because of contamination from heavy dust obscuration, or lack of direct measures of BH mass when X-ray emission is recognizable (Circosta et al. 2019; Connor et al. 2020; Vito et al. 2019; Lambrides et al. 2020; DÁmato et al. 2020, see discussion in ). However, our results are qualitatively correct for any positive power-law dependence , , which is obviously the case. Our arguments and resulting interrelations remain largely invariant in this case.
5 Conclusions
We have studied observational manifestations of the interrelation between the masses of stellar population, central massive black hole and the interstellar gas in the host galaxies through their multiwavelength spectral energy distributions from X-ray to submm wavelengths. We modelled cumulative spectra as a sum of emission from growing BHs, stellar populations and nebular emission from interstellar and circumgalactic mass with making use of CLOUDY (version 17). We argue that the three observables: the luminosities (fluxes) in X-ray, dust infrared and submm thermal emission, along with their ratios allow us to infer the masses (luminosities) of the stellar population, the central BH and the gaseous component.
Our results are summarized as follows:
- •
In dust-free models, emission of growing black holes dominates when . In this case nebular free-free continuum in the far infrared outshines the emission from central source, with a change of spectral shape from a quasi-blackbody spectrum to a flat free-free continuum. The frequency and the corresponding luminosity at which the spectral index changes, depend on the BH and stellar population masses, and also on the gas mass. Thus, the observed and provide two interrelations connecting the three masses: , and .
- •
Measuring the mass of stellar population is possible only for a relatively low mass of BH , otherwise stellar emission is totally out shined by the BH emission.
- •
Line ratios are not single-valued functions of the mass ratio , and thus cannot serve to measure this ratio.
- •
The thermal dust emission in its peak around 70 m and the hard X-ray emission at Å allow us to measure masses of the stellar population and the black hole.
- •
Interrelations between the fluxes (luminosities) of X-ray photons with keV and submillimeter emission at m allow to infer the gas mass in the galaxies, where the BH mass is and the stellar population luminosity .
- •
The dependences of the ratio ÅÅ vs m traces the interrelation between the dust and gas masses, though they remain essentially invariant for stellar luminosities . In case of higher , the correlations shift to higher submm luminosity emission at m.
6 Acknowledgements
This work is supported by the joint RFBR-DST project (RFBR 17-52-45063). EV is grateful to the Ministry for Education and Science of the Russian Federation (grant 3.858.2017/4.6). The work by YS is done under partial support from the project 01-2018 “New Scientific Groups LPI”.
References
- Abramowicz et al. (1988) Abramowicz, M. A., Czerny, B., Lasota, J. P., Szuszkiewicz, E., 1988, ApJ, 332, 646
- Agarwal et al. (2013) Agarwal, B., Davis, A. J., Khochfar, S., et al. 2013, MNRAS, 432, 3438
- Bell & de Jong (2001) Bell, E. F., de Jong, R. S., 2001, ApJ, 550, 212
- Bentz et al. (2013) Bentz, M. C., Donney, K. D., Grier, C. J., et al. 2013, ApJ, 767, 149
- Bentz & Manne-Nicholas (2018) Bentz, M. C., Manne-Nochilas, E., 2018, ApJ, 864, 146
- Bruzual & Charlot (2003) Bruzual, Charlot, 2003
- Circosta et al. (2019) Circosta, C., Vignali, C., Gilli, R., et al. 2019, A& A, 623, A172
- Compiègne et al. (2011) Compiègne, M., Verstraete, L., Jones, A., et al. , 2011, A& A, 525, A103
- Connor et al. (2020) Connor, T., Bañados, E., Stern, D., et al. 2020, ApJL, 884, L31
- DÁmato et al. (2020) DÁmato, Q., Gilli, R., Vignali, C., et al. 2020, arXiv:2003.08631
- Decarli et al. (2018) Decarli, R., Walter, F., Venemans, B. P., et al. 2018, ApJ, 857, 97
- Draine (2011) Draine, B. T., Interstellar and Intergalactic Medium
- Dwek & Arendt (1992) Dwek, E., Arendt, R. G., 1992, ARA& A, 30, 11
- Faber & Gallagher (1979) Faber, S. M., Gallagher, J. S., 1979, ARA& A, 17, 135
- Ferland et al. (2017) Ferland, G.J., Chatzikos, M., Guzmán, F. et al. 2017, Rev. Mex. de Astron. Astrofis., 53, 385
- Girardi et al. (2000) Girardi L., Bressan A., Bertelli G., Chiosi C., 2000, A&AS, 141, 371
- Graham & Scott (2013) Graham, A. W., Scott, N., 2013, ApJ, 764, 151
- Häring & Rix (2004) Häring, N., Rix, H. W., 2004, ApJL, 604, L89
- Heckman & Best (2014) Heckman, T. H., Best, P. N., 2014, ARA& A, 52, 589
- Into & Portinari (2013) Into, T., Portinari, L., 2013, MNRAS, 430, 2715
- Kauffmann et al. (2003) Kauffmann, G., et al. 2003, MNRAS, 341, 33
- Kormendy & Ho (2013) Kormendi, J., Ho, L. C., 2013, ARA& A, 51, 511
- Kubota & Done (2018) Kubota, A., & Done, C. 2018, MNRAS, 480, 1247
- Latif & Ferrara (2016) Latif, M. A., Ferrara, A., 2016, PASA, 33, 51
- Lambrides et al. (2020) Lambrides, E., Chiaberge, M., Heckman, T., et al. 2020 arXiv:2002.00955
- Lupi et al. (2016) Lupi, A., Haardt, R. Dotti, M., 2016, MNRAS, 456, 2993
- Madau et al. (2014) Madau, P., Haardt, F., Dotti, M., 2014, ApJ, 784, L38
- Marconi & Hunt (2003) Marconi, A., Hunt, L. K., 2003, ApJL, 589, L21
- Natarajian (2014) Natarajan, P., 2014, GReGr, 46, 1702
- Natarajan et al. (2017) Natarajan, P., Pacucci, F., Ferrara, A., et al. 2017, ApJ, 838, 117
- Novikov & Thorne (1973) Novikov, I. D., Thorne, K., 1973, in: Black Holes, eds. C. de Witt & B. S. de Witt, Gordon & Breach, p. 345
- Pacucci et al. (2016) Pacucci, F., Ferrara, A., Grazian, A., et al. 2016, MNRAS, 459, 1432
- Pacucci et al. (2015) Pacucci, F., Volonteri, M., Ferrara, A., 2015, MNRAS, 452, 1922
- Pezzulli et al. (2016) Pezzulli, E., Valiante, R., Schneider, R., 2016, MNRAS, 458, 3047
- Reines & Volonteri (2015) Reines, A. E., Volonteri, M., 2015, ApJ, 813, 72
- Salim et al. (2005) Salim, S., Charlot, S., Reach, A. M., et al. 2005, ApJ, 619, L39
- Sadowski et al. (2009) Sadowski, A., 2009, ApJSS, 183, 171
- Sani et al. (2011) Sani, E., Marconi, A., Hunt, L. K., Risaliti, G., 2011, MNRAS, 413, 1479
- Tanaka & Haiman (2009) Tanaka, T., Haiman, Z., 2009, ApJ, 696, 1798
- Valiante et al. (2016) Valiante, R., Schneider, R., Volonteri, M., Omukai, K., 2016, MNRAS, 462, 3146
- Valiante et al. (2018) Valiante, R., Schneider, R., Zappacosta, L., et al. 2018, MNRAS, 476, 407
- Vito et al. (2019) Vito, F., Brandt, W. N., Bauer, F. E., et al. 2019, A& A, 2628, L6
- Volonteri (2012) Volonteri, M., 2012, Sci.? 337, 544
- Volonteri et al. (2015) Volonteri, M., Silk, J., Dubus, G., 2015, ApJ, 804, 148
- Volonteri & Reines (2016) Volonteri, M., Reines, A. E., 2016, ApJ, 820, L6
- Volonteri et al. (2016) Volonteri, M., Dubois, Y., Pichon, C, Devriendt, J., 2016, MNRAS, 460, 2979
- Volonteri et al. (2017) Volonteri, M., Reines, A. E., Atek, H., et al. , 2017, ApJ, 849, 155
- Wilms et al. (2000) Wilms, J., Allen, A. McCray, R., 2000, ApJ, 542, 914
- Woo et al. (2013) Woo, J.-H., Schulze, A., Park, D. et al. 2013, ApJ, 772, 49
Appendix A Intensities versus metallisity
Increase of gas metallicity, under other conditions being equal, enhances radiative cooling and shifts thermal equlibrium to a slightly lower temperature. As a results recombination rates increase and result in a decrease of fractional ionization. This results in turn in a weakening of hydrogen recombination lines . It is demonstrated in left panels on Figure 12. On the contrary, middle and right panels show that optical, infrared and submm lines of the ions of heavy metals rise nearly proportional with . Note that here we use the SED for a young (30 Myr) stellar population for all gas metallicity values.

Appendix B Intensities versus gas mass
When the stellar population dominates – for the Eddington luminosity it is when , it overwhelms the nebular emission and the metals spectral lines are uneloquent, as can be seen in Figure 10, and hardly can be used to infer the gas mass. Situation changes for with a well shaped nebular spectrum showing explicit dependence on gas mass. The most interesting feature is an approximately inversely proportional decrease of X-ray emission due to strong absorption seen at Å , and an approximately proportional increase of emission in submm waveband at m with growing gas mass, Figure 13.
