1]Department of Physics, Graduate School of Science, Kobe University, Kobe, Hyogo 657-8501, Japan 2]Research Center for Neutrino Science, Tohoku University, Sendai, Miyagi 980-8578, Japan 3]Kavli Institute for the Physics and Mathematics of the Universe (WPI), The University of Tokyo Institutes for Advanced Study, University of Tokyo, Kashiwa, Chiba 277-8583, Japan 4]Kamioka Observatory, Institute for Cosmic Ray Research, The University of Tokyo, Gifu 506-1205, Japan
Evaluation of radon adsorption efficiency values in xenon with activated carbon fibers
Abstract
The radioactive noble gas radon-222 (, or Rn) produced in the uranium series is a crucial background source in many underground experiments. We have estimated the adsorption property of Rn with Activated Carbon Fibers (ACFs) in air (Air), argon (Ar), and xenon (Xe) gas. In this study, we evaluated six ACFs, named A-7, A-10, A-15, A-20, A-25, and S-25, provided from UNITIKA Ltd. We measured intrinsic radioactivity of these ACF samples, and found A-20’s radioactivity of the uranium series is with confidence level. In Air and Ar gas, we found ACF A-15 has the adsorption efficiency of reduction at maximum before saturation of Rn adsorption, and more than adsorption efficiency after the saturation. In Xe gas, we found ACF A-20 has the best Rn adsorption ability among tested ACFs. We also found S-25, A-25, and A-15 have similar Rn adsorption performance.
PTEP-subject
H20, C431 Introduction
1.1 Xenon for underground experiment and radon background
Xenon (Xe) is one of the attractive materials in the field of a particle physics experiment. Since Xe has no long-lived radioactive isotopes of its own, Xe is intrinsically radio-pure, except for the double beta decay (136Xe) and double electron capture (124Xe) nuclide [1, 2]. Because of its nuclear properties (such as spin, atomic mass number) as well as its ease of scalability, Xe is widely used as a target of direct dark matter searches [3, 4, 5, 6] and a source of double beta decay searches [7, 8, 9, 10] in underground experiments. Recently, other decay processes of Xe atom, such as neutrino-less double electron capture () or neutrino-less quadruple beta decay (), are proposed to theoretically explain lepton number violation [11, 12, 13].
In these rare event search experiments, radioactive impurities in liquid or gas Xe are severe background sources. In particular, the noble gas radon-222 (, or Rn) is continuously produced from the decay of radium-226 () in the detector material. Because of its long decay time (about days), the produced Rn enters into the sensitive volume of the detector and results in generating mimic signals below the multi-MeV region. Therefore, the removal of Rn in Xe is an essential technique to improve the sensitivity of such experiments [14, 15].
There are two strategies to reduce Rn in the detector: one is a careful material screening before detector construction and the other is Rn removal during the observation phase with the detector. Before constructing the detector, radio impurity of materials should be measured with a screening device such as a high-purity germanium detector, an inductively coupled plasma mass spectrometry (ICP-MS), or any other special screening systems [16, 17, 18, 19, 20, 21, 22].
Once the detector is constructed, the Rn emanation from any type of material is basically fixed. Therefore, emanating Rn should be removed through the purification process. Several studies for the Rn removal in Xe gas have been conducted, for example, the development of the distillation column and the single-column adsorption using an activated charcoal [23, 24, 25]. Both Rn removal techniques have merits and demerits. In the case of adsorption, a separation between Xe and Rn by using an adsorbent is challenging because both elements are noble gases and have similar molecule sizes. Therefore, it is important to use appropriate adsorbent for the selective adsorption of Rn in Xe.
1.2 Activated carbon fiber
An activated charcoal is an effective adsorbent for various impurities by physical process based on the van-del-Waals forces and polarizability of the atoms [26]. For example, an activated charcoal has an excellent ability to remove Rn from argon (Ar) [27]. However, when the molecule sizes of the inert gas and Rn are similar, such as Xe, both Rn and Xe are tended to be adsorbed by an adsorbent. Therefore, the average pore size of the adsorbent should be selected carefully. Another valuable property is an effective surface area of the adsorbent. Larger surface areas allow increasing the adsorption efficiency. Furthermore, since Rn emanation from the adsorbent itself ultimately limits the Rn removal ability, it is required to reduce the amount of internal radioactive impurities in the adsorbent.
Activated carbon fiber (ACF) has been commercially available since the 1990s [28]. ACF is a major adsorbent because it has a large surface area and good adsorption property. The general adsorption properties of ACF have been reported in various papers [29, 30, 31, 32]. However, its application to adsorb Rn in Xe gas has not been reported yet.
For this study, several kinds of ACFs are specially provided from UNITIKA Ltd11 1 https://www.unitika.co.jp/e/index.html. Figure 1 shows a picture of a typical ACF provided from UNITIKA Ltd.

The provided ACFs are named A-7, A-10, A-15, A-20, A-25 and S-25. Among them, A-25 and S-25 are test products, and others are commercial products. For the selective Rn adsorption, the pore parameters are essential. Such basic properties of these ACFs are summarized in Table 1.
| A-7 | A-10 | A-15 | A-20 | A-25 | S-25 | |
|---|---|---|---|---|---|---|
| Specific surface area [m2/g] | ||||||
| Average pore diameter [nm] | ||||||
| Pore volume [cm3/g] | ||||||
| Meso pore volume ratio [%] |
The purpose of this report is to provide basic performances on Rn adsorption of these ACFs in Xe in various conditions. This report consists five sections, including this introduction. In Section 2, we describe the radioactive impurities of those ACFs and compare their radioactivity with other activated charcoals reported in the earlier studies. In Section 3, we describe the measurement system designed to evaluate the Rn adsorption efficiency of the ACFs. Then, we present the performance of this system using purified air (Air), Ar gas, and Xe gas. In Section 4, we present the characteristic dependence of Rn adsorption in Xe, and show the comparisons of the adsorption efficiency among those ACFs. In the last section, we summarize this study.
2 Radioactive impurity measurements
As explained in Section 1, the radon emanation from an adsorbent limits the Rn adsorption ability. Therefore low-intrinsic radioactivity of (or uranium series) is required for an adsorbent. We measured the intrinsic radioactive contamination of the provided ACFs with high-purity germanium detectors (HPGe) in Kamioka Observatory, the Institute for Cosmic Ray Research (ICRR), the University of Tokyo and in Kavli Institute for the Physics and Mathematics of the Universe (IPMU), the University of Tokyo. For this evaluation, we measured four ACFs, which are A-10, A-15, A-20, and A-25. We put those ACFs into an EVOH (Ethylene-vinylalcohol copolymer) plastic bag in order to keep emanated Rn from the samples, then the measurements are carried out for about days after reaching radiation equilibrium. This HPGe assay method is reported in Ref. [33].
The results of the measurements are summarized in Table 2 as well as the other measurements of activated charcoals by the XMASS collaboration [25] and the XENON collaboration [34].
| Method | Weight | Duration | Uranium | Thorium | ||
| series | series | |||||
| [g] | [day] | [] | [] | [] | ||
| A-10 | HPGe | |||||
| A-15 | HPGe | |||||
| A-20 | HPGe | |||||
| A-25 | HPGe | |||||
| Shirasagi G2X [25] | HPGe | – | – | |||
| Shirasagi G2X [34] | PC | – | – | – | – | |
| Blecher 100050 [34] | PC | – | – | – | – |
For these ACFs, we could not observe any significant gamma-ray line over the background spectrum in the measurements in Table 222 2 However, we observed of (half life is years) only in the A-20 sample. We think it would be a contamination in the preparation process of this A-20 sample, and this contamination will not affect assays.. Therefore, we have estimated the upper limits. The obtained upper limit of A-20 is for the uranium series. Comparing the radioactivity of the uranium series with other reports [25, 34], A-20 has a lower radioactivity than Shirasagi G2X . However, we could not judge whether A-20 has a lower (or higher) radioactivity than Blecher 100050 33 3 There is a difference of the estimation. PC measures emanated radon from the sample only, but HPGe measures radioisotopes inside the sample also. .
3 Experimental setup
3.1 Test measurements with purified air and argon
As a first step, we evaluated the Rn adsorption performance of ACF in purified Air and in purified Ar. We used G1 grade purified gases (impurities are less than ppm) provided from TAIYO NIPPON SANSO CORPORATION [35]. Since the molecular sizes of nitrogen (N2), oxygen (O2) and Ar are relatively small compared with that of Rn, the adsorption of the Rn in purified Air or Ar is expected to be efficient. To date, adsorption techniques of Rn in Air or N2 with activated charcoals have been established among underground experiments [36, 37, 38, 39, 40].
In order to perform the test measurements with Air or Ar, we have constructed a test bench at Kobe University, Japan. The test bench is based on the measurement system developed in Ref. [27]. The test bench for this study consists of a high-sensitivity 80-L Rn detector [41, 36], a gas mass flow controller (HORIBA STEC, SEC-Z512MGX, hereafter MFC), a gas circulation pump (ENOMOTO Micro Pump Mfg. Co. Ltd., MX-808ST-S), a dew point gauge (VAISALA, DMT152), a pressure gauge (Swagelok, PGU-50-MC01-L-4FSF), filters (NIPPON SEISEN Co. Ltd., NASclean GF-T001 and GF-D03N), a refrigerator with a cold trap, and a Rn source (PYLON, RNC). The radioactivity of this source is Bq (). This refrigerator is equipped with a box-shaped cold trap [27]. A schematic view of this test bench corresponds to the system shown in Figure 3 in Section 3.2 without the main trap in that figure.
The principal techniques of the 80-L Rn detector are the electrostatic collection of the positively charged daughter nuclei of [42, 43] and the deposit energy measurement of their decays on a PIN photodiode [44, 45, 46, 47, 41, 36]. The 80-L Rn detector can measure a few level of Rn concentration in the circulation gas. The details of the 80-L Rn detector can be found in Ref. [41, 36].
Here are typical operations before the test measurements with this test bench. For the measurements in this section, we put g of ACF A-15 into the box-shaped trap. After preparation of the ACF sample in a box-shaped trap, we baked the trap at under vacuum with a turbo molecular pump. After the vacuum pressure became less than Pa, we stopped the baking, then started cooling down of the box-shaped trap to . In parallel, the test bench was filled with purified Air or Ar. When we changed the gas in the system, the entire system was evacuated before filling, except for the Rn source. The Rn source was purged with the new gas in advance. The typical pressure of the gas in the system is at atmospheric pressure (around MPa in absolute pressure, or MPa in gauge pressure). It is noted in this report that we use gauge pressure values to express the inner gas pressure of the test bench if it is not specified. The gas was circulated with the circulation pump after filling.
There are three steps after the preparation of the cold trap and the circulation gas. The first phase is the injection of Rn into the circulation gas from the Rn source. The second phase is the adsorption of Rn with the cooled box-shaped trap. The third phase is the release of Rn from the trap by heating the trap to the normal temperature (between and ). During these phases, the flow rate of the circulation gas was kept at the same flow rate with the MFC in the system. The 80-L Rn detector was also continuously monitoring the Rn concentration in the circulation gas, during these phases. The observed number of polonium-214 () events from the 80-L Rn detector was summarized every 10 minutes, then the observed count rate is converted into the Rn concentration with the calibration factor in Ref. [41, 36]. Therefore, we obtained Rn concentration in the circulation gas every 10 minutes.
Figure 2 shows the results of these test measurements.


For the test measurement with Air, we injected Rn at 15:51 on December 7th, 2016. The gas circulation rate was SLM (liter per minute at standard temperature and pressure) and then we started the adsorption phase from 10:52 on December 8th. The Rn concentration dropped soon after starting the adsorption phase and it took about hours to reach the lowest value. At the moment, the Rn adsorption efficiency reached a maximum of nearly with the reduction factor of .
In general, further adsorption is not expected when all pore sites are filled with gas molecules. Under such situation, adsorbed Rn is eventually released from ACF by collision with other molecules in circulation gas. Consequently, some of Rn returns into the circulation gas again because of such saturation. This situation is called break-through. The Rn concentration in the system ultimately reaches the equilibrium state between the adsorption and the release.
In the measurements with Air or Ar, the Rn concentration gradually increased to about level after reaching the lowest value, and this can be explained as the reason above. During this phase, the Rn adsorption efficiency finally becomes . After starting the release phase at 14:39 on December 11th, the Rn concentration immediately increased and then reached to the originally expected level.
For the test measurement with Ar, we have evaluated the Rn adsorption efficiency with the same procedure with the gas circulation rate at SLM. The result is shown in Figure 2 (right). Its Rn adsorption efficiency is determined to be as summarized in Table 3.
| Gas | Flow rate [SLM] | Rn adsorption efficiency [] |
|---|---|---|
| Air | 0.90 | (stat.) |
| Argon | 1.3 | (stat.) |
Though the adsorption efficiency of Air and Ar measurements are similar, the break-through time of Ar looks shorter than that of Air. This would be due to the difference of the gas flow rates of these tests. From these test measurements, we demonstrated that this system can precisely measure the Rn adsorption efficiency of ACF in both Air and Ar. In addition to this, we found that ACF A-15 showed a good Rn adsorption efficiency.
3.2 Measurement system for Xe gas
For the measurements using Xe gas, we added a new refrigerator with a larger cold trap to increase the amount of the ACF sample. A schematic diagram of the full system is shown in Figure 3.
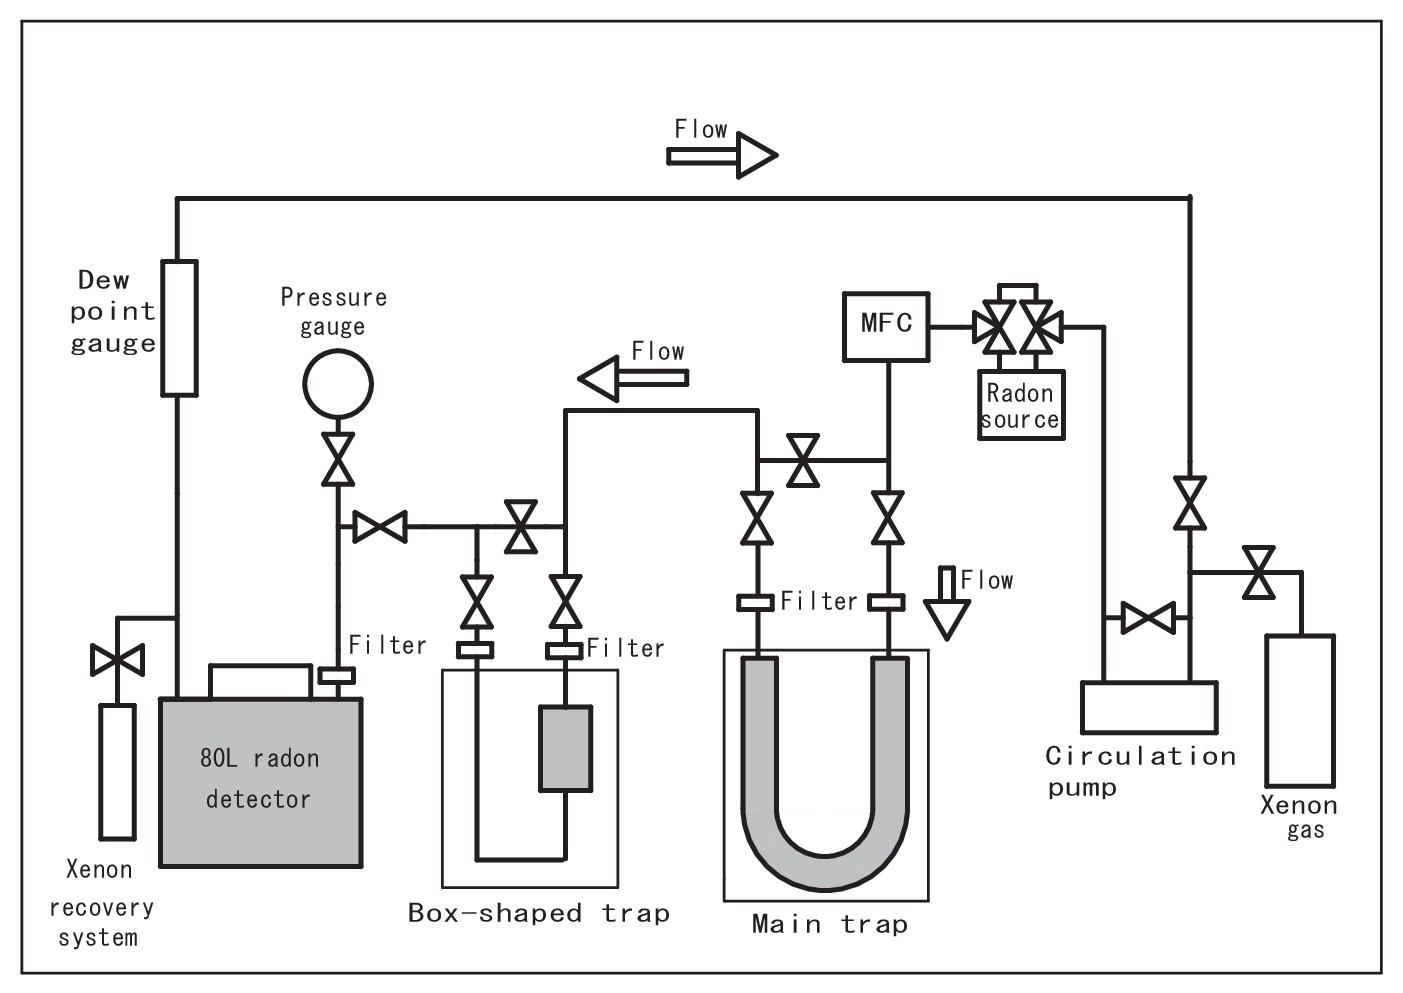
The gas in the system was circulated by the circulation pump. The Rn concentration in the circulation gas was measured with the 80-L Rn detector. The pressure, temperature, and dew point were monitored continuously during the measurement.
In this system, two cold traps (main trap and box-shaped trap) were used. The main trap is a U-shaped electro-polished stainless steel pipe, and can typically hold – g of an ACF sample. The main trap is used to hold the ACF sample to estimate Rn adsorption efficiency, and its volume is 122 cm3. The temperature of the ACF sample was controlled by the refrigerator for the main trap. Photographs of the main trap are shown in Figure 4.

The box-shaped trap is used to control humidity in the circulation gas for the measurements with Xe. In the actual measurement with Xe gas, the box-shaped trap was always kept at to keep low humidity conditions. We tested this box-shaped trap in Xe gas, then confirmed the effect from the box-shaped trap was negligible in Xe gas.
In order to prevent possible contamination of carbon fibers from the ACF sample into the measurement system, thin-layer metal membrane filters (m and m) are installed at the inlet and outlet of the cold traps.
3.3 Measurement method
Here is a typical measurement method with the main trap. Before the measurements, we put an ACF sample into the main trap. Then we evacuated the main trap with baking at . After the vacuum pressure became less than Pa in absolute pressure, we stopped the baking, and then put the main trap into the cooling system. Finally, the measurement system was filled with Xe gas. The typical circulation gas pressure was at atmospheric pressure, but it was reduced down to MPa in the case of the pressure dependence measurement described in Section 4.3. The Xe gas was circulated with the pump after filling at – SLM.
The three steps (injection, adsorption, and release phases) are same as the test measurement described in Section 3.1, but the temperature condition was changed for the main trap. All the temperature setting of the main refrigerator during the adsorption phase are . The typical temperature setting during the release phase is normal temperature. In some measurements, the temperature at the beginning of the release phase was set at to increase release speed. In each step, the measurement continues until the count rate of the Rn detector becomes stable. The adsorption phase was started by switching the inlet and outlet valves of the main trap from by-pass mode to through-trap mode. Using the 80-L Rn detector, the Rn concentration in the circulation gas was continuously monitored.
3.4 Data analysis
In order to measure the Rn adsorption efficiency in the circulation gas, we have performed the following analysis procedure. At first, the Rn concentration in the circulation gas is determined by the fitting with the Rn decay curve, defined as [], where is the decay constant of 222Rn, is elapsed time, and are parameters to be fitted. Applying this equation to the data before the adsorption phase, the expected Rn concentration without Rn adsorption () at is obtained as . When this equation is applied to the data during the adsorption phase, the remaining Rn concentration after Rn adsorption by the cold trap () at is obtained, as well. The expected fitted line is compared with the data after the release phase, in order to check the consistency of the value.
Then, we compare the remaining Rn concentration with the expected Rn concentration as follows;
| (1) |
In this report, we use the [] as the Rn adsorption efficiency.
3.5 A typical measurement in Xe gas and systematic uncertainty
Figure 5 shows an example of the measurements with Xe gas.


In these measurements, ACF A-25 was used in Xe circulation gas at MPa, and we observed a clear drop of the Rn concentration during the adsorption phase. The Rn concentration drops in SLM and SLM flow rate measurements are very similar at around . An apparent oscillation of the Rn concentration in the adsorption phase is observed in the SLM flow rate measurement. This behavior is similar to Ref. [25].
We also observed a pressure difference between the adsorption phase and other phases. The pressure drop during the adsorption phase was due to the adsorption of both Xe and Rn by the ACF. This pressure difference suggests an actual Rn adsorption efficiency might be lower than observed defined in Section 3.4. Therefore we have evaluated the amount of the pressure difference as a systematic uncertainty on the Rn adsorption efficiency.
In the case of the SLM measurement, the pressure difference was MPa and the absolute pressure before the adsorption phase was MPa. Based on this difference, we assigned the systematic error of on the absorption efficiency. Typical gauge pressure values of the circulation gas were MPa in the adsorption phase and MPa in other phases, except for the pressure dependence measurement. This pressure difference corresponds to systematic uncertainty, typically.
The accuracy of the pressure of the circulation gas has around MPa uncertainty, since the pressure gauge is an analog type. Because of this accuracy, we assigned a few level of uncertainty on the Rn adsorption efficiency. This systematic uncertainty ranges from to depending on the pressure inside the system ( for the lowest case of MPa and for atmospheric pressure). This uncertainty will reduce or enhance the uncertainty on the Rn adsorption efficiency from the pressure drop. We estimated maximum enhancement as a systematic error source.
In the very similar condition measurements, the observed Rn adsorption efficiency was slightly different within about a few . Therefore, we assigned systematic uncertainty from reproducibility as .
The assigned systematic uncertainties in this study are summarized in Table 4.
| Source | Uncertainty |
|---|---|
| Pressure drop in the adsorption phase | (typical) |
| Accuracy of pressure | Between (at MPa) and (at 0.00 MPa) |
| Reproducibility |
The observed Rn adsorption efficiency values in Xe of the SLM and SLM flow rate measurements were (stat.)(syst.)%, and (stat.)(syst.)%, respectively. The uncertainty from the pressure drop in the adsorption phase is estimated with actual pressure drop in each measurement.
In preceding studies [25, 34], the velocity ratio (or retention time ratio) of Rn to Xe in the adsorbent is estimated as a Rn trap performance of the test system. We also estimate the velocity ratio from the measurement in Fig. 5 right. In this measurement, we have observed retention time of Rn ( in Ref. [25]) in the main trap as hours, using the 218Po data, then the velocity ratio becomes (at ). The corresponding ratios in the preceding studies are (at ) [25] and (at ) [34]. This means velocity of Rn in the adsorbent column in our test bench (= main trap) is faster than others. The main reason of this difference would be due to the difference of the density of the adsorbent in the column. From the information in Ref. [25], the adsorbent density in the column is estimated as about 358 kg/m3. On the other hand, that from our system is 98 kg/m3, since we could not pack fibers into the U-shaped column very efficiently.
Then, using this velocity ratio, we also estimate the two component Henry’s constant of the adsorbent which is introduced in Ref. [34]. In the report, they obtained mol/(Pa kg) (at , MPa Xe). From our measurement, we obtained mol/(Pa kg) (at , MPa Xe). Though the conditions of the measurement are different, our adsorbent shows comparable adsorption performance with the preceding work.
4 Result
In this section, we describe the measurement results of the Rn adsorption efficiency in Xe gas. As a first step, we evaluated a possible flow rate dependence of the Rn adsorption efficiency using ACF A-25. Then, its Rn concentration dependence and circulation gas pressure dependence was evaluated with A-25. After presenting the results from these dependence measurement, we discuss the Rn adsorption efficiency among the six ACFs provided by the company.
4.1 Flow rate dependence
At first, we evaluated the flow rate dependence of the Rn adsorption efficiency using g of A-25. The experimental procedure is the same as the typical measurement explained in Section 3.3, but we changed the circulation gas flow rate using MFC. We also kept the Rn source connected during this measurement in order to maintain the same Rn concentration level. Therefore, the difference should be only the flow rate of the circulation gas. Typical Rn concentration and circulation gas pressure are and atmospheric pressure, respectively.
The obtained results are summarized in Table 5.
| Flow rate [SLM] | Rn adsorption efficiency [] |
|---|---|
| (stat.)(syst.) | |
| (stat.)(syst.) |
Here, the systematic errors are obtained from Table 4. However, for the relative comparison in this estimation, the relevant systematic uncertainty would be only reproducibility (), since the pressure drops are very similar in these measurements.
Among these different flow rate measurements, no significant difference was observed. Therefore, we found no significant flow rate dependence of measured Rn adsorption efficiency in the test bench in between and SLM flow rate.
4.2 Rn concentration dependence
As explained in Section 3.1, further adsorption is not expected when all pore sites are filled with gas molecules. Therefore, the Rn adsorption efficiency may depend on the Rn concentration of the circulation gas. In order to evaluate this dependence, we measured the Rn adsorption efficiency under the different Rn concentrations in the circulation gas. In these measurements, g of A-25 was used. Typical flow rate and circulation gas pressure are 1.4 SLM and atmospheric pressure, respectively.
Figure 6 shows the measurement results.
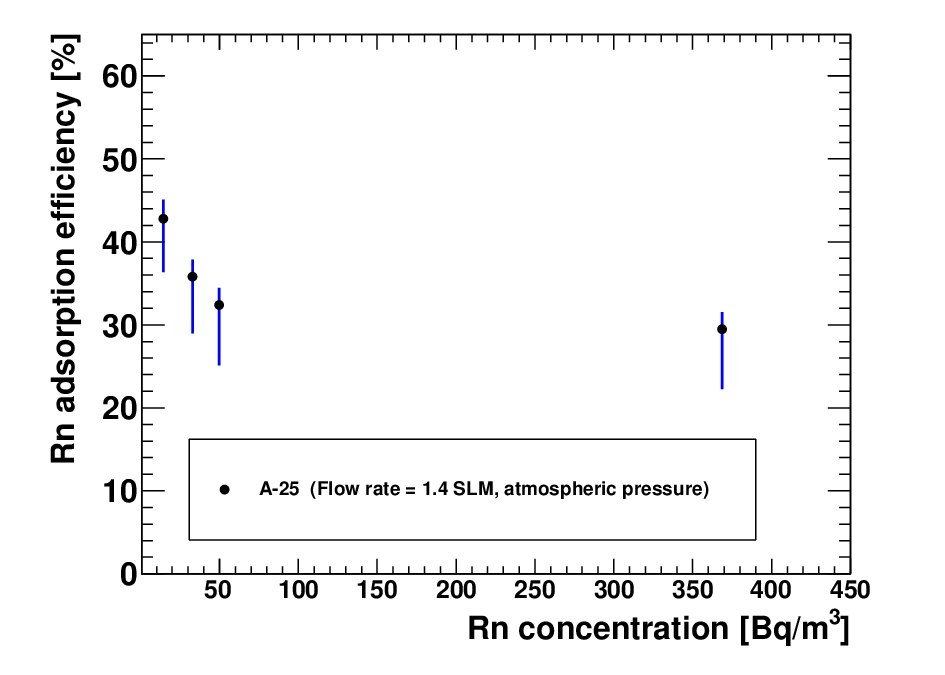
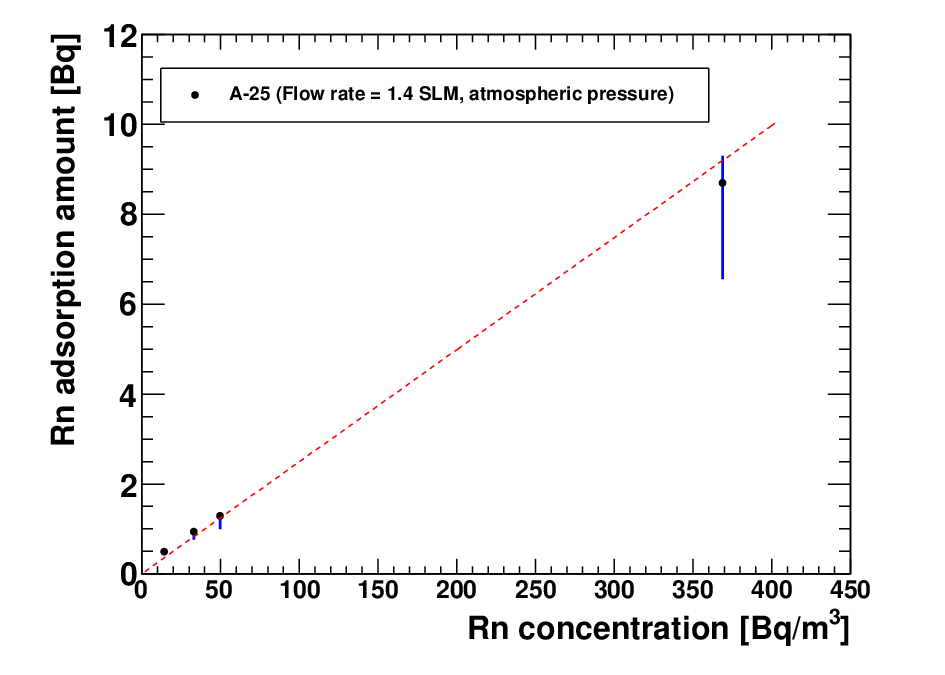
From Fig. 6 right, the absorbed Rn amount looks generally proportional to the Rn concentration. Since the Rn concentration corresponds to the partial pressure of Rn gas, this measurement may indicate Henry’s law in Rn adsorption [34].
However, from Fig. 6 left, the Rn adsorption efficiency looks increasing in the region below . This dependence suggests that a high Rn absorption efficiency is expected in the real experiments which search for rare physics events because the Rn concentration level in such experiments is much less than this Rn concentration level. In the region of –, the Rn concentration dependence of the Rn adsorption efficiency is about , and this is similar as or slightly smaller than the systematic uncertainty of the Rn adsorption efficiency estimated in Section 3.5.
4.3 Pressure dependence
In general, an adsorption on porous depends on both the temperature and the amount of the adsorbed gas molecules. Therefore, the adsorption may depend on the circulation gas pressure inside the system. In order to evaluate the dependence on the circulation gas pressure, we measured the Rn adsorption efficiency of A-25 under the different circulation gas pressure. For this measurement, we decreased the circulation gas pressure down to MPa, at first. Then, we added Xe gas (with some amount of Rn) into the system to increase the inner gas pressure. Figure 7 shows the result of these measurements.

In this estimation, only the data points in which Rn concentration is more than was selected to reduce the Rn concentration dependence of the Rn adsorption efficiency.
We found an apparent increase in the Rn adsorption efficiency when the circulation gas pressure is low.
4.4 Comparison among ACF types
We have compared the Rn adsorption efficiency among different ACF types. In this comparison, the measurement data were selected as follows. The circulation gas pressure is atmospheric pressure for all the data to eliminate pressure dependence of the Rn adsorption efficiency. The flow rate is between SLM and SLM, in which no dependence on the Rn adsorption efficiency was observed. In this comparison, we normalized the Rn adsorption efficiency values by weight, to the typical weight of ACF sample in the main trap ( g), since the amount of the ACF samples are different. We could not adjust the Rn concentration level in each measurement, though we observed the Rn concentration dependence in the region below . Therefore, this comparison was done as a function of the Rn concentration.
Figure 8 shows a summary of this comparison.
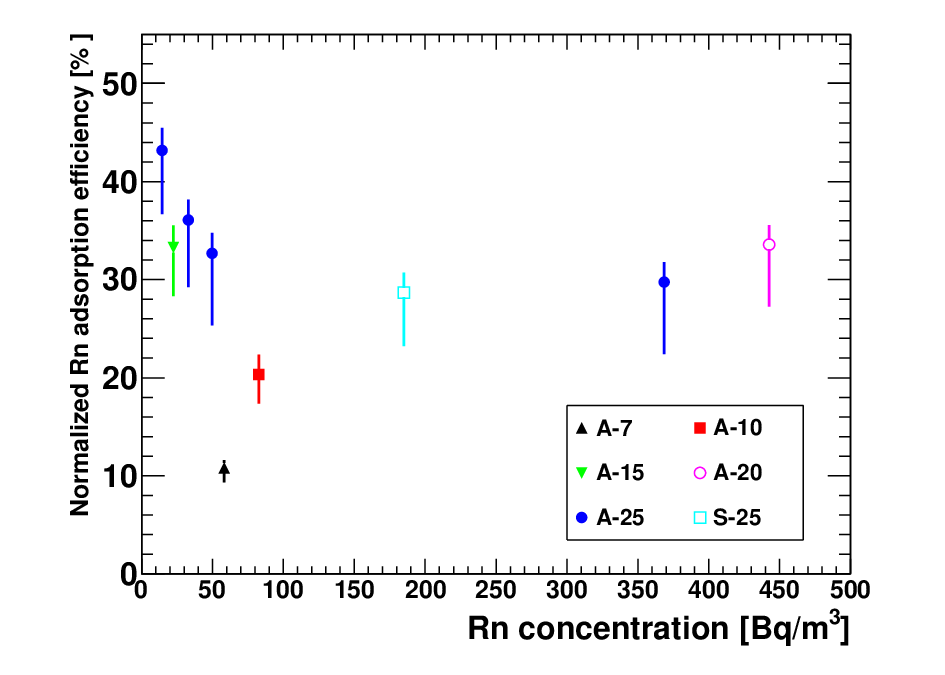
In Figure 8, several A-25 measurements are shown as a reference in different Rn concentration regions. Table 6 summarizes numerical information for typical data points shown in Figure 8.
| Type | Amount | Rn | P. drop | Normalized efficiency | |
|---|---|---|---|---|---|
| [g] | [Bq/m3] | [MPa] | [%] | [% ] | |
| A-7 | 29.97 | (stat.+syst.) | |||
| A-10 | 12.22 | (stat.+syst.) | |||
| A-15 | 11.11 | (stat.+syst.) | |||
| A-20 | 12.01 | (stat.+syst.) | |||
| A-25 | 11.90 | (stat.+syst.) | |||
| A-25 | 11.90 | (stat.+syst.) | |||
| S-25 | 11.88 | (stat.+syst.) |
In Figure 9, the same measuremts are shown using normalized Rn adsorption amount.
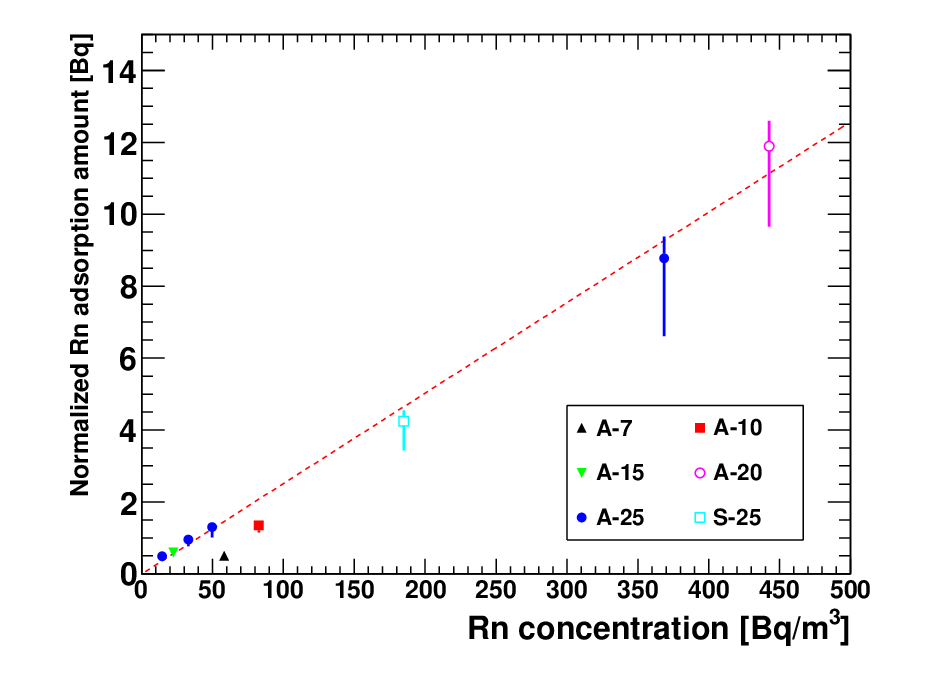
In these comparison plots, the dominant uncertainty is the pressure drop effect in the lower error bars. Since it comes from the interpretation of the pressure drop phenomenon, the uncertainties are taken into account among all data points. Therefore the relative uncertainties among data points would be about twice larger than the upper error bars.
Then, comparing each ACF type to A-25 in a similar Rn concentration area, the normalized Rn adsorption efficiency (and amount) values of A-7, and A-10 are lower than that of A-25. On the other hand, A-15, A-20, and S-25 show similar efficiency (and amount) values as that of A-25. Among these measurements, A-20 shows a slightly higher efficiency (and amount) value than A-25, though they are consistent within uncertainty. The observed efficiency value of A-20 was ) % (12 g of A-20, in atmospheric pressure Xe and Bq/m3 Rn).
Among A-7, A-10, A-15, and A-20, the adsorption performance looks increasing in this order. From Table 1, specific surface area, pore volume, and meso pore volume ratio are also increasing in the same order. Since kinetic diameters (Lennard-Jones parameter ) of Air, Ar, Xe, and Rn gas molecules are estimated as – nm, – nm, – nm, and – nm, respectively [48, 49, 50], and typical range of van-der-Waals interaction is about nm, the relevant pore size on the adsorption would be around – nm. Therefore, the meso pores (– nm) would not affect directly on the adsorption process while the increase of specific surface area and pore volume would be effective in this comparison.
About A-25 and S-25, the specific surface area and pore volume are larger than A-20, but the measured adsorption performance looks not improved. A possible reason would be the average pore diameter are too large to adsorb Xe atom, since the intensity of van-der-Waals force is inversely proportional to the cube of distance.
5 Conclusion
We have carried out Rn adsorption measurements with ACFs using a newly developed test bench at Kobe University, Japan. The radioactivity of the ACFs provided from UNITIKA Ltd. was lower or comparable to that of the activated charcoals used in previous researches. The measured radioactivity of A-20 for the uranium series was with confidence level. In Air and Ar gas, ACF A-15 demonstrated an excellent adsorption efficiency of reduction at maximum before the saturation of Rn adsorption, and more than adsorption efficiency after the saturation. In Xe gas, the adsorption efficiency values are lower than that in Air or Ar gas. We carried out a set of measurements on Rn adsorption in Xe gas under various conditions, then estimated ACF’s basic performance of flow rate, concentration, and pressure dependence of the Rn adsorption ability in Xe gas. We also observed some difference on Rn adsorption ability from different ACF types. Among the tested ACFs, A-20 has the best Rn adsorption ability. The observed Rn adsorption efficiency was ) % (12 g of A-20, in atmospheric pressure Xe and Bq/m3 Rn). S-25, A-25, and A-15 also show similar adsorption performance.
Acknowledgment
The authors would greatly appreciate Prof. K. Kaneko at Research Initiative for Supra-Materials (RISM), Shinshu University for his very helpful suggestions on this research topic. The authors also would greatly appreciate UNITIKA Ltd. for their kind support on this research. They provided various ACF samples, including some special test products. This work is supported by JSPS KAKENHI Grand Number JP26104008, 18H05536, 16H03973, and the joint research program of the Institute for Cosmic Ray Research (ICRR), the University of Tokyo.
References
- [1] A. Gando et al., Phys. Rev. Lett. 122, 192501 (2019).
- [2] E. Aprile, et al., Nature 568, 532 (2019).
- [3] D.S. Akerib et al., Nucl. Inst. Meth. A 704, 111 (2013).
- [4] E. Aprile et al., Astropart. Phys. 35, 573 (2012).
- [5] K. Abe et al., Nucl. Inst Meth. A 716, 78 (2013).
- [6] Cao X. et al., Sci. China Phys. Mech. Astron. 57, 1476 (2014).
- [7] A. Gando et al., Phys. Rev. Lett. 117, 082503 (2016).
- [8] M. Auger et al., JINST 7, P05010 (2012).
- [9] P. Ferrario et al., JHEP 01, 104 (2016).
- [10] S. Ban et al., Nucl. Inst. Meth. A 875, 185 (2017).
- [11] J. Barea et al., Phys. Rev. C 87, 057301 (2013).
- [12] J. Kotil et al., Phys. Rev. C 89, 064319 (2014).
- [13] J. Heeck et al. EPL. 103, 32001 (2013).
- [14] E. Aprile et al., JCAP 04, 027 (2016).
- [15] J. Aalbers et al., JCAP 1611, 017 (2016).
- [16] D.S. Leonard et al., Nucl. Inst Meth. A 591, 490 (2008).
- [17] E. Aprile et al., Astropart. Phys. 35, 43 (2011).
- [18] E. Aprile et al., Eur. Phys. J. C 77, 890 (2017).
- [19] X. Wang et al., JINST 11, T12002 (2016).
- [20] S. Cebrian et al., JINST 12, T08003 (2017).
- [21] K. Abe et al., Nucl. Inst. Meth. A 884, 157 (2018).
- [22] H. Ito et al., Nucl. Inst. Meth. A 953, 163050 (2020).
- [23] S. Bruenner et al., Eur. Phys. J. C 77, 143 (2017).
- [24] E. Aprile et al., Eur. Phys. J. C 77, 358 (2017).
- [25] K. Abe et al., Nucl. Inst. Meth. A 661, 50 (2012).
- [26] S. Maurer et al., Chem. Eng. Sci. 56, 3443 (2001).
- [27] M. Ikeda et al., Radioisotopes 59, 29 (2010).
- [28] K. Tai and N. Shindo, Sen’i Gakkaishi 49 No.5, 177 (1993).
- [29] K. Kaneko et al., Carbon 30, 1075 (1992).
- [30] M. Aoshima et al., Chem. Phys. Lett. 310, 1 (1999).
- [31] M. Aoshima et al., J. Coll. Int. Sci. 222, 179 (2000).
- [32] K. Kaneko et al., Chem. Lett. 41, 466 (2012).
- [33] S. Ito et al., PTEP 2018, 091H01 (2018).
- [34] S. Lindemann, doctoral dissertation, The Faculty of Physics and Astronomy, Heidelberg University (2013), http://archiv.ub.uni-heidelberg.de/volltextserver/15725/.
- [35] “PURE GASES”, TAIYO NIPPON SANSO CORPORATION, http://www.tn-specialtygases.jp/catalog/pure/.
- [36] Y. Nakano et al., Nucl. Inst. Meth. A 867, 108 (2017).
- [37] S. Fukuda et al., Nucl. Inst. Meth. A 501, 418 (2003).
- [38] J. Boger et al., Nucl. Inst. Meth. A 449, 172 (2000).
- [39] A. Nachab and NEMO collaboration, AIP Conf. Proc. 897, 35 (2007).
- [40] G. Zuzel, AIP Conf. Proc. 1921, 050001 (2018).
- [41] K. Hosokawa et al., PTEP 2015, 033H03 (2015).
- [42] P. Kotrappa et al., Health Phys. 46, 35 (1981).
- [43] P.K. Hopke, Health Phys. 57, 39 (1989).
- [44] M. Nemoto et al., Radioisotopes 46, 35 (1997).
- [45] Y. Takeuchi et al., Nucl. Inst. Meth. A 421, 334 (1999).
- [46] J. Kiko, Nucl. Inst. Meth. A 460, 272 (2001).
- [47] C. Mitsuda et al., Nucl. Inst. Meth. A 497, 414 (2003).
- [48] J.O. Hirschfelder et al., Molecular theory of gases and liquids, (Wiley, New York, 1954), p.1110.
- [49] V.P. Slyusar et al., Sov. J. Low. Temp. Phys. 4, 363 (1978).
- [50] J.J. van Loef, Physica 103B, 362 (1981).