Rigid platform for applying large tunable strains to mechanically delicate samples
Abstract
Response to uniaxial stress has become a major probe of electronic materials. Tunable uniaxial stress may be applied using piezoelectric actuators, and so far two methods have been developed to couple samples to actuators. In one, actuators apply force along the length of a free, beam-like sample, allowing very large strains to be achieved. In the other, samples are affixed directly to piezoelectric actuators, allowing study of mechanically delicate materials. Here, we describe an approach that merges the two: thin samples are affixed to a substrate, that is then pressurized uniaxially using piezoelectric actuators. Using this approach, we demonstrate application of large elastic strains to mechanically delicate samples: the van der Waals-bonded material FeSe, and a sample of CeAuSb2 that was shaped with a focused ion beam.
I Introduction
Uniaxial stress has become a valuable probe of correlated electron systems. It is a qualitatively different probe from hydrostatic stress. For example, the critical temperature of the superconductor Sr2RuO4 peaks strongly under uniaxial stress, while hydrostatic pressure causes a gradual decrease Steppke et al. 2017; Shirakawa et al. 1997. Uniaxial stress applied to YBa2Cu3O6.67 suppresses superconductivity and stabilizes long-range charge modulation, while hydrostatic stress has the opposite effect Souliou et al. 2018; Kim et al. 2018. Strong nematic polarizability of Fe-based superconductors has been revealed through application of anisotropic in-plane strain Kuo et al. 2016.
Recently-developed piezoelectric-based uniaxial pressure cells have allowed application of large uniaxial stresses at cryogenic temperatures. In Refs. Hicks et al. 2014a; Hicks et al. 2014b; Barber et al. 2019; Steppke et al. 2017; Kissikov et al. 2018; Ikeda et al. 2018; Mutch et al. 2019, the samples were prepared for these cells as free beams, whose ends were then affixed to the apparatus. The piezoelectric actuators apply strain to the sample by applying displacement between the two ends. However, preparing samples as free beams is not appropriate for all materials and measurements. For preparing samples by hand, the minimum practical sample length is 1 mm, and many potentially interesting materials are not available as single crystals even this large. Moreover, a minimum mechanical strength is required to prepare samples as free beams. When we attempted, for example, to prepare by hand a beam of the layered, van der Waals-bonded material FeSe, we found it all but impossible to avoid creasing the sample during handling. Force applied to the beam deepened or flattened these creases instead of homogeneously straining the sample.
It has proved practical to strain small, mechanically delicate samples by affixing them directly to piezoelectric actuators Chu et al. 2012. However in this case the sample strain is limited to that which can achieved in the actuator, and if temperature is varied the unusual thermal contraction of piezoelectric actuators (they lengthen along their poling direction as they are cooled) may introduce a large thermal strain. A further point of caution is that the surface of the actuator might not be uniform: the PICMA® actuators from Physik Instrumente, for example, have narrow slits for stress relief in the non-active surface layer.
To merge the benefits of both approaches, we affix samples to a platform that is then mounted in uniaxial stress apparatus for application of large, tunable strains. Strain applied to the platform is transmitted to the sample through the layer of epoxy between them. The idea is simple, and here we discuss practical engineering points involved in making it work.
We also demonstrate that platforms can be used to apply strain to samples that have been microstructured with a focused ion beam (FIB). Microstructuring offers a number of possibilities, including lower geometric uncertainty in measurement of transport coefficients, extreme aspect ratios for high-resolution measurements of resistivity Moll et al. 2016, and measurements on very small samples. A combination of ion beam milling and anisotropic strain, with the sample shaped for measurement of specific elastoresistivity coefficients, has been demonstrated in Ref. Rosenberg et al. 2019.
In section II below we discuss design of the platform, and of a uniaxial stress cell for pressurizing it. In section III, measurements of the strain actually achieved in the platform are presented. In section IV, details of strain transmission from the sample to the platform are discussed, and in section V data on two samples are presented. One is a macroscopic sample of FeSe, a compound with electronic nematic order whose transport properties are sensitive to lattice distortion, and the other is a microstructured sample of CeAuSb2, a heavy-fermion compound with antiferromagnetic order that is substantially altered by strain.
II Design
Schematics of a platform and the piezoelectric uniaxial stress cell used in this work are shown in Fig. 1(a,b). To understand expected performance, the specifications of the cell and platform should be considered together. We discuss the cell first, then the platform, then the combined unit.

The cell is derived from the design presented in Ref. Hicks et al. 2014b, although in contrast to that cell the present cell has a symmetric configuration [Fig. 1(b)]. The central portion and bridges are made of titanium. The central portion [Fig. 1(c)] consists of two outer struts connected by flexures to two inner moving blocks. These outer struts are rigidly joined to a base plate and may be considered as fixed. The flexures serve to guide the moving blocks. They have a low spring constant against the intended longitudinal motion, but a much higher spring constant against other motions. Piezoelectric actuators on each side of the cell are used to apply displacement between the outer struts and moving blocks. For example, extension of the actuators labelled A and contraction of those labelled B in Fig. 1(b), through application of positive and negative voltages respectively, pulls the moving blocks outward and tensions the platform.
To facilitate mounting of platforms the cell has a flat upper surface. The figure illustrates a mounting scheme in which the outer tabs of the platform are clamped under cap foils, a design intended to allow rapid exchange of platforms while protecting them from torques applied while tightening the clamping screws. Alternative mounting methods could also be devised. Placing the platform on top of the cell means that the moving blocks experience torque about the axis when the cell is operated: the force applied by the actuators is not aligned with the resisting force from the platform. The flexures resist this torque with a high spring constant.
As illustrated in Fig. 1(d), the cell can be modelled as a perfect actuator (meaning an actuator that applies a specified displacement irrespective of the resisting force) in series with a spring of spring constant which represents the elastic compliance of the cell itself. If is less than the spring constant of the platform, then the displacement generated by the actuators goes mostly into deforming the cell itself, rather than the platform. We present in the appendix an approximate calculation of , obtaining N/m. About half of this compliance comes from rotation of the moving blocks under the torque that they experience. In other words, could be approximately doubled by placing the sample / platform on the axis of the actuators. A compact, symmetric cell design in which the sample and actuators are aligned is presented in Ref. Kostylev, Yonezawa, and Maeno 2019; the design here prioritizes a large mounting surface over maximum spring constant.
The spring constant of the cell was then measured at room temperature by applying a force using a spring of known spring constant, and using a laser interferometer to measure the resulting displacement. The result is in reasonable agreement with the calculation: 12 N/m. Further details are given in the Appendix.
We now discuss the platform design. To achieve large strains, we introduce a short, narrow section in the middle to which the sample is mounted and in which applied force is concentrated, resulting in a bowtie shape of the platform. The large tabs facilitate handling and mounting to the cell. We fabricated platforms from two materials, 0.2 mm-thick temper annealed grade 2 titanium foil 11 1 Goodfellow, grade 2 (chemistry only) temper annealed titanium foils (Part No. TI000400), post-processed by KMLT Dermicut GmbH, Neukirch, Germany. and 0.2 mm-thick fused quartz plate 22 2 Plan Optik AG, Eisoff, Germany, 4 inch-diameter, 200 m-thick quartz wafers, post-processed by Lasercut24, Golmsdorf, Germany.. We used titanium because its thermal contraction matches that of the cell (though there may be small differences due to differing grain structure), and quartz because it is a thermally conductive insulator with a manageable Young’s modulus: 73 GPa for fused quartz at room temperature. (Sapphire, a more common choice when a thermally conductive, electrically insulating material is required, has a Young’s modulus of 460 GPa, far higher than that of either quartz or titanium.) Platforms of both materials were cut with a laser.

A key parameter for characterising platforms is their effective length , defined by , where is the displacement applied to the platform by the cell and is the longitudinal strain achieved in the neck of the platform. To a first approximation, is the length of the neck; however, it should be obtained through finite element analysis of platform deformation. Our specific platform design is shown in Fig. 2(a), and a simulation of 10 m displacement applied between the mounting holes [Fig. 2(b)] yields mm. In simulations is found to vary by 10% depending on precisely which portions of the platform are taken to be locked to the cell, so it is not strictly a property of the platform alone but of the cell and platform together.
We now estimate the maximum strain achievable with this system, assuming elastic platform deformation. The spring constant of the platform is given by , where is the Young’s modulus of the platform material and is the cross-sectional area of the neck. Taking GPa for titanium gives N/m, and GPa for quartz yields N/m. At 1.5 K, the actuators can be operated safely at voltages between and V. At V, the strain within the actuators is , and at V, , which yields a maximum displacement of 27 m 33 3 The actuators used in this cell are PICMA® actuators from Physik Instrumente, model number P885.10. Their response at 1.5 K is reported in Ref. Barber et al. 2019.. The fraction of this displacement that goes into the platform is , which, taking N/m, is 82% for the titanium and 86% for the quartz platforms. This yields, under an assumption of elastic deformation, a maximum achievable strain of for the titanium platform, and for the quartz platforms. In reality the elastic limit of grade 2 titanium is , limiting the strain that can be achieved, and grade 5 titanium (Ti0.90V0.04Al0.06) may be a better choice for high strains.
For electrical measurements on titanium platforms it is necessary to create an insulating layer between the platform and the sample. We tested oxidation of the titanium surface by two methods: thermal and electrolytic. For thermal oxidation, heating the platforms for four hours in air to 700∘ C resulted in an oxide layer 1.6 m thick. The layer could be made thicker by heating for more time or at higher temperature; however, it then flaked off more easily. We generally used electrolytic oxidation performed using a solution of 10 g/L trisodium phosphate in water as an electrolyte. An applied voltage of 220 V for 15 minutes yielded oxide films with a thickness of at least 200 nm.
The electrolytic oxide layers were sufficiently robust to prevent electrical shorts between the platform and samples placed by hand but were not highly reliable as insulation against evaporated gold contacts. Furthermore, as noted in the introduction a major benefit of platforms is that they facilitate sample preparation with a focused ion beam, however the ion beam quickly milled through the oxide layer and created shorts through redeposited material. Therefore, a key advantage of quartz is that it is fully insulating.
An advantage of a short is that differential thermal contraction between the platform and (titanium) strain cell can be compensated during temperature changes by operating the actuators, such that the platform need not have a thermal contraction close to that of titanium. Fused quartz expands slightly during cooling Okaji et al. 1995; the differential thermal expansion between titanium and quartz upon cooling from 295 to 5 K is 0.16%, corresponding here to a differential length change of % = 6.0 m. This is well within the range of the piezoelectric actuators of this cell.
III Experimental tests of the platform
The strain actually achieved in the platform was tested by two means. In the first test, the strain achieved in a quartz platform was measured at room temperature using a strain gauge affixed to the neck of the platform, while the applied displacement was measured using the capacitive displacement sensor incorporated into the cell. Results of the test using a strain gauge are shown in Fig. 3(a). Although there is minor hysteresis in the measured strain versus applied displacement, the effective length of mm, obtained from a linear fit to the data, is close to the calculated effective length. We note that this is the empirical conversion constant between the displacement measured by the sensor in the cell and the strain achieved in the platform. Due to torsional loading of the moving blocks the actual displacement applied to the platform can differ by several percent from that measured by the sensor; see the Appendix for details.
In the second test, the strain in a quartz platform was measured optically. A thin layer of silver epoxy was painted over the platform to create features whose positions could be tracked under a microscope while displacement was applied to the platform. Pictures of the platform at different displacements were then analysed using image correlation Turner, Crozier, and Reu 2015. Results of the optical test of the quartz platforms are shown in Fig. 3(b). The effective length in this case was found to be mm, in good agreement with that found with the strain gauge. Finally, a titanium platform was also tested optically at room temperature, keeping to strains below the elastic limit of the platform. Results are shown in Fig. 3(c): was found to be 3.4 mm, slightly less than the calculated value.
IV Calculations of strain transmission to the sample
When using platforms, the sample will in general be thin, and the epoxy layer is likely to have much lower elastic moduli than the sample. The elastic compliance of the epoxy can limit strain transmission to small samples. When the sample and epoxy layer are both thin enough that the dependence of the strain within each can be neglected, and when the epoxy elastic moduli are low, strain transmission from the platform to the sample can be characterized to a good approximation by a strain transmission length , a length scale over which the strain the sample adjusts to match that in the platform. We note that this analysis will also apply to the thermal-expansion-based platforms reported in Refs. Sunko et al. 2019; He et al. 2018, and also that it is not necessarily desirable to make as short as possible: increasing reduces peak shear strains within the epoxy, potentially raising the maximum strain achievable in the sample before the epoxy ruptures.
We consider a rectangular sample, as illustrated in Fig. 4. We assume a sample length . In general, high strain homogeneity is achieved within the sample when the width is either much less than or much greater than . In the former case, the transverse strain in the sample decouples from that in the platform, and is set instead by the longitudinal strain multipled by the sample’s Poisson’s ratio. In the latter case, the transverse strain locks to that of the platform, which is the longitudinal strain multiplied by the platform’s Poisson’s ratio. The strain transmission length was derived in Ref. Hicks et al. 2014b: , where is the relevant elastic modulus of the sample, the sample thickness, the epoxy thickness, and the shear modulus of the epoxy. For most epoxies is a strongly temperature-dependent parameter. At cryogenic temperatures, Stycast 1266 has a Young’s modulus of 4.5 GPa Hashimoto and Ikushima 1980, and taking a Poisson’s ratio of 0.3 yields GPa. If GPa (a typical value for a metal) and m, then comes to 76 m.
In the narrow-sample limit, the - and -axis stresses in the sample are both zero, and is the Young’s modulus of the sample. In the wide-sample limit, the transverse strain is fixed while the -axis stress is zero, and , where are components of the elastic tensor. For typical materials, these moduli are not drastically different, and the sample and platform Poisson’s ratios will also not differ drastically, and so whether the sample is in the narrow or wide limit is not highly important.
FeSe, on the other hand, has a tetragonal-to-orthorhombic structural transition at K, and the distinction is important. In the vicinity of this transition its Young’s modulus, for strains along the principal axes of the distortion, is extremely small. The lattice however still resists changes in unit cell area, and so remains substantial, at 40 GPa Millican et al. 2009; Zvyagina et al. 2013. Finite element simulation may be necessary to understand fully the strain achieved in samples such as FeSe that have unusual elastic properties. The point of the discussion here is not to precisely map the strain in a sample, but to provide guidelines for setting sample dimensions.

In Fig. 4(b-c), results are shown of finite element simulation of the strain in a rectangular sample. The epoxy was assigned a Young’s modulus of 4.5 GPa and an isotropic Poisson’s ratio of 0.3. The sample was assigned a Young’s modulus of 100 GPa and isotropic Poisson’s ratio of 0.3. The epoxy and sample thickness are both set to 10 m. The sample length and width are set to and , respectively, i.e. 1140 228 m: we choose an intermediate width to highlight the effect of incomplete transmission of transverse strain. The epoxy layer is assumed to have uniform thickness even across the sample edge; in reality the epoxy will wick up the sides of the sample, however the low elastic moduli of the epoxy means that the effect of this on the strain in the sample will be minimal. The platform’s neck has a cross section of m, and we assign a Young’s modulus of 125 GPa. For the purposes of simulation the platform is taken to have a constant cross section, and strain is applied to the platform by applying force to its end faces. The platform is assigned a Poisson’s ratio of zero, an unrealistically low value that is chosen to bring out in the simulation the effect of Poisson’s ratio mismatch between the sample and platform.
Fig. 4(b) shows the longitudinal strain at the upper surface of the sample. It is essentially zero at the sample ends, and then on moving towards the center of the sample increases following a saturating exponential. Because the sample is long compared with , the strain in the center nearly matches that applied to the platform.
Fig. 4(c) shows the transverse strain . Along the edges, is controlled by the Poisson’s ratio of the sample, whereas towards the center it is controlled more by that of the platform. Because the width of this sample is neither long nor short compared with , and the platform and sample Poisson’s ratios were chosen to be very different, has low uniformity.
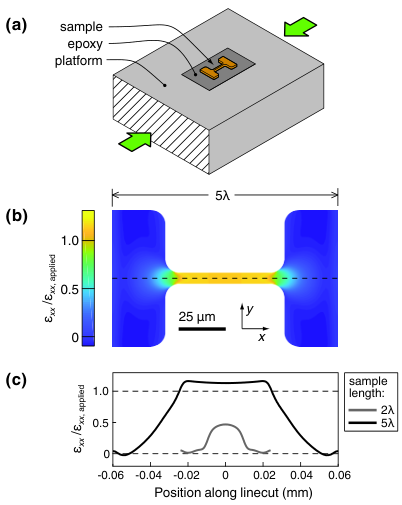
Samples that cannot be made long with respect to can be shaped with FIB milling to achieve good strain transmission. We illustrate the concept in Fig. 5(a): the center of the sample is milled into a narrow neck, and wide end tabs anchor the ends of this neck to the platform. The measurement would then be configured, for example in the placement of voltage contacts, to measure the properties of the neck. For this simulation we set the epoxy thickness to 1 m, a thickness that we have found to be achievable for smaller samples, and leave all other parameters unchanged from the preceding simulation.
The calculated profile of is shown in Fig. 5(b). The end tabs are essentially unstrained, because they are short along compared with , however their area is sufficient that they couple to the platform and transfer substantial force from the platform to the neck. In fact, because the tabs themselves resist straining, the strain in the neck overshoots that in the platform.
In Fig. 5(c) we also show results for an even smaller sample: still of thickness 10 m, however with other dimensions scaled so that its total length is . The strain in the neck now considerably undershoots that in the platform; in other words even with this shaping this sample is too small for effective strain transmission. In general, shaping the sample as presented here is a method to transfer strain effectively into smaller samples, however uncertainty in the thickness of the epoxy layer and in the epoxy elastic moduli will introduce uncertainty into the strain actually achieved.
V Measurements of samples
We first present results on FeSe, and then a microstructured sample of CeAuSb2. FeSe has electronic nematic order, a spontaneous anisotropy in the electronic structure, below 90 K. In the vicinity of this nematic transition, a high susceptibility towards electronic orthorhombicity causes the resistivity to respond very sensitively to lattice distortion Hosoi et al. 2016; Watson et al. 2015. Its structural simplicity make it an appealing target for study, however it is a layered compound with van der Waals interlayer bonding, which makes samples mechanically delicate and difficult to strain. CeAuSb2, on the other hand, is mechanically more robust. It has an antiferromagnetic transition at 6.5 K, that is strongly altered under orthorhombic lattice distortion Park et al. 2018. Its resistivity changes strongly across this transition, providing an easy-to-measure signal that makes CeAuSb2 a good test subject.
A photograph of an FeSe sample mounted on a platform is shown in Fig. 6(a). Our mounting procedure was as follows. The single crystals were first cut into a bar shape using a wire saw. Samples were then temporarily attached to a carrier plate using CrystalBond, and repeatedly cleaved using adhesive tape. In this way, thicknesses of less than 20 m were achieved. To create stable and low-resistance contacts, the surface was cleaned with a 10 minute plasma etch, and 150 nm of gold (without any adhesion layer) was sputtered onto the four contact regions. The center of the platform was then covered with a thin layer of MasterBond EP29LPSP epoxy, a low-viscosity epoxy, spread to a similar footprint as that of the sample. The sample was placed using static electricity with a polymer-tipped tool made by MiTeGen. It was then gently pressed down using the same tool, before curing the epoxy at 70∘C for ten hours. This heating initially reduces the viscosity of the epoxy, which wicks around the sample and forms smooth ramps along its edges. Lastly, 25 m diameter gold wires were attached using silver epoxy cured at room temperature.
This recipe gave epoxy layers of thickness 5–10 m [Fig. 6(b)]. The samples were not flat on this scale, so this may be a lower limit set by the sample shape rather than the viscosity of the epoxy. The sample photographed in Fig. 6(a) is 10 m thick, so taking GPa for FeSe gives a strain transmission length of m. This sample is 230 m wide, and can therefore be taken to good approximation to be in the wide-sample limit. Fig. 6(c) shows resistivity versus applied longitudinal strain of this sample, at temperature K. The resistivity of FeSe has been shown to be very sensitive to anisotropic strain at low strains Watson et al. 2015; Hosoi et al. 2016; here we show measurements up to much higher strains. In the first ramp, the strain was ramped from +0.02% to -0.31% and back, where negative values denote compression. The strain is taken as the applied displacement divided by . In the second ramp, the strain was ramped from -0.58% to -0.12%, then back.

There is small hysteresis within each pair of curves [Fig. 6(c), blue and green], but very substantial offset between the two pairs [Fig. 6(c)]. This is a consequence of plastic deformation of the platform: the elastic limit of the titanium of the platform at 95.8 K was exceeded when the strain was ramped to -0.58%. This caused material in the platform neck to “flow” outward, carrying the sample with it and introducing, in effect, an offset in the anisotropic strain . Upon reversing the direction of the strain ramp the platform deformation was again elastic for some range, and the dominant effect of the offset introduced into was a horizontal offset between the low- and high-strain strain ramps shown in Fig. 6(c). Crucially, the sample did not deform plastically: as shown in Fig. 6(d), to within resolution, the low-temperature resistivity of the sample did not increase with the application of large strain, indicating that dislocations were not introduced into the sample. In other words, this method of sample mounting can be used to apply elastic strains of at least 0.5% to a mechanically delicate, van der Waals-bonded material such as FeSe.
Fig. 7(a) shows a sample of the heavy fermion antiferromagnet CeAuSb2 mounted on a quartz platform and shaped with an ion beam. This particular sample incorporates long current leads: with microstructured samples, the most practical way to deposit contacts is deposition from above, and the long leads allow the current to spread through the full thickness of the sample.
The CeAuSb2 sample was prepared using the following procedure. First, the sample was polished to a thickness of 20 m and then cut with a wire saw to dimensions of m. A 50 nm/ 300 nm composite layer of Ti/Au was deposited over the entire upper surface, and the sample was then mounted onto a quartz platform with Stycast 1266. The epoxy was mixed at room temperature and degassed for 10 minutes in vacuum, and was then applied to the platform. Next, the epoxy was preheated on a hot plate to 65∘ C before placing the sample, in order to reduce its viscosity. The epoxy was allowed to spread by capillary action after the sample was placed on top, without applying any additional force to the surface of the sample. With some practice, we learned to judge the size of the epoxy droplet so that in the end the epoxy thickness was 1 m. The epoxy formed natural ramps up the edges of the sample. The epoxy was left to cure at 65∘ C for about six hours, and then another layer of gold was deposited to make connection to the sample via the epoxy ramps. The sample was then milled into the desired shape using a focused ion beam.
The elastic moduli of CeAuSb2 have not been measured. Taking GPa (a typical value for metals), m, m, and GPa yields a strain transmission length of m, so the total length of this sample is . End tabs were incorporated into the sample shape, as described above, to aid strain transfer. The width of the neck, at 15 m, is , so in the neck will be decoupled from that in the platform.
Results of measurement are shown in Fig. 7(b-d). Again, strain is taken as applied displacement divided by . CeAuSb2 has a transition into spin density wave order at Néel temperature =6.5(1) K Zhao et al. 2016, which can be clearly identified by a sharp drop in resistivity, as seen in panel (b). The propagation vectors of the spin density waves are (0.136(2), 0.136(2), 0.5), where the indicates different domains Marcus et al. 2018. As a result of domain formation, there is a first-order transition due to domain flipping as strain applied along a direction is ramped from compressive to tensile or vice versa, a process that has also been probed in bulk samples Park et al. 2018. It manifests in two features in the data. Firstly, when is plotted against strain applied along a direction, , it shows an upward cusp at ; this is shown in panel (c). Secondly, when is measured against below , there is hysteresis across ; this is shown in panel (d).

The results from the microstructured sample match well those recorded from bulk samples, demonstrating that rigid platforms can be used to pressurize microstructures. We note in addition that the measurements on the microstructured sample extend to higher tensions than the bulk sample, as shown in panels (c) and (d). The microstructured sample withstood higher tensions than the bulk samples, likely because the ion beam milling leaves smoother edges than can be obtained from cutting with a wire saw, and so minimizing the appearance of edge defects at which stress concentrates, initiating fractures.
VI Conclusion
We have described a method for applying anisotropic strain to samples by affixing them to platforms, and then applying uniaxial pressure to the platform using a piezoelectric-driven pressure cell. Key to making this process work is to understand at the design stage the relative spring constants of the pressure cell and the platform. In the present case, the cell spring constant was 12 N/m and the platform spring constant 2–3 N/m, ensuring that most of the displacement generated by the actuators went into deformation of the platform rather than the cell. Two platform materials were demonstrated, fused quartz and titanium.
This method allows large elastic strains to be applied to mechanically delicate samples. Here, an elastic strain of was demonstrated in the van der Waals-bonded material FeSe. Attachment to a platform also facilitates shaping the sample with a focused ion beam, which was demonstrated here with a sample of CeAuSb2. We anticipate a wide range of further platform-based strain measurements.
Acknowledgment
We acknowledge the financial support of the Max Planck Society. JP acknowledges the financial support of the National Research Foundation of Korea (NRF) funded by the Ministry of Science and ICT (No. 2016K1A4A4A01922028). Work in Japan was supported by a Grant-in-Aid for Scientific Research on Innovative Areas “Quantum Liquid Crystals” (No. JP19H05824) from Japan Society for the Promotion of Science. CWH has a 31% ownership stake in Razorbill Instruments, a company that manufactures uniaxial pressure apparatus. Raw data for all figures in this paper are available at to be determined.
VII Appendix
VII.1 Discussion and measurement of the cell spring constant
The metallic parts of the cell are made of titanium, which has a room-temperature Young’s modulus of 103 GPa. In order to estimate the spring constant of the cell, we consider elastic deformation in four areas. (1) The outer struts are slightly compressible; based on finite element analysis of these struts joined to the base plate, we estimate a spring constant for compression of the outer struts of 230 N/m. (2) The piezoelectric actuators have a room-temperature Young’s modulus of 40 GPa, and the actuators each have dimensions mm3. Mechanically, the actuators labelled B in Fig. 1 are each in series with the two actuators on each side labelled A, which are in parallel with each other. The spring constant for compressing the actuators on one side therefore comes to 74 N/m. (3) The bridges that connect the actuators on each side bend slightly. The spring constant for bending a single bridge at the attachment points of the actuators is 95 N/m. (4) As described in the main text, during operation of the cell substantial torque is applied to the moving blocks, because the axis of the actuators is not aligned with the axis of the platform. The flexures resist this torque, however not with infinite spring constant. Finite element analysis, illustrated in Fig. 8, yields a spring constant for rotation of a single moving block, as seen at a height 0.5 mm above the upper surface of the cell, of 35 N/m. We note that this simulation neglects any contribution to rotational stiffness from the piezoelectric actuators; including this contribution would increase the spring constant. These separate spring constants can all be combined in series: , where is the spring constant of each element described above. This gives N/m.

Our setup for measuring the cell spring constant is shown in Fig. 9. A fiber head of a laser interferometer were secured mechanically to the cell, and positioned so that it was centered 0.5 mm above the surface of the cell. A spring was then inserted between two screws attached to the moving blocks, configured with aluminium levers so that the force would also be applied at a height 0.5 mm above the surface of the cell. The force applied by the spring divided by the length change observed with the interferometer yielded the spring constant of the cell, as seen for samples 0.5 mm above the upper surface of the cell: 12 N/m. We note that because the platforms described here are mounted directly on the upper surface of the cell, they will see a marginally higher cell spring constant.

VII.2 Torsional loading of the moving blocks
Rotation of the moving blocks will also introduce a bending moment on the platform, however we show here that it is negligible. In the simulation shown in Fig. 8, the torque applied to the moving block is 3.2 N-mm, and the resulting rotation 28.3 nm/3.2 mm = , indicating a torsional stiffness of the moving block of N-m. This is an underestimate, as the simulation neglects any contribution to torsional stiffness from the bending stiffness of the actuators.
Reaching, for example, a strain of in a titanium platform requires a force of 103 GPa 500 m 200 m = 52 N. The platform is centered 2.8 mm above the axis of the actuators, so the torque on each block is 146 N-mm, and the resulting rotation angle of each block rad. The total bend angle across the platform is double this, because both blocks rotate, so the radius of curvature of the platform is m. This gives , where is the difference in strain between the upper and lower surfaces of the platform, and is the average strain in the center of the platform. The bending-induced strain gradient in the samples will be even smaller than this, because the samples are thinner.
The capacitive displacement sensor is centered 1.5 mm below the platform, so this rotation causes a 6% difference between the displacement measured by this sensor and that actually applied to the platform. However if is calibrated using the displacement sensor in the cell then this discrepancy is included in the calibration.
VII.3 Platform design considerations
There are several variables to consider in designing the platform.
- 1.
The neck should be wide enough for practical sample mounting; we chose here a neck width of 0.5 mm.
- 2.
The cross-sectional area of the neck should substantially exceed that of samples that will be attached to it, so that the presence of the sample does not strongly affect the strain field within the neck.
- 3.
As described in the main text, the combination of platform effective length, platform spring constant, and cell spring constant must be thought through at the design stage, to ensure that the target strain can be reached. In the present case, we targeted a relatively short and low platform spring constant, goals that in combination dictated a small cross section of the neck.
- 4.
The platform must be thick enough not to buckle under the maximum strain desired in the measurement.
- 5.
The strain in the center of the neck should be relatively homogeneous.
- 6.
Stress concentration along the edges of the platform should be kept low, so that the achievable strain in the sample area is not limited by fracture or plastic deformation elsewhere in the platform. In the present design, the maximum strain along the edge of the platform is 1.04 times the strain in the center of the neck.
- 7.
When the platform and cell are made of different materials, should be short enough that the actuators have enough range to compensate differential thermal contraction between the cell and platform.
References
- Steppke et al. (2017) A. Steppke, L. Zhao, M. E. Barber, T. Scaffidi, F. Jerzembeck, H. Rosner, A. S. Gibbs, Y. Maeno, S. H. Simon, A. P. Mackenzie, and C. W. Hicks, Science 355, eaaf9398 (2017).
- Shirakawa et al. (1997) N. Shirakawa, K. Murata, S. Nishizaki, Y. Maeno, and T. Fujita, Physical Review B 56, 7890 (1997).
- Souliou et al. (2018) S. M. Souliou, H. Gretarsson, G. Garbarino, A. Bosak, J. Porras, T. Loew, B. Keimer, and M. Le Tacon, Physical Review B 97, 020503 (2018).
- Kim et al. (2018) H.-H. Kim, S. M. Souliou, M. E. Barber, E. Lefrançois, M. Minola, M. Tortora, R. Heid, N. Nandi, R. A. Borzi, G. Garbarino, A. Bosak, J. Porras, T. Loew, M. König, P. J. W. Moll, A. P. Mackenzie, B. Keimer, C. W. Hicks, and M. L. Tacon, Science 362, 1040 (2018).
- Kuo et al. (2016) H.-H. Kuo, J.-H. Chu, J. C. Palmstrom, S. A. Kivelson, and I. R. Fisher, Science 352, 958 (2016).
- Hicks et al. (2014a) C. W. Hicks, D. O. Brodsky, E. A. Yelland, A. S. Gibbs, J. A. Bruin, M. E. Barber, S. D. Edkins, K. Nishimura, S. Yonezawa, Y. Maeno, et al., Science 344, 283 (2014a).
- Hicks et al. (2014b) C. W. Hicks, M. E. Barber, S. D. Edkins, D. O. Brodsky, and A. P. Mackenzie, Review of Scientific Instruments 85, 065003 (2014b).
- Barber et al. (2019) M. E. Barber, A. Steppke, A. P. Mackenzie, and C. W. Hicks, Review of Scientific Instruments 90, 023904 (2019).
- Kissikov et al. (2018) T. Kissikov, R. Sarkar, M. Lawson, B. Bush, E. I. Timmons, M. A. Tanatar, R. Prozorov, S. Bud’ko, P. C. Canfield, R. Fernandes, et al., Nature communications 9, 1058 (2018).
- Ikeda et al. (2018) M. S. Ikeda, T. Worasaran, J. C. Palmstrom, J. Straquadine, P. Walmsley, and I. Fisher, Physical Review B 98, 245133 (2018).
- Mutch et al. (2019) J. Mutch, W.-C. Chen, P. Went, T. Qian, I. Z. Wilson, A. Andreev, C.-C. Chen, and J.-H. Chu, Science advances 5, eaav9771 (2019).
- Chu et al. (2012) J.-H. Chu, H.-H. Kuo, J. G. Analytis, and I. R. Fisher, Science 337, 710 (2012).
- Moll et al. (2016) P. J. Moll, P. Kushwaha, N. Nandi, B. Schmidt, and A. P. Mackenzie, Science 351, 1061 (2016).
- Rosenberg et al. (2019) E. W. Rosenberg, J.-H. Chu, J. P. C. Ruff, A. T. Hristov, and I. R. Fisher, Proceedings of the National Academy of Sciences 116, 7232 (2019), https://www.pnas.org/content/116/15/7232.full.pdf .
- Kostylev, Yonezawa, and Maeno (2019) I. Kostylev, S. Yonezawa, and Y. Maeno, Journal of Applied Physics 125, 082535 (2019).
- (16) Goodfellow, grade 2 (chemistry only) temper annealed titanium foils (Part No. TI000400), post-processed by KMLT Dermicut GmbH, Neukirch, Germany.
- (17) Plan Optik AG, Eisoff, Germany, 4 inch-diameter, 200 m-thick quartz wafers, post-processed by Lasercut24, Golmsdorf, Germany.
- (18) The actuators used in this cell are PICMA® actuators from Physik Instrumente, model number P885.10. Their response at 1.5 K is reported in Ref. Barber et al. 2019.
- Okaji et al. (1995) M. Okaji, N. Yamada, K. Nara, and H. Kato, Cryogenics 35, 887 (1995).
- Turner, Crozier, and Reu (2015) D. Turner, P. Crozier, and P. Reu, “Digital Image Correlation Engine (DICe), Version 2.0,” (2015).
- Sunko et al. (2019) V. Sunko, E. Abarca Morales, I. Marković, M. E. Barber, D. Milosavljević, F. Mazzola, D. A. Sokolov, N. Kikugawa, C. Cacho, P. Dudin, H. Rosner, C. W. Hicks, P. D. C. King, and A. P. Mackenzie, npj Quant. Materials 4, 46 (2019).
- He et al. (2018) M. Q. He, L. R. Wang, F. Ahn, F. Hardy, T. Wolf, P. Adelmann, J. Schmalian, I. Eremin, and C. Maingast, Nature Communications 8, 504 (2018).
- Hashimoto and Ikushima (1980) T. Hashimoto and A. Ikushima, Review of Scientific Instruments 51, 378 (1980).
- Millican et al. (2009) J. N. Millican, D. Phelan, E. L. Thomas, J. B. Leão, and E. Carpenter, Solid State Communications 149, 707 (2009).
- Zvyagina et al. (2013) G. A. Zvyagina, T. N. Gaydamak, K. R. Zhekov, I. V. Bilich, V. D. Fil, D. A. Chareev, and A. N. Vasiliev, European Physics Letters 101, 56005 (2013).
- Hosoi et al. (2016) S. Hosoi, K. Matsuura, K. Ishida, H. Wang, Y. Mizukami, T. Watashige, S. Kasahara, Y. Matsuda, and T. Shibauchi, Proceedings of the National Academy of Sciences 113, 8139 (2016).
- Watson et al. (2015) M. D. Watson, T. K. Kim, A. A. Haghighirad, N. R. Davies, A. McCollam, A. Narayanan, S. F. Blake, Y. L. Chen, S. Ghannadzadeh, A. J. Schofield, M. Hoesch, C. Meingast, T. Wolf, and A. I. Coldea, Physical Review B 91, 155106 (2015).
- Park et al. (2018) J. Park, H. Sakai, O. Erten, A. P. Mackenzie, and C. W. Hicks, Physical Review B 97, 024411 (2018).
- Zhao et al. (2016) L. Zhao, E. A. Yelland, J. A. Bruin, I. Sheiken, P. C. Canfield, V. Fritsch, H. Sakai, A. P. Mackenzie, and C. W. Hicks, Physical Review B 93, 195124 (2016).
- Marcus et al. (2018) G. G. Marcus, D.-J. Kim, J. A. Tutmaher, J. A. Rodriguez-Rivera, J. O. Birk, C. Niedermeyer, H. Lee, Z. Fisk, and C. L. Broholm, Physical Review Letters 120, 097201 (2018).