ALMA 0.88 mm Survey of Disks around Planetary-mass CompanionsFacilities: ALMACASA (McMullin et al. 2007), pdspy (Sheehan et al. 2019)
Abstract
Characterizing the physical properties and compositions of circumplanetary disks can provide important insights into the formation of giant planets and satellites. We report ALMA 0.88 mm (Band 7) continuum observations of six planetary-mass (10–20 ) companions: CT Cha b, 1RXS 1609 b, ROXs 12 b, ROXs 42B b, DH Tau b, and FU Tau b. No continuum sources are detected at the locations of the companions down to 3 limits of 120–210 Jy. Given these non-detections, it is not clear whether disks around planetary-mass companions indeed follow the disk flux-host mass trend in the stellar regime. The faint radio brightness of these companion disks may result from a combination of fast radial drift and a lack of dust traps. Alternatively, as disks in binary systems are known to have significantly lower millimeter fluxes due to tidal interactions, these companion disks may instead follow the relationship of moderate-separation binary stars. This scenario can be tested with sensitive continuum imaging at rms levels of 10 Jy.
Keywords:
accretion, accretion disks — techniques: interferometric — planets and satellites: general1. Introduction
| Source | Date | $\dagger$$\dagger$footnotemark: | Calibrators | Beam | rms | ||
|---|---|---|---|---|---|---|---|
| (m) | (s) | Gain/Bandpass/Flux | (size, PA) | (Jy beam-1) | |||
| CT Cha | 2016-12-17 | 42 | 15.1–460.0 | 1609 | J10588003, J14274206, J11074449 | 087058, 64 | 52 |
| 1RXS 1609 | 2017-01-29 | 43 | 15.1–331.0 | 941 | J16342058, J14274206, Titan | 097070, 729 | 45 |
| ROXs 12 | 2017-04-08 | 41 | 15.1–390.0 | 729 | J16252527, J15172422, J15172422 | 122076, 997 | 71 |
| ROXs 42B | 2017-04-13 | 44 | 15.1–460.0 | 941 | J16252527, J15172422, J15172422 | 069057, 878 | 43 |
| DH Tau | 2018-05-13 | 45 | 15.1–313.7 | 1730 | J04383004, J05101800, J05101800 | 117087, 130 | 41 |
| FU Tau | 2018-05-20 | 44 | 15.0–313.7 | 2215 | J04262327, J04230120, J04230120 | 119092, 61 | 39 |
Analogous to circumstellar disks, circumplanetary disks regulate mass accretion and angular momentum transport as giant planets form, thereby determining the formation timescale, temperature, luminosity, and terminal spin velocity of giant planets (e.g., Eisner 2015; Zhu 2015; Szulágyi & Mordasini 2017; Batygin 2018; Bryan et al. 2018). Characterizing circumplanetary disks helps reveal the physical mechanisms involved in giant planet formation as well as the initial conditions and bulk composition of exomoons, providing insight into similar processes that occurred for giant planets in the early Solar System (e.g., Stamatellos & Herczeg 2015; Szulágyi et al. 2017; Dra̧żkowska & Szulágyi 2018; Szulágyi et al. 2018b). Circumplanetary disks inside gapped protoplanetary disks are expected to be detectable with ALMA across a range of millimeter and sub-millimeter wavelengths (e.g., Zhu et al. 2016; Zhu et al. 2018; Szulágyi et al. 2018a), and recently the first such tentative detections have been reported around PDS 70 (Isella et al. 2019).
Disks around longer-period planetary-mass companions (PMCs) are promising targets to study the structure and evolution of circumplanetary disks. Discovered in direct imaging surveys, long-period PMCs have masses of 20 and very wide orbits of 100 AU. The formation of PMCs remains poorly constrained. While binary-like formation, such as prestellar core collapse (Low & Lynden-Bell 1976) or disk fragmentation (e.g., Kratter et al. 2010), is often invoked to explain their existence, PMCs’ bottom-heavy mass distribution may imply that they are predominantly formed via core or pebble accretion (Nielsen et al. 2019; Wagner et al. 2019).
PMC disks are likely to be easier to detect than circumplanetary disks around close-in giant planets because PMCs are widely separated from their hosts and their Hill radii are accordingly larger. Resolved dust and gas observations of PMC disks may reveal substructures that could be linked to exomoons, and allow direct dynamical mass measurements that would enable tests of evolutionary models in the planet-mass regime. Recent photometric, spectroscopic, and polarimetric observations have shown that many young PMCs show signs of active, ongoing accretion (e.g., Bowler et al. 2011; Bowler et al. 2014; Bowler et al. 2017; Zhou et al. 2014; Wu et al. 2015b; Wu et al. 2017a; Ginski et al. 2018; Santamaría-Miranda et al. 2018). However, PMC disks have so far remained undetected in radio observations (e.g., Bowler et al. 2015; MacGregor et al. 2017; Ricci et al. 2017; Wu et al. 2017b; Wolff et al. 2017; Pérez et al. 2019).
Here we present ALMA 0.88 mm (Band 7) observations of six PMCs (CT Cha b, 1RXS J160929.1–210524 b, ROXs 12 b, ROXs 42B b, DH Tau b, and FU Tau b) and discuss the implications.
2. Observations and Data Reduction
To maximize continuum sensitivity, we performed the survey in Band 7 instead of Band 6 (1.3 mm) as disks emit stronger dust continuum at shorter wavelengths. Our resolution of 06–12 was sufficient to separate the companions from the primaries, yet not spatially resolve the companion disks (assuming sizes less than the Hill radius) to maximize the sensitivity. Similar strategies have been adopted in previous studies of PMC disks (Bowler et al. 2015; MacGregor et al. 2017; Ricci et al. 2017).
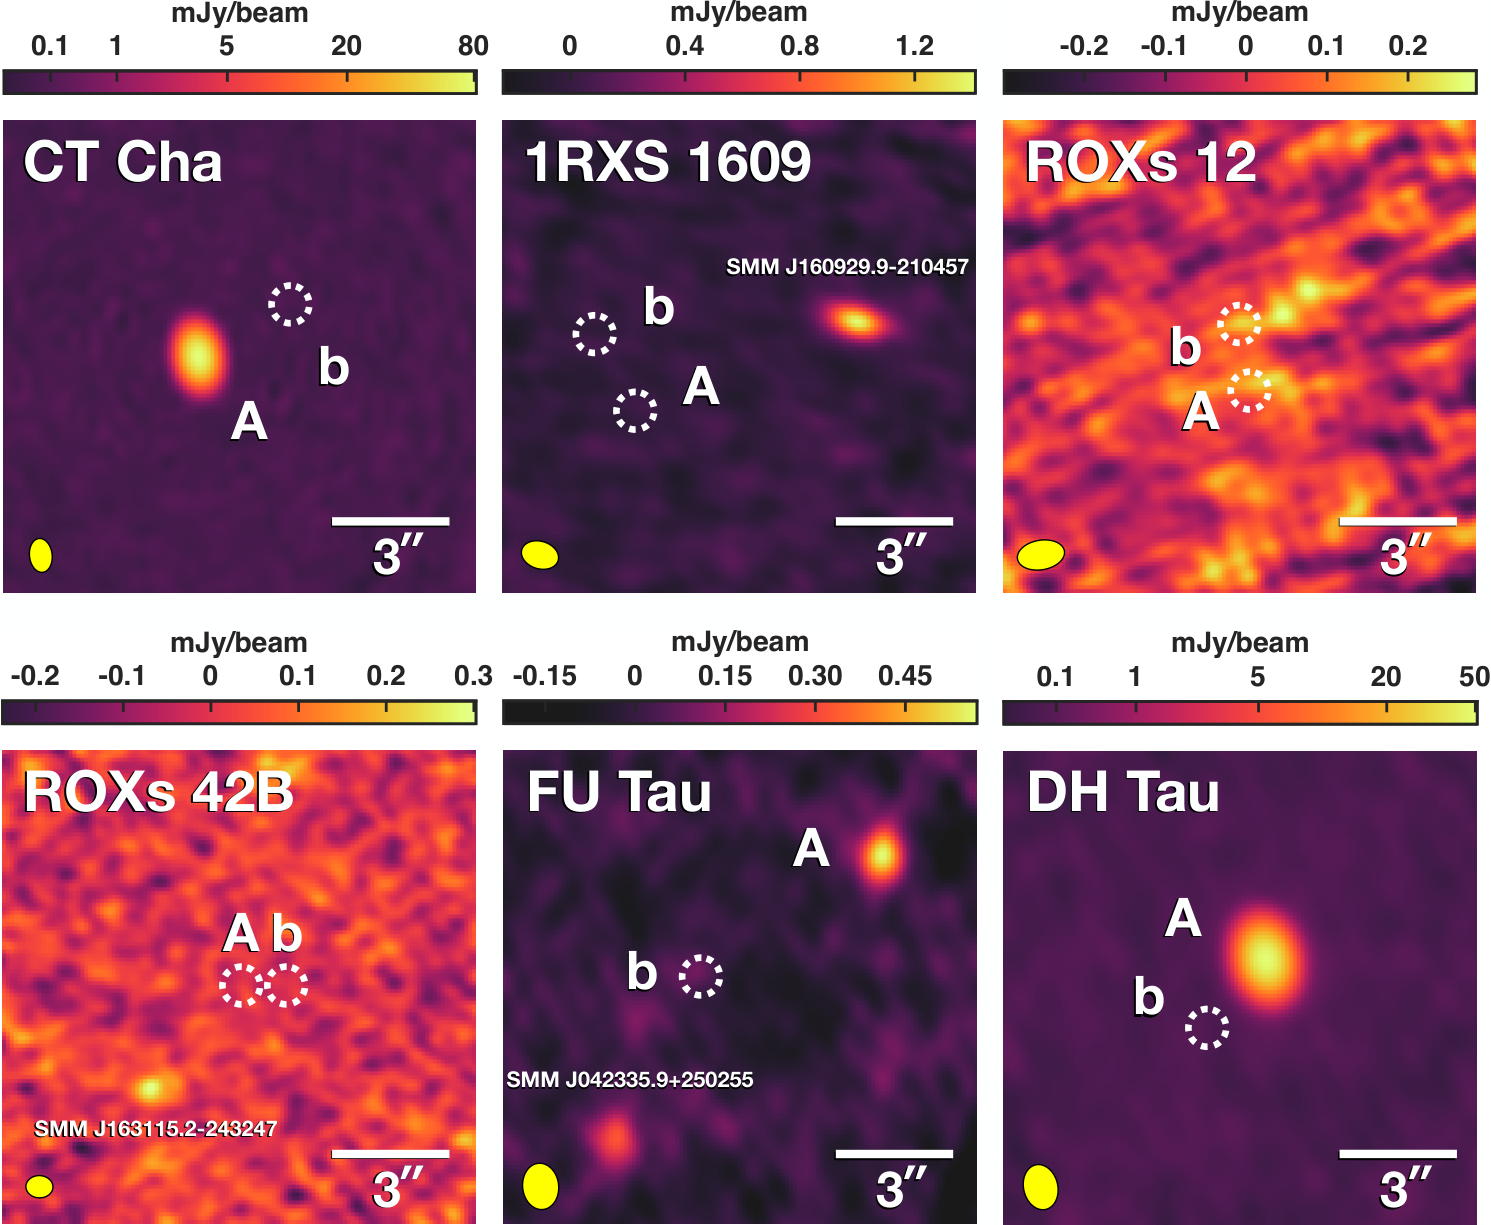
We observed these systems with three wideband 1.875 GHz windows centered at 333.80, 335.75, and 347.75 GHz to image dust continuum, and one 0.938 GHz window centered at 345.796 GHz, with a resolution of 0.488 MHz (0.423 km s-1; Hanning smoothed) to search for 12CO (3–2) emission (ALMA Cycle 4 program #2016.1.01018.S; PI: B. Bowler). The phase centers for all the observations except FU Tau are at the J2000.0 positions of the primary stars. For FU Tau, the phase center corresponds to the J2000.0 position of the companion because the binary separation is 57. We retrieved raw data sets from the ALMA archive and executed the calibration scripts with CASA (McMullin et al. 2007) versions 4.7.0 (for the data of CT Cha and 1RXS 1609), 4.7.2 (for ROXs 12 and ROXs 42B), and 5.1.1 (for DH Tau and FU Tau) to generate calibrated visibilities. We then applied phase and amplitude self-calibrations to the visibilities of the CT Cha and DH Tau since they had bright enough emission to improve upon the pipeline reduction. We first flagged CO emission and then employed five rounds of phase calibration, starting from a solution interval of 400 s and gradually decreasing to 30 s in subsequent iterations. We then carried out one round of amplitude calibration with a solution interval of 30 s. Self-calibration reduced the background rms by a factor of 9 for CT Cha and by a factor of 6 for DH Tau, while the flux densities of both stars only changed by 5%. Finally, we applied these phase and amplitude solutions to the original data sets in which CO was not flagged. We next used the CASA routine tclean with the multi-frequency synthesis mode and natural weighting to create the primary-beam-corrected continuum maps shown in Figure 1. For undetected sources (some primary stars and companions), the fluxes and rms uncertainties in Table 3 were first measured in the non-primary-beam-corrected images using apertures of the same areas as the beams, and then the values were divided by the primary beam response at the positions of the sources. We detect the disks of CT Cha A and DH Tau A in CO (3–2). A joint analysis with the CO (2–1) data in Sheehan et al. 2019 will be presented in a forthcoming paper. Table 1 summarizes the observations.
| PMC | Mass | Age | log() | PA | Region | Disk Markers | References | |||
|---|---|---|---|---|---|---|---|---|---|---|
| () | (Myr) | (K) | (pc) | (″) | (°) | |||||
| CT Cha b | 1–3 | 2.68 | 300.0 | Cha I | Pa, high | 1, 2, 3, 4 | ||||
| 1RXS 1609 b | 8–14 | 2.22 | 27.7 | Upper Sco | high , red – | 2, 3, 5, 6, 7 | ||||
| ROXs 12 b | 4–10 | 1.78 | 9.1 | Upper Sco | red – | 2, 3, 7, 8 | ||||
| ROXs 42B b | 1–3 | 1900 | 1.17 | 270.0 | Oph | 2, 3, 7, 9 | ||||
| DH Tau b | 1–3 | 2.35 | 139.4 | Taurus | H, Pa | 2, 3, 7, 10 | ||||
| FU Tau b | 1–3 | 2400 | 5.69 | 122.8 | Taurus | H, infrared excess | 2, 3, 11, 12 |
References. — (1) Wu et al. 2015a, (2) Bailer-Jones et al. 2018, (3) This work, (4) Schmidt et al. 2008, (5) Wu et al. 2015b, (6) Pecaut & Mamajek 2012, (7) Kraus et al. 2014, (8) Bowler et al. 2017, (9) Daemgen et al. 2017, (10) Bonnefoy et al. 2014, (11) Luhman et al. 2009, (12) Todorov et al. 2014.
3. Targets
In this section we briefly describe each system. To reduce systematics between literature values and incorporate the precise DR2 distances into the mass estimates, we calculated the companion mass by applying the bolometric correction in Filippazzo et al. 2015 to the dereddened -band absolute magnitude. Then the estimated bolometric luminosity was compared with the interpolated age-luminosity-mass grids from the models of Baraffe et al. 2015 in a Monte Carlo fashion. Table 2 lists the physical parameters and evidence of disks or mass accretion of these PMCs.
CT Cha is a late-K star in the 1–3 Myr Chamaeleon I star-forming region (Henize & Mendoza 1973; Lopez Martí et al. 2013). Its accretion disk was recently resolved in CO (2–1), enabling a dynamical mass measurement of (Sheehan et al. 2019). The companion CT Cha b at a separation of 268 (projected separation 511 AU) was discovered by Schmidt et al. 2008, and was found to harbor a disk based on the presence of Pa and Br lines as well as significant dust extinction (Schmidt et al. 2008; Lachapelle et al. 2015; Wu et al. 2015a), but the disk was undetected with ALMA at 1.3 mm (Wu et al. 2017b).
1RXS 1609 is a member of the Upper Scorpius star-forming region (Preibisch et al. 1998). The companion 1RXS 1609 b at a separation of 222 (309 AU) was discovered by Lafrenière et al. 2008. It may harbor a disk as inferred from the unresolved Spitzer 24 µm emission (Bailey et al. 2013), redder than young field dwarfs (Kraus et al. 2014), and some optical extinction (Wu et al. 2015b). However, the disk was also not detected with ALMA at 1.3 mm (Wu et al. 2017b).
ROXs 12 lies between the Ophiuchus and Upper Scorpius star-forming regions, with an estimated age of 6 Myr (Bowler et al. 2017). The companion ROXs 12 b at a separation of 178 (243 AU) was first identified as a candidate companion by Ratzka et al. 2005, and its common proper motion was later confirmed by Kraus et al. 2014. The red color of ROXs 12 b may result from a disk (Kraus et al. 2014). Bryan et al. 2016 found that the orbital motion of ROXs 12 b is consistent with low to moderate eccentricity. Bowler et al. 2017 recently identified a tertiary companion with a mass of 0.5 at a separation of 5100 AU. They also found that the spin axes of A and the tertiary, as well as the orbital axis of b, are likely misaligned. Sheehan et al. 2019 recently observed the tertiary with ALMA and derived a disk-based dynamical mass in good agreement with model-dependent mass estimates.
ROXs 42B is a likely member of the Ophiuchus star-forming region (Bouvier & Appenzeller 1992). The central stars ROXs 42B AB is a close binary separated by a few AU (Simon et al. 1995; Ratzka et al. 2005). The substellar companion ROXs 42B b at 117 (168 AU) from the binary was identified by Ratzka et al. 2005 and confirmed by Kraus et al. 2014. Its orbital motion was also detected by Bryan et al. 2016. Recently, Bryan et al. 2018 found that the spin rate of ROXs 42B b is well below the break-up velocity, possibly due to strong magnetic braking from the undetected accretion disks. The 3–5 µm photometry of the companion, however, did not reveal significant thermal excess from a disk (Daemgen et al. 2017).
DH Tau is an early-M star in the Taurus star-forming region (Herbig 1977). The companion DH Tau b at a separation of 235 (317 AU), discovered by Itoh et al. 2005, has H, Pa, and optical continuum excess indicative of an accretion rate of yr-1 (Bonnefoy et al. 2014; Zhou et al. 2014). However, the companion disk was not detected with either ALMA and NOEMA at 1.3 mm (Wu et al. 2017b; Wolff et al. 2017).
FU Tau is a young binary system likely in front of the Barnard 215 dark cloud (Barnard et al. 1927). The primary FU Tau A could be a low-mass star or a high-mass brown dwarf as its mass was estimated as 80 (Stelzer et al. 2013). Multi-wavelength tracers ranging from X-ray, optical spectroscopy, to 3 cm free-free emission have indicated that FU Tau A is actively accreting and may also have outflows (Stelzer et al. 2010; Stelzer et al. 2013; Rodríguez et al. 2017). The companion FU Tau b, 569 (747 AU) southeast of FU Tau A, was discovered by Luhman et al. 2009. It has strong infrared excess indicating the presence of a circum-substellar disk (Luhman et al. 2009). With the revised -band magnitude in Luhman et al. 2010, we estimate a mass of for FU Tau b.
| Object | (mJy) | |||
|---|---|---|---|---|
| CT Cha | 04m0900 | 76°27′193 | 94.0 | 9.4 |
| CT Cha b | 04m0834 | 76°27′180 | 0.019 | 0.052 |
| 1RXS 1609 | 09m3030 | 21°04′593 | 0.007 | 0.041 |
| 1RXS 1609 b | 09m3037 | 21°04′574 | 0.011 | 0.045 |
| ROXs 12 | 26m2803 | 25°26′482 | 0.078 | 0.070 |
| ROXs 12 b | 26m2805 | 25°26′464 | 0.098 | 0.071 |
| ROXs 42B | 31m1501 | 24°32′441 | 0.001 | 0.043 |
| ROXs 42B b | 31m1493 | 24°32′441 | 0.002 | 0.043 |
| DH Tau | 29m4156 | 26°32′577 | 52.3 | 5.2 |
| DH Tau b | 29m4168 | 26°32′560 | 0.017 | 0.041 |
| FU Tau | 23m3540 | 25°03′024 | 0.53 | 0.09 |
| FU Tau b | 23m3575 | 25°02′592 | 0.033 | 0.039 |
| SMM J042335.9250255 | 23m3591 | 25°02′552 | 0.40 | 0.09 |
| SMM J160929.9210457 | 09m2989 | 21°04′570 | 1.86 | 0.21 |
| SMM J163115.2243247 | 31m1518 | 24°32′467 | 0.42 | 0.10 |
Note. — The coordinates are derived for the epochs of ALMA observations (Table 1). Flux uncertainties of the detected sources include a 10% absolute flux calibration error.


4. Results
4.1. Continuum Emission: PMCs and Host Stars
As shown in Figure 1, we do not convincingly detect any PMC disks in 0.88 mm dust continuum (dashed circles labeled “b”). Table 3 lists the measured flux levels of PMCs. The 3 upper limits for the 0.88 mm flux density span 120–210 Jy assuming they are point sources. On the other hand, disks around the three host stars CT Cha A, DH Tau A, and FU Tau A are clearly seen. To our knowledge, this is the first millimeter detection of FU Tau A.
We use the software package pdspy (Sheehan et al. 2019) to fit an elliptical gaussian to the visibilities and derive 0.88 mm continuum fluxes of mJy, mJy, and mJy for CT Cha A, DH Tau A, and FU Tau A, respectively. Similar values were also obtained using the CASA task uvmodelfit when the primary beam response is accounted for. Flux errors are generally dominated by a 10% uncertainty in ALMA absolute flux calibration. Our results are consistent with previous 0.88 mm flux measurements of CT Cha A ( mJy; Pascucci et al. 2016) and DH Tau A ( mJy; Harris et al. 2012) at about 1 level. This discrepancy might simply arise from absolute flux calibration; free-free emission from ionized disk material is usually minor at 0.88 mm (e.g., Eisner et al. 2018).
Table 3 also lists the coordinates of the host stars and PMCs at the time of the ALMA observations as calculated from the DR2 coordinates, proper motions, position angles, and separations.
4.2. Continuum Emission: Background Objects
Several continuum sources in our maps seem to have no optical or infrared counterparts. Some of them could be dusty star-forming galaxies at high redshift, similar to the object spatially coincident with the debris disk of HD 95086 (Su et al. 2017). The object SMM J042335.9250255 at 23m3591 and 25°02′552, 10″ southeast of FU Tau A, has a 0.88 mm flux of mJy. The source SMM J163115.2243247 at 31m1518 and 24°32′467, 35 southeast of ROXs 42B, has a flux of mJy. It shares a similar PA of about 138° to the background near-infrared source identified by Bryan et al. 2016 but with a wider separation from ROXs 42B (35 versus 3″; see their Figure 1), an offset that cannot be accounted for by the star’s proper motion ( mas yr-1 and mas yr-1; Gaia Collaboration et al. 2018).
The bright source SMM J160929.9210457 at 09m2989 and 21°04′570, 6″ northwest of 1RXS 1609, was also detected in the 1.3 mm survey of Wu et al. 2017b. It has a flux density of mJy at 0.88 mm and mJy at 1.3 mm. The 1.3 mm flux density was derived using aperture photometry due to the irregular morphology, which made it difficult to reliably measure flux density using an elliptical gaussian fit. Interestingly, it appears resolved into west and east components at 1.3 mm (Figure 2), which could represent two star-forming regions within a galaxy, or perhaps a pair of merging galaxies. Indeed, given flux-dependent number densities of such galaxies at 0.88 mm (Casey et al. 2014), 2.5/ at 1.9 mJy and 25/ at 0.4 mJy, we would expect to detect 1 and 10 galaxies, respectively, for six ALMA pointings (assuming an 18″ primary beam).
4.3. CO Emission: Outflow from FU Tau A?
Figure 3 shows the channel maps of the FU Tau system in the LSRK velocity frame. CO emission is seen from 6–10 km s-1; however, it does not spatially coincide with either A or b. This suggests that it is probably not associated with both components, but is instead diffuse emission from the surrounding Barnard 215 dark cloud (Barnard et al. 1927). Although FU Tau A has active accretion, we do not find concrete evidence of gas emission from the disk in our data. The CO (2–1) emission detected by the IRAM-30m telescope (Monin et al. 2013) is probably from this cloud emission as well, rather than a molecular outflow from FU Tau A.
5. Discussion
5.1. Disk Flux-Host Mass Relationship
The dominant physical processes regulating the coevolution of planets and their environments may leave observable imprints on the bulk properties of disks. Disk-host scaling relationships, along with their age and stellar-mass dependences, therefore have important implications for the observed exoplanet population (e.g., Andrews et al. 2013; Ansdell et al. 2017; Pascucci et al. 2016; Barenfeld et al. 2016; Andrews et al. 2018). The behaviors of scaling relationships in the planet-mass regime provide clues about the physical properties of circumplanetary disks as well as the formation of satellites. Any deviations from the stellar relationships may imply that circumplanetary disks have different mass distributions, sizes, substructures, or evolutionary timescales. It may also imply that the coevolution of satellites and circumplanetary disks are not self-similar to that of planets and protoplanetary disks.
Here we investigate the behavior of the disk flux-host mass (–) relation toward the planetary-mass regime. We opt not to convert continuum emission to dust mass, as the observed millimeter spectral index of (e.g., Ribas et al. 2017) suggests that typical assumptions used to make the conversion (optically thin, opacity ; e.g., Beckwith et al. 1990) may be incorrect. Recent radiative transfer disk modeling also finds that dust emission is generally optically thick for circum(sub)stellar disks (e.g., Ballering & Eisner 2019; Rab et al. 2019). In addition, small disks are likely warmer and optically thicker than large disks; as a result, dust masses derived from the optically thin assumption may be underestimated by a factor of 1–5 (e.g., Ballering & Eisner 2019). Finally, Liu 2019 and Zhu et al. 2019 demonstrated that an optically thick disk may look optically thin due to dust scattering.
Figure 4 shows the – relationship at 0.88 mm for young (5 Myr; left panel) and older (5–20 Myr; right panel) systems. All the fluxes and upper limits in the figure have been scaled to a common distance of 140 pc via . PMC 3 limits at 0.88 mm are either from this survey or previous ALMA observations (200 Jy for GSC 6214-210 b, Bowler et al. 2015; 150 Jy for GQ Lup b, MacGregor et al. 2017; 78 Jy for 2M1207 b, Ricci et al. 2017). We also include the recent tentative detections of circumplanetary disks around PDS 70 b and c (Jy and Jy; Isella et al. 2019), with planet masses adopted from Keppler et al. 2018 and Haffert et al. 2019. Disk fluxes of stars and brown dwarfs are compiled from millimeter studies of star-forming regions, including Taurus (Andrews et al. 2013; Ricci et al. 2014; Ward-Duong et al. 2018), Chamaeleon I (Pascucci et al. 2016; Long et al. 2018), Lupus (Ansdell et al. 2016; Sanchis et al. 2020), and Upper Scorpius11 1 For the samples in Barenfeld et al. 2016, only the primordial disks were included in our analysis. (Barenfeld et al. 2016; van der Plas et al. 2016). Sources with no Gaia DR2 distances or that are clearly foreground/background objects are excluded. Stellar masses are adopted from the literature, but dynamical masses derived from the Keplerian rotation of gas are used when available (Sheehan et al. 2019; Simon et al. 2019).
To explore if PMC disks largely follow the overall trend for protoplanetary disks, we perform Bayesian linear regression to the stellar and brown dwarf disks (including non-detections) using the linmix package (Kelly 2007) and extrapolate the – relationship from stellar to planetary regime. The best-fit relations with and without the Gaussian-distributed intrinsic scatter terms are plotted as the dark and light shaded regions. In the left panel, the slope, intercept, and scatter of log() are , , and dex, respectively, where the uncertainties represent the 95% confidence intervals. We note that as shown in the Appendix and Figure 5, Taurus disks seem to have a shallower – relation than that of the Chamaeleon I and Lupus disks. However, it is not clear whether this is of astrophysical origin or simply because few disks with have been detected in Chamaeleon I and Lupus. The inhomogeneity of stellar mass determinations could also potentially affect our linear regression analysis (e.g., Ward-Duong et al. 2018), but we do not expect this to have a strong impact on our results. For the Upper Sco disks in the right panel, the slope, intercept, and scatter are , , and dex, consistent with Ansdell et al. 2017.
Figure 4 shows that young PMCs have distance-scaled 3 limits of 100–300 Jy at 0.88 mm. Given that the majority of these PMCs have evidence of disks or mass accretion, yet appear absent between the best-fit relation and the upper envelope in the stellar regime (represented by the 95% confidence interval of the intrinsic scatter), it remains a possibility that the (presumably) brightest PMC disks are in fact underluminous and may have different bulk properties from their stellar counterparts. More sensitive observations are needed to test this hypothesis. Alternatively, as individual disks in young binary systems of 300 AU separations have on average 5 times lower millimeter fluxes than that of single stars (e.g., Harris et al. 2012; Akeson et al. 2019), young PMC disks may instead be in agreement with the – relationship of binary stars. Deep ALMA continuum imaging with rms 10 Jy (5 hr on-source at 0.88 mm) will be needed to definitively test whether young PMC disks indeed deviate from the scaling relation of single stars.
In contrast, Barenfeld et al. 2019 recently showed that in the more evolved Upper Scorpius star-forming region (age 10 Myr; Pecaut & Mamajek 2012), the millimeter fluxes of disks around single and binary stars are statistically indistinguishable. This implies that binarity unlikely plays an important role in subsequent disk evolution, and single and binary stars may follow the same – relationship at ages of 5 Myr. Current ALMA observations, however, are not able to determine if older PMC disks are discrepant from the Upper Sco correlation (right panel of Figure 4). A sensitivity of Jy will be required, but this will be very challenging to achieve given the current capabilities of ALMA.
5.2. Implications
Non-detections from this survey as well as other programs have demonstrated that PMC disks appear faint in dust continuum emission. As the radial drift of dust grains around substellar objects can be much faster than around stars (e.g., Pinilla et al. 2013; Zhu et al. 2018), the dust disks of these companions are likely very compact and optically thick (e.g., Wu et al. 2017b; Rab et al. 2019). As optically thick emission scales with disk area, our 0.88 mm and 1.3 mm surveys imply that these dust disks have radii 0.5 AU (cf. Wu et al. 2017b). It is also possible that dust grains in PMC disks have been highly depleted due to this rapid inward drift. This could potentially hinder satellite formation unless there is a dust trap in the disk to form satellite seeds (e.g., Dra̧żkowska & Szulágyi 2018).
While a compact and/or dust-depleted disk is faint in radio continuum, Rab et al. 2019 find that the gas disk may still extend to 1/3 Hill radius, which is the characteristic scale of companion disks under dynamical interaction (e.g., Ayliffe & Bate 2009) and is typically 10 AU for wide-orbit PMCs at hundreds of AU from their hosts. The synthetic observations in Rab et al. 2019 further show that such a large gas-rich disk can be detected by ALMA with 5 hr on-source time in Bands 6 and 7. PMC disks may therefore exhibit both extremely high gas-to-dust mass and size ratios due to a combination of tidal truncation, fast radial drift, and/or a lack of dust traps. As a comparison, for the Lupus circumstellar disks the mass ratio is mostly 1–10 (Miotello et al. 2017), and the size ratio is 2 on average (Ansdell et al. 2018).
Interestingly, free-floating planetary-mass objects, which might have formed like single stars, may be able to retain larger and brighter dust disks. For instance, the isolated 13 object OTS 44 has a 1.3 mm flux of 100 Jy (Bayo et al. 2017), which translates to 230 Jy at 0.88 mm with a spectral index of 2.2. This implies that radial drift timescale is intrinsically longer than that of PMC disks, or there are disk substructures to trap dust grains at a wider radius. Future sensitive ALMA observations can examine if free-floating planets, as a population, also follow the stellar – relationship.
The slope of the – relation may be sensitive to the adopted distances and stellar masses, or it may even vary between star-forming regions of similar ages. It is also not clear that if the relation would change in the substellar regime. In Figure 5 we show the individual relationships in Taurus, Chamaeleon I, and Lupus. Our fitted slopes are similar to that of the – relation in previous studies (e.g., Ansdell et al. 2017; Long et al. 2018). We note that the Taurus slope becomes steeper, from to , when excluding objects with masses less than 0.1 . Future brown dwarf studies in Chamaeleon I and Lupus can help determine whether the mean – relation flattens out at substellar masses, or if Taurus has an intrinsically distinct relation.
References
- Akeson et al. (2019) Akeson, R. L., Jensen, E. L. N., Carpenter, J., et al. 2019, ApJ, 872, 158
- Andrews et al. (2013) Andrews, S. M., Rosenfeld, K. A., Kraus, A. L., & Wilner, D. J. 2013, ApJ, 771, 129
- Andrews et al. (2018) Andrews, S. M., Terrell, M., Tripathi, A., et al. 2018, ApJ, 865, 157
- Ansdell et al. (2017) Ansdell, M., Williams, J. P., Manara, C. F., et al. 2017, AJ, 153, 240
- Ansdell et al. (2018) Ansdell, M., Williams, J. P., Trapman, L., et al. 2018, ApJ, 859, 21
- Ansdell et al. (2016) Ansdell, M., Williams, J. P., van der Marel, N., et al. 2016, ApJ, 828, 46
- Ayliffe & Bate (2009) Ayliffe, B. A., & Bate, M. R. 2009, MNRAS, 397, 657
- Bailer-Jones et al. (2018) Bailer-Jones, C. A. L., Rybizki, J., Fouesneau, M., et al. 2018, AJ, 156, 58
- Bailey et al. (2013) Bailey, V., Hinz, P. M., Currie, T., et al. 2013, ApJ, 767, 31
- Ballering & Eisner (2019) Ballering, N. P., & Eisner, J. A. 2019, AJ, 157, 144
- Baraffe et al. (2015) Baraffe, I., Homeier, D., Allard, F., & Chabrier, G. 2015, A&A, 577, A42
- Barenfeld et al. (2016) Barenfeld, S. A., Carpenter, J. M., Ricci, L., & Isella, A. 2016, ApJ, 827, 142
- Barenfeld et al. (2019) Barenfeld, S. A., Carpenter, J. M., Sargent, A. I., et al. 2019, ApJ, 878, 45
- Barnard et al. (1927) Barnard, E. E., Frost, E. B., & Calvert, M. R. 1927, A Photographic Atlas of Selected Regions of the Milky Way (Washington, DC: Carnegie Inst.)
- Batygin (2018) Batygin, K. 2018, AJ, 155, 178
- Bayo et al. (2017) Bayo, A., Joergens, V., Liu, Y., et al. 2017, ApJ, 841, L11
- Beckwith et al. (1990) Beckwith, S. V. W., Sargent, A. I., Chini, R. S., & Guesten, R. 1990, AJ, 99, 924
- Bonnefoy et al. (2014) Bonnefoy, M., Chauvin, G., Lagrange, A.-M., et al. 2014, A&A, 562, A127
- Bouvier & Appenzeller (1992) Bouvier, J., & Appenzeller, I. 1992, A&AS, 92, 481
- Bowler et al. (2015) Bowler, B. P., Andrews, S. M., Kraus, A. L., et al. 2015, ApJ, 805, L17
- Bowler et al. (2017) Bowler, B. P., Kraus, A. L., Bryan, M. L., et al. 2017, AJ, 154, 165
- Bowler et al. (2014) Bowler, B. P., Liu, M. C., Kraus, A. L., & Mann, A. W. 2014, ApJ, 784, 65
- Bowler et al. (2011) Bowler, B. P., Liu, M. C., Kraus, A. L., Mann, A. W., & Ireland, M. J. 2011, ApJ, 743, 148
- Bryan et al. (2018) Bryan, M. L., Benneke, B., Knutson, H. A., et al. 2018, Nature Astronomy, 2, 138
- Bryan et al. (2016) Bryan, M. L., Bowler, B. P., Knutson, H. A., et al. 2016, ApJ, 827, 100
- Casey et al. (2014) Casey C. M., Narayanan D., & Cooray A., 2014, Phys. Rep., 541, 45
- Choi et al. (2016) Choi, J., Dotter, A., Conroy, C., et al. 2016, ApJ, 823, 102
- Daemgen et al. (2017) Daemgen, S., Todorov, K., Silva, J., et al. 2017, A&A, 601, A65
- Dra̧żkowska & Szulágyi (2018) Dra̧żkowska, J. & Szulágyi, J. 2018, ApJ, 866, 142
- Eisner (2015) Eisner, J. A. 2015, ApJ, 803, L4
- Eisner et al. (2018) Eisner, J. A., Arce, H. G., Ballering, N. P., et al. 2018, ApJ, 860, 77
- Filippazzo et al. (2015) Filippazzo, J. C., Rice, E. L., Faherty, J., et al. 2015, ApJ, 810, 158
- Gaia Collaboration et al. (2018) Gaia Collaboration, Brown, A. G. A., Vallenari, A., et al. 2018, A&A, 616, A1
- Ginski et al. (2018) Ginski, C., Benisty, M., van Holstein, R. G., et al. 2018, A&A, 616, A79
- Haffert et al. (2019) Haffert, S. Y., Bohn, A. J., de Boer, J., et al. 2019, Nature Astronomy, 3, 749
- Harris et al. (2012) Harris, R. J., Andrews, S. M., Wilner, D. J., et al. 2012, ApJ, 751, 115
- Henize & Mendoza (1973) Henize, K. G., & Mendoza, E. E. 1973, ApJ, 180, 115
- Herbig (1977) Herbig, G. H. 1977, ApJ, 214, 747
- Isella et al. (2019) Isella, A., Benisty, M., Teague, R., et al. 2019, ApJ, 879, L25
- Itoh et al. (2005) Itoh, Y., Hayashi, M., Tamura, M., et al. 2005, ApJ, 620, 984
- Kelly (2007) Kelly, B. C. 2007, ApJ, 665, 1489
- Keppler et al. (2018) Keppler, M., Benisty, M., Müller, A., et al. 2018, A&A, 617, A44
- Kratter et al. (2010) Kratter, K. M., Murray-Clay, R. A., & Youdin, A. N. 2010, ApJ, 710, 1375
- Kraus et al. (2014) Kraus, A. L., Ireland, M. J., Cieza, L. A., et al. 2014, ApJ, 781, 20
- Lachapelle et al. (2015) Lachapelle, F.-R., Lafrenière, D., Gagné, J., et al. 2015, ApJ, 802, 61
- Lafrenière et al. (2008) Lafrenière, D., Jayawardhana, R., & van Kerkwijk, M. H. 2008, ApJ, 689, L153
- Liu (2019) Liu, H. B. 2019, ApJ, 877, L22
- Long et al. (2018) Long, F., Herczeg, G. J., Pascucci, I., et al. 2018, ApJ, 863, 61
- Lopez Martí et al. (2013) Lopez Martí, B., Jimenez Esteban, F., Bayo, A., et al. 2013, A&A, 551, A46
- Low & Lynden-Bell (1976) Low, C., & Lynden-Bell, D. 1976, MNRAS, 176, 367
- Luhman et al. (2010) Luhman, K. L., Mamajek, E. E., Allen, P. R., et al. 2010, ApJ, 720, 1781
- Luhman et al. (2009) Luhman, K. L., Mamajek, E. E., Allen, P. R., Muench, A. A., & Finkbeiner, D. P. 2009, ApJ, 691, 1265
- MacGregor et al. (2017) MacGregor, M. A., Wilner, D. J., Czekala, I., et al. 2017, ApJ, 835, 17
- McMullin et al. (2007) McMullin, J. P., Waters, B., Schiebel, D., Young, W., & Golap, K. 2007, adass XVI, 376, 127
- Miotello et al. (2017) Miotello, A., van Dishoeck, E. F., Williams, J. P., et al. 2017, A&A, 599, A113
- Monin et al. (2013) Monin, J.-L., Whelan, E. T., Lefloch, B., et al. 2013, A&A, 551, L1
- Nielsen et al. (2019) Nielsen, E. L., De Rosa, R. J., Macintosh, B., et al. 2019, AJ, 158, 13
- Pascucci et al. (2016) Pascucci, I., Testi, L., Herczeg, G. J., et al. 2016, ApJ, 831, 125
- Pearce et al. (2019) Pearce, L. A., Kraus, A. L., Dupuy, T. J., et al. 2019, AJ, 157, 71
- Pecaut & Mamajek (2013) Pecaut, M. J., & Mamajek, E. E. 2013, ApJS, 208, 9
- Pecaut & Mamajek (2012) Pecaut, M. J., Mamajek, E. E., & Bubar, E. J. 2012, ApJ, 746, 154
- Pérez et al. (2019) Pérez, S., Marino, S., Casassus, S., et al. 2019, MNRAS, 488, 1005
- Pinilla et al. (2013) Pinilla, P., Birnstiel, T., Benisty, M., et al. 2013, A&A, 554, A95
- Preibisch et al. (1998) Preibisch, T., Guenther, E., Zinnecker, H., et al. 1998, A&A, 333, 619
- Rab et al. (2019) Rab, C., Kamp, I., Ginski, C., et al. 2019, A&A, 624, A16
- Ratzka et al. (2005) Ratzka, T., Köhler, R., & Leinert, C. 2005, A&A, 437, 611
- Ribas et al. (2017) Ribas, Á., Espaillat, C. C., Macías, E., et al. 2017, ApJ, 849, 63
- Ricci et al. (2017) Ricci, L., Cazzoletti, P., Czekala, I., et al. 2017, AJ, 154, 24
- Ricci et al. (2014) Ricci, L., Testi, L., Natta, A., et al. 2014, ApJ, 791, 20
- Rodríguez et al. (2017) Rodríguez, L. F., Zapata, L. A., & Palau, A. 2017, AJ, 153, 209
- Sanchis et al. (2020) Sanchis, E., Testi, L., Natta, A., et al. 2020, A&A, 633, A114
- Santamaría-Miranda et al. (2018) Santamaría-Miranda, A., Cáceres, C., Schreiber, M. R., et al. 2018, MNRAS, 475, 2994
- Schmidt et al. (2008) Schmidt, T. O. B., Neuhäuser, R., Seifahrt, A., et al. 2008, A&A, 491, 311
- Sheehan et al. (2019) Sheehan, P. D., Wu, Y.-L., Eisner, J. A., & Tobin, J. 2019, ApJ, 874, 136
- Simon et al. (1995) Simon, M., Ghez, A. M., Leinert, C., et al. 1995, ApJ, 443, 625
- Simon et al. (2019) Simon, M., Guilloteau, S., Beck, T. L., et al. 2019, ApJ, 884, 42
- Stamatellos & Herczeg (2015) Stamatellos, D. & Herczeg, G. J. 2015, MNRAS, 449, 3432
- Stelzer et al. (2010) Stelzer, B., Scholz, A., Argiroffi, C., et al. 2010, MNRAS, 408, 1095
- Stelzer et al. (2013) Stelzer, B., Alcalá, J. M., Scholz. A., et al. 2013, A&A, 551, A106
- Su et al. (2017) Su, K. Y. L., MacGregor, M. A., Booth, M., et al. 2017, AJ, 154, 225
- Szulágyi et al. (2017) Szulágyi, J., Mayer, L., & Quinn, T. 2017, MNRAS, 464, 3158
- Szulágyi & Mordasini (2017) Szulágyi, J., & Mordasini, C. 2017, MNRAS, 465, L64
- Szulágyi et al. (2018b) Szulágyi, J., Cilibrasi, M., & Mayer, L. 2018b, ApJ, 868, L13
- Szulágyi et al. (2018a) Szulágyi, J., Plas, G. van . der ., Meyer, M. R., et al. 2018a, MNRAS, 473, 3573
- Testi et al. (2016) Testi, L., Natta, A., Scholz, A., et al. 2016, A&A, 593, A111
- Todorov et al. (2014) Todorov, K. O., Luhman, K. L., Konopacky, Q. M., et al. 2014, ApJ, 788, 40
- van der Plas et al. (2016) van der Plas, G., Ménard, F., Ward-Duong, K., et al. 2016, ApJ, 819, 102
- Wagner et al. (2019) Wagner, K., Apai, D., & Kratter, K. M. 2019, ApJ, 877, 46
- Ward-Duong et al. (2018) Ward-Duong, K., Patience, J., Bulger, J., et al. 2018, AJ, 155, 54
- Wolff et al. (2017) Wolff, S. G., Ménard, F., Caceres. C., et al. 2017, AJ, 154, 26
- Wu et al. (2015a) Wu, Y.-L., Close, L. M., Males, J. R., et al. 2015a, ApJ, 801, 4
- Wu et al. (2015b) Wu, Y.-L., Close, L. M., Males, J. R., et al. 2015b, ApJ, 807, L13
- Wu et al. (2017a) Wu, Y.-L., Sheehan, P. D., Males, J. R., et al. 2017a, ApJ, 836, 223
- Wu et al. (2017b) Wu, Y.-L., Close, L. M., Eisner, J. A., & Sheehan, P. D. 2017b, AJ, 154, 234
- Zhou et al. (2014) Zhou, Y., Herczeg, G. J., Kraus, A. L., Metchev, S., & Cruz, K. L. 2014, ApJ, 783, L17
- Zhu (2015) Zhu, Z. 2015, ApJ, 799, 16
- Zhu et al. (2016) Zhu, Z., Ju, W., & Stone, J. M. 2016, ApJ, 832, 193
- Zhu et al. (2018) Zhu, Z., Andrews, S. M., & Isella, A. 2018, MNRAS, 479, 1850
- Zhu et al. (2019) Zhu, Z., Zhang, S., Jiang, Y.-F., et al. 2019, ApJ, 877, L18