The Low Earth Orbit Satellite Population and Impacts of the SpaceX Starlink ConstellationJournal: ApJL
Abstract
I discuss the current low Earth orbit artificial satellite population and show that the proposed ‘megaconstellation’ of circa 12,000 Starlink internet satellites would dominate the lower part of Earth orbit, below 600 km, with a latitude-dependent areal number density of between 0.005 and 0.01 objects per square degree at airmass . Such large, low altitude satellites appear visually bright to ground observers, and the initial Starlinks are naked eye objects. I model the expected number of illuminated satellites as a function of latitude, time of year, and time of night and summarize the range of possible consequences for ground-based astronomy. In winter at lower latitudes typical of major observatories, the satellites will not be illuminated for six hours in the middle of the night. However, at low elevations near twilight at intermediate latitudes (45-55 deg, e.g. much of Europe) hundreds of satellites may be visible at once to naked-eye observers at dark sites.
Keywords:
artificial satellites — night sky brightness — astronomical site protection — ground-based astronomyApJ 892, L36
I Introduction
On 2019 May 24, the US company SpaceX launched the first batch of sixty prototype Starlink Internet-distribution satellites into a 430 km circular Earth orbit. Within hours, amateur and professional astronomers expressed surprise and concern at the brightness of the slowly dispersing string of satellites, with most reports suggesting a magnitude of to for each satellite (King 2019). Over the next few days, the satellites faded by several magnitudes as they adjusted the orientation of their solar panels, and lost a further 0.5 mag as their orbits were raised to their operational height of 550 km, but nevertheless remained naked eye objects from dark sites. In this paper, by ‘naked-eye’ I will mean a visual magnitude of 6 or brighter, which is a reasonable approximation for detectability in dark skies. Objects of magnitude 4 or brighter are easily noticeable under such conditions. The Starlink satellites, as shown below, typically lie between these values.
Since the early space age, satellite tracks have been a constant but relatively minor annoyance to ground-based observers. An early discussion arose from a 1980 COSPAR panel on ‘Potentially Environmentally Detrimental Activities in Space’ (PEDAS). The PEDAS reports were published in a special issue of Advances in Space Research; Eberst 1982 said ‘At present the effect of satellite trails appearing on Schmidt plates is more of a nuisance than a problem’, with a total of 4643 tracked and mostly faint objects in orbit at the time. However, F. Graham Smith 1982, shortly before becoming the Astronomer Royal, concluded ‘the cumulative effect of an increasing number of long-lived satellites represents a very serious hazard [to optical observation].’ That prediction is now coming true with the prospect of tens of thousands of orbiting objects bright enough to be visible to the naked eye.
A first attempt to simulate these effects for the first phase of the Starlink constellation was presented by Seitzer 2020. In this paper I present similar calculations for the currently approved full constellation, and describe the current demographics of the low Earth orbit (LEO) satellite population, which Starlink is starting to transform and dominate.
Several other companies in the United States, Europe and China have proposed similar ‘megaconstellations’ of thousands to tens of thousands of satellites. Many of these are for telecommunications, but Earth imaging systems have also been suggested. Of the near-term proposals, Starlink is the one with the greatest expected light-pollution impact and is the first to be extensively deployed.
The Starlink satellites are 260 kg in mass and consist of a flat panel about 3 metres across on which communications antennae and propulsion systems are mounted, together with a solar panel at right angles to the main bus that is about 9 metres long. At zenith, at the 550 km altitude of the initial constellation layer, they will therefore subtend an angle of between and depending on orientation.
II The Low Earth Orbit satellite population
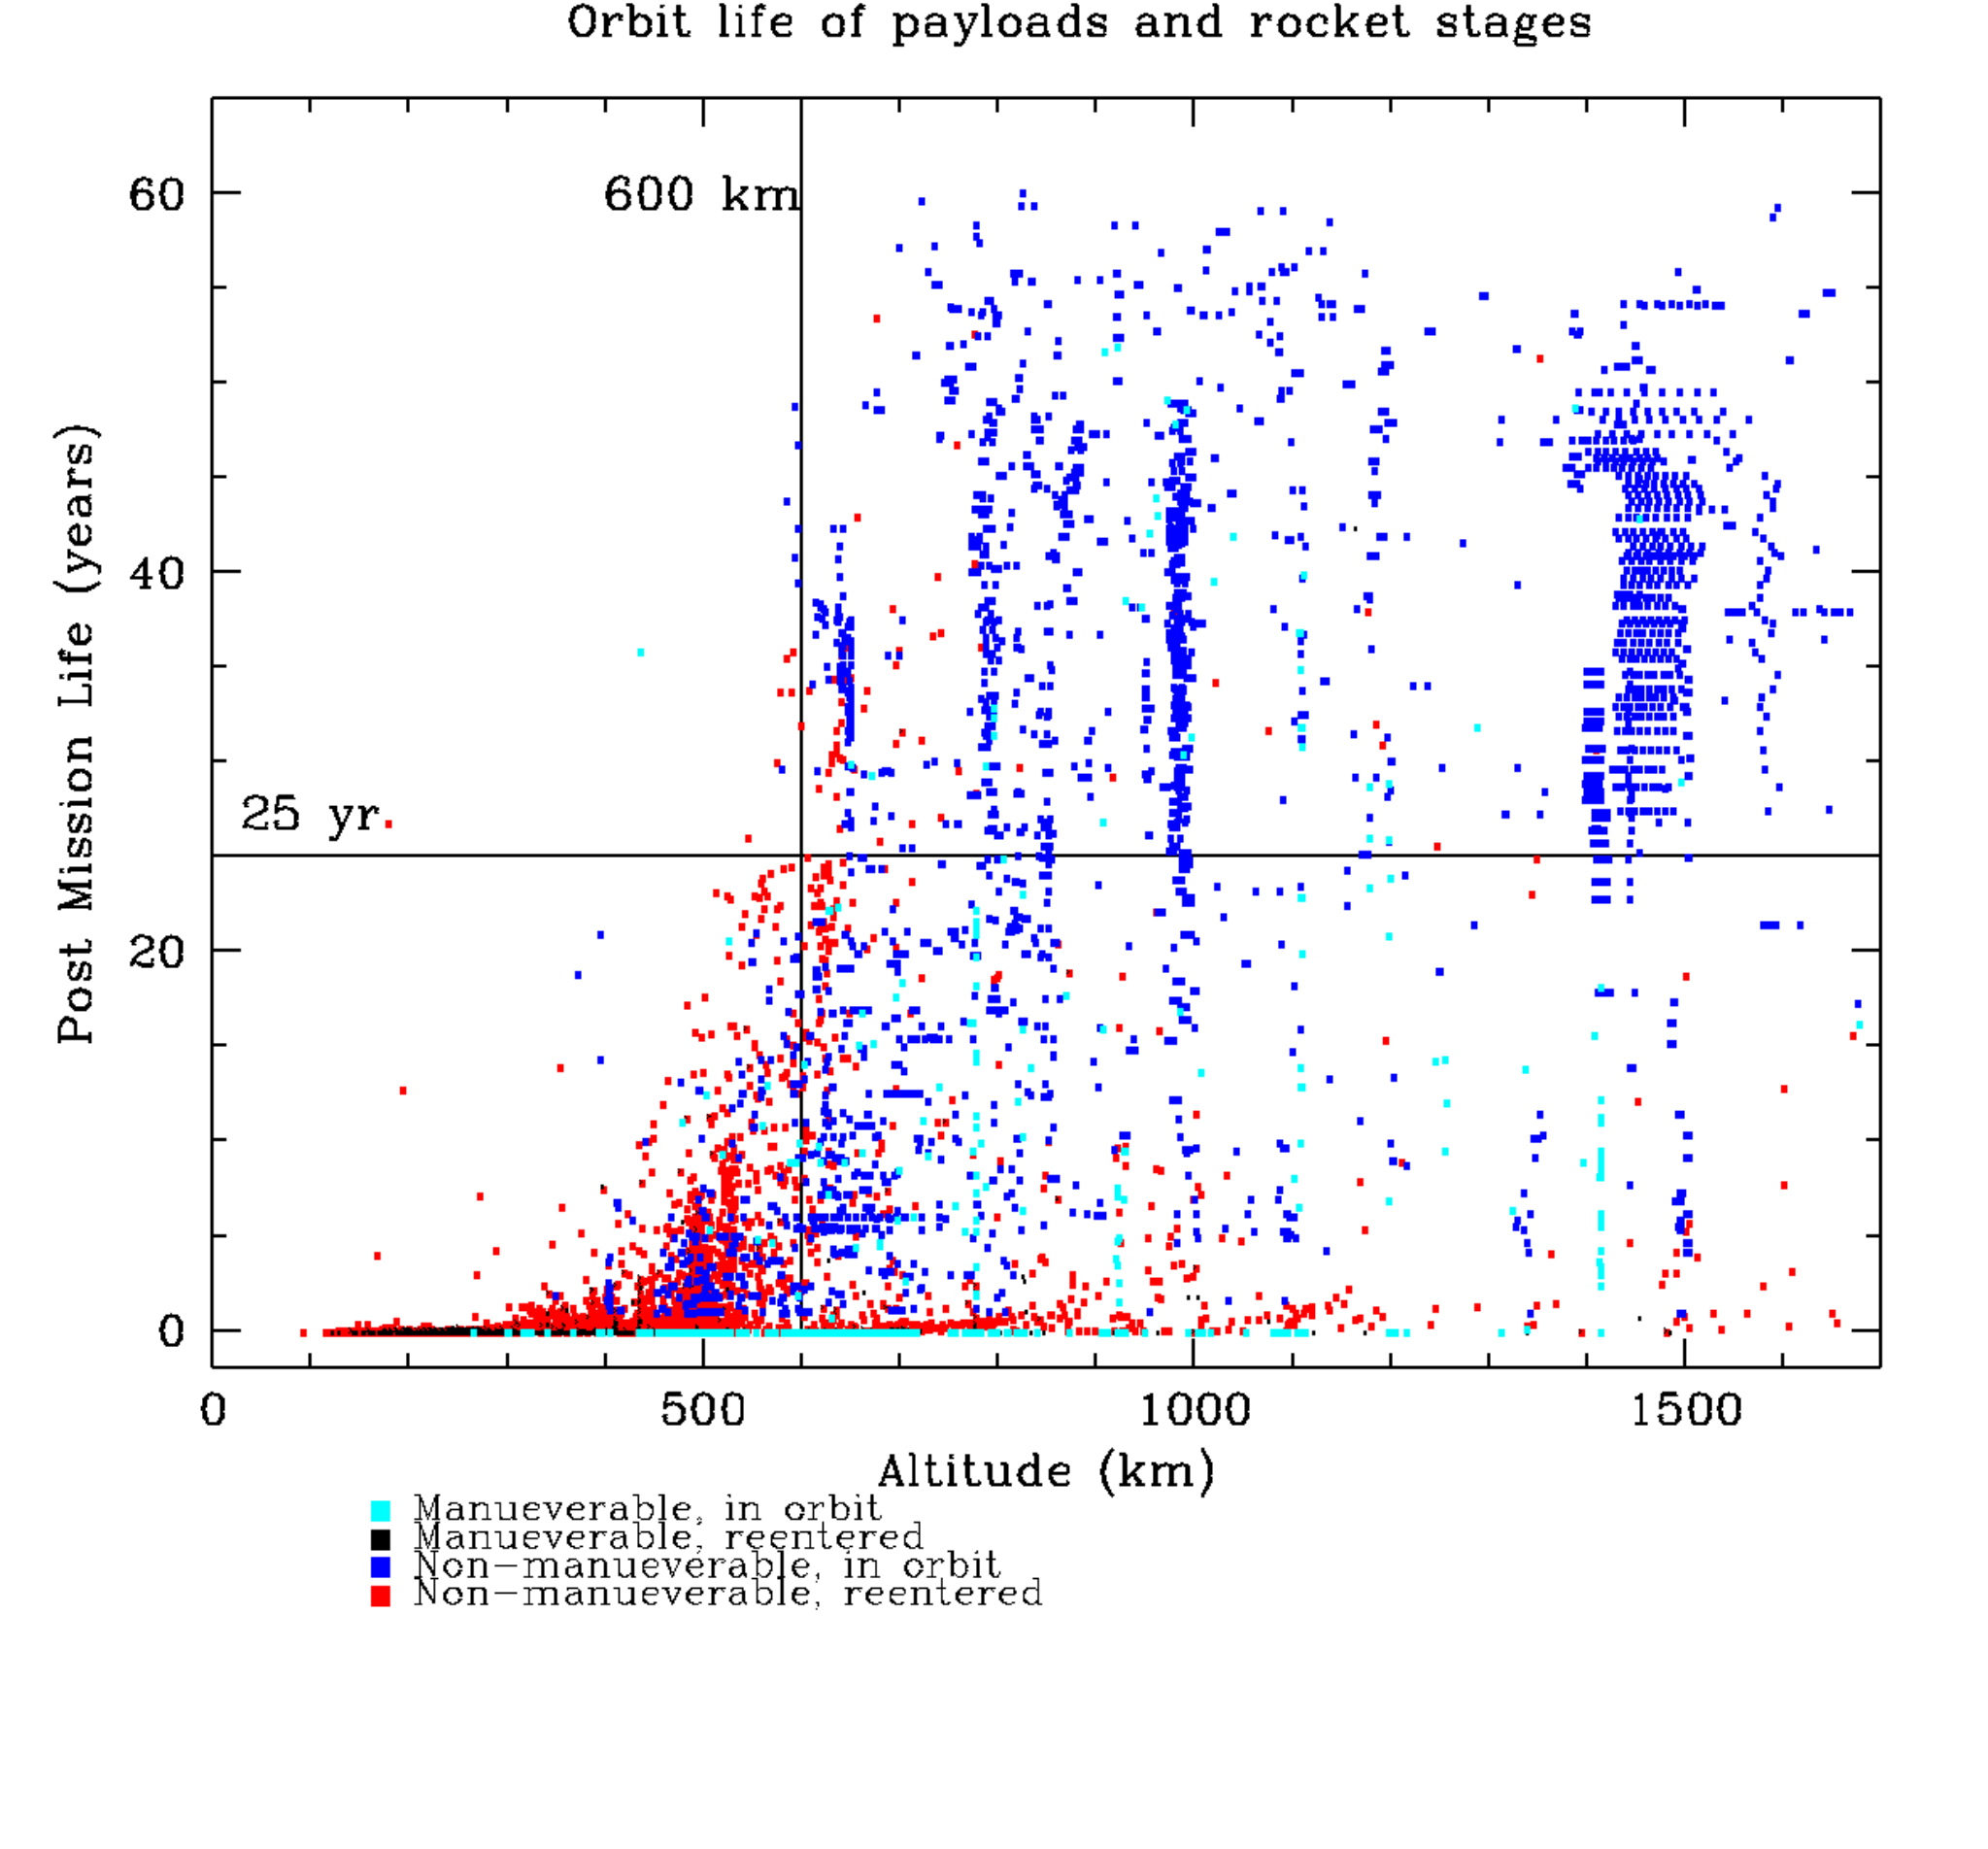
Low Earth Orbit (LEO) is generally considered to extend from around 80–100 km (below which satellites cannot remain in orbit, McDowell 2018) to about 2000 km (above which the intensity of the trapped radiation belts make it more difficult for satellites to operate, IADC 2007). To avoid collisional runaway (Kessler & Cour-Palais 1978), current recommendations advocate that space objects be removed from LEO within 25 years of the end of operations (IADC 2007). Below about 600 km, the effects of atmospheric drag will ensure satellite reentry on this timescale for most satellites, without the need for any special action.
As an indirect result of these different lifetimes, the satellite populations in lower LEO (100–600 km) and upper LEO (600–2000 km) are qualitatively different.
I have analyzed the US catalog of space objects (United States Space Force 2020), extracted orbital data for all tracked objects, and categorized each object as described below. The 600 km dichotomy can be seen in Figure 1, where I plot the post-mission life of payloads and rocket stages in LEO from 1957 to the beginning of 2020, generated from a database of Earth satellites I maintain. The post-mission life is calculated from the end of active operations of the object until its reentry or until the present. The active life of payloads was determined by review of mission documents and public sources as well as analysis of orbital maneuvers. Maneuvering satellites are plotted in cyan (objects still in orbit) and magenta (object which have reentered) while non-maneuvering satellites are plotted in blue (objects still in orbit) and red (objects which have reentered). It can be seen that the upper left quadrant defined by the black lines (objects in orbits below 600 km which are more than 25 years past their end of mission) is almost empty.
In Figs. 2 and 3 I illustrate the evolution of the LEO artificial satellite population between 2005 and 2020, separately for upper and lower LEO and for big (mass above 100 kg) and small (below 100 kg) objects. The population is divided into nine categories, color-coded in the figures as noted: (1) Starlink satellites (cyan; right panel in Fig 3).; (2) other active payloads (red), (3) ‘alternative’ payloads, or ‘special cases’ (a small category of objects for which payload versus component status is arguable; brown; (4) dead (no longer operating) payloads (black); (5) discarded rocket stages (magenta); (6) inert parts or components, such as launch vehicle adapters, optics covers, and despin systems (orange); (7) debris from accidents such as collisions, propellant system explosions or battery explosions, or from deliberate events such as space weapons tests, excepting the next two categories (light green); (8) debris from the Chinese space weapons test of 2007 (black); (9) debris from the accidental Iridium-Cosmos collision of 2009 (yellow).
In Table 1 I summarize the state of the orbital population on 2020 March 1.
| Upper LEO ( km) | Lower LEO ( km) | |||
| Small | Big | Small | Big | |
| ( kg) | ( kg) | ( kg) | ( kg) | |
| Starlink | 0 | 0 | 0 | 299 |
| Active payloads (excluding Starlink) | 229 | 465 | 731 | 243 |
| Special cases | 2 | 3 | 0 | 0 |
| Dead payloads | 667 | 887 | 60 | 58 |
| Rocket stages | 62 | 734 | 16 | 78 |
| Inert parts | 899 | 24 | 124 | 10 |
| Debris (general) | 5041 | 2 | 62 | 0 |
| Debris (2009 collision) | 1382 | 0 | 3 | 0 |
| Debris (2007 test) | 2801 | 0 | 2 | 0 |
| Total | 11083 | 2115 | 998 | 688 |
Note. The division between lower and upper LEO is set at 600 km; the division between big and small satellites is set at 100 kg. Note the significant contribution of Starlink satellites to the big/low category.
Figure 2 shows that the evolution of the population in the higher part of LEO is relatively gradual. The small object population is dominated by debris objects, and the main changes are sudden increases caused by individual debris events such as the 2007 Chinese test and the 2009 collision. The large object population is dominated by dead payloads and discarded rocket stages. In contrast, the lower part of LEO characterized in Figure 3 is quite different. The total number of objects is lower, and since 2016 the small object population has been dominated by a rapidly increasing number of active payloads – the cubesats. The large object population was similar to higher altitudes, but since 2019 shows a dramatic increase in the population due to the Starlink launches.
On 2019 May 27, after the first Starlink launch, SpaceX founder Elon Musk noted 11 1 https://twitter.com/elonmusk/status/1132897322457636864 that ‘there are already 4900 satellites in orbit … Starlink won’t be seen by anyone unless looking very carefully and will have impact on advancements in astronomy.’ This is a rather misleading statement, as satellites are normally only naked-eye if they are both large and in the lowest orbits, i.e. those in the right hand panel in Fig 3. As the figure shows, fewer than 400 objects were in that category prior to the first Starlink launch. Starlink satellites are already in the majority in this category following the sixth launch which took place on 2020 March 18. In the near future, with 1584 Starlinks in the 550 km orbit in the initial constellation and ultimately as many as 9000 in that regime with all proposed deployments (as discussed in the next section), Starlink will completely dominate the naked-eye object population by factors of 4 to 20.


III Model of the Starlink constellation
The initial constellation of 1584 satellites approved by the US Federal Communications Commission (SpaceX 2016) and modelled by Seitzer 2020 has been superseded. Further FCC filings extend the proposed constellation to about 12,000 satellites (SpaceX 2017), (SpaceX 2019). Filings under the USASAT-NGSO-3 label with the International Telecommunications Union (ITU) in 2019 October suggest as many as 30,000 satellites are envisaged, but in this paper I will restrict myself to the 12,000 satellite case. The filed orbital properties of the constellation are summarized in Table 2, where I group the eight shells specified by SpaceX into three similar-altitude layers useful for summary analysis. Only layer A satellites are currently being deployed, with proposed layers B and C expected several years from now. Satellites in layers A and B will be grouped in separate orbital planes distinguished by their longitude of ascending node.
| Layer | Shell | Altitude | Inclination | Planes | Satellites |
|---|---|---|---|---|---|
| (km) | (deg) | ||||
| A | 1 | 550 | 53.0 | 72 | 1584 |
| B | 2 | 1110 | 53.8 | 32 | 1600 |
| B | 3 | 1130 | 74.0 | 8 | 400 |
| B | 4 | 1275 | 81.0 | 5 | 375 |
| B | 5 | 1325 | 70.0 | 6 | 450 |
| C | 6 | 346 | 53.0 | 2547 | |
| C | 7 | 341 | 48.0 | 2478 | |
| C | 8 | 336 | 42.0 | 2493 |
Note: Total satellites 11927 (1584 in layer A, 2825 in layer B and 7518 in layer C). Layer C satellites are not grouped in orbital planes. Total satellites below 600 km (layers A and C only) will therefore be 9102.
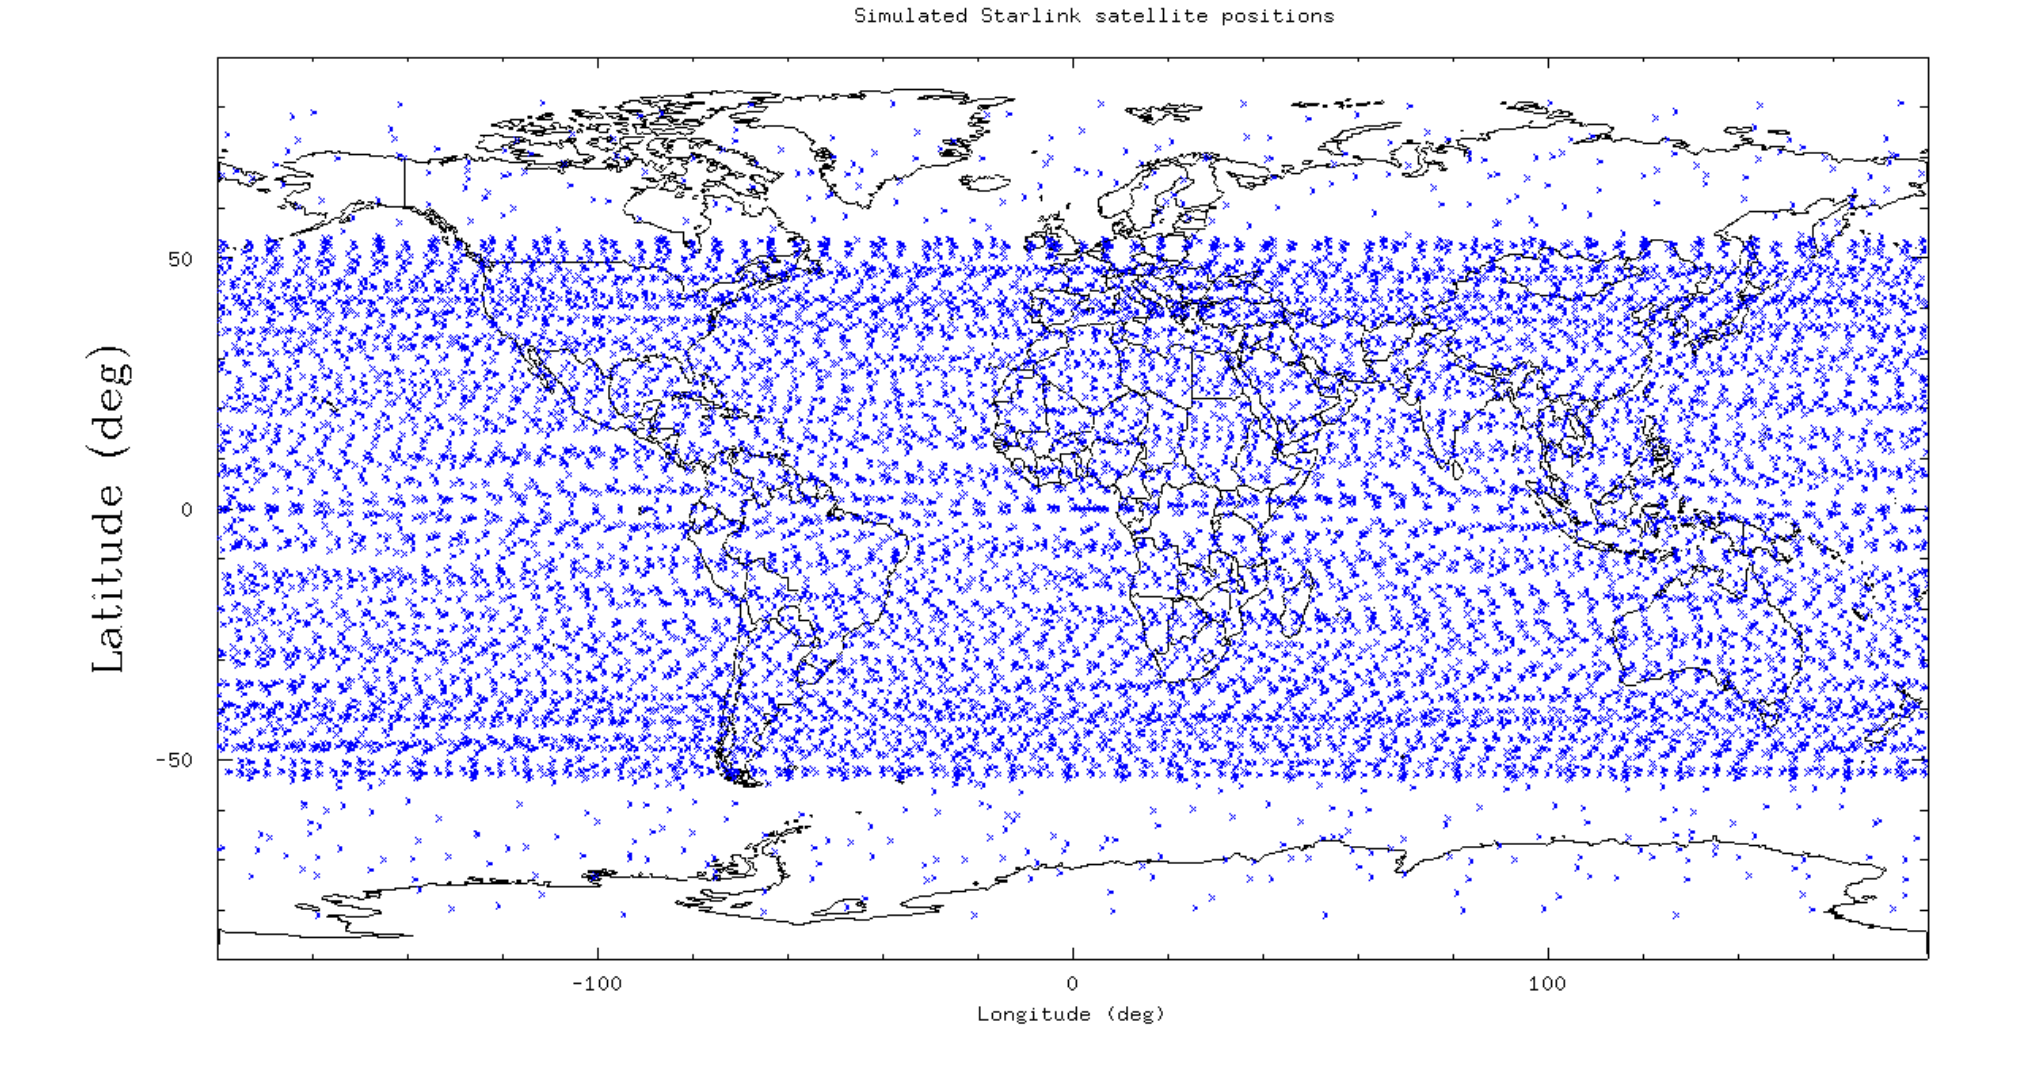
I simulated the instantaneous state of the constellation at a typical time (Fig. 4) assuming the satellites in a given orbital plane are equally spaced around the orbit, and calculated the number above the horizon as a function of latitude (Fig. 5). Since the bulk of the constellation is in orbits with inclination to the equator of around , the instantaneous distribution peaks at those latitudes.

I then simulate the number of these satellites that are illuminated by the Sun as a function of date and time of night. I do not attempt to model the reflectivity of the satellite as a function of phase, but simply count which satellites are in view of the Sun at a given time.
As representative examples I evaluate summer and winter periods for three latitudes: a typical populated Northern location at 52N (London; figures 6, 7), a typical low density (so darker sky) Southern location at 46S (Dunedin, New Zealand; figures 8,9), and an astronomy-intensive location at 30S (Cerro Tololo, Chile; figures 10, 11). I consider both the number of illuminated satellites above the horizon and the number illuminated above elevation 30 degrees (airmass 2), representative of the impact to the general public and the impact to professional observations respectively. We see that several hundred satellites are above the horizon at all times of night; during winter twilight, and all summer night long, most of them are illuminated. Note that 100 satellites with elevation above airmass 2 corresponds to an average number density of about 0.01 per sq degree of sky.
The illuminated satellites are preferentially near the horizon. Figure 12 repeats the content for the total (sum of layers A to C) illuminated satellites fromf 6 and 10 for summer at 52N and 30S showing the numbers for elevations 0, 5, 10 and 30 degrees. Just under half the total are at elevations above 10 degrees (where they will be visible above a typical cluttered and hazy horizon).
The model neglects the effects of satellites in their orbit raising phase. The current launch rate is about one batch of 60 per month and the deployment strategy can be monitored using the publicly available orbital data. Each launch places 60 satellites in orbit at around 300 km. Twenty of them undergo direct orbit raising to the 550 km altitude, which takes 45 days. Two other groups of 20, however, are held at 350 km for 35 and 70 days respectively, using differential nodal precession to reach orbital planes separated by 20 and 40 degrees. In steady state this results in about 60 to 100 satellites in this lower orbit where they are about 1 mag brighter than in the final orbit. With 12,000 satellites each with a typical 5 year life22 2 Shotwell, G. cited in Sheetz, M., https://www.cnbc.com/2019/11/11/watch-spacex-livestream-launching-second-starlink-internet-mission.html, the satellite replacement rate will rise to 200 per month.


.


.


.


.


.


.


.
IV Observations
The impact of the Starlink constellation depends on how bright the satellites are found to be. Accordingly, at the author’s request experienced observers from the hobbyist satellite observing group SeeSat 33 3 http://www.satobs.org obtained visual observations of almost all the first batch of Starlink satellites in the summer of 2019 (Figure 13). At this time the satellites were in the 550 km nominal orbit for the initial constellation (layer A), with the exception of a few which had experienced anomalies. The satellites were observed at a variety of elevations and phase angles, but a consistent picture emerges (Figure 14): the visual magnitudes range from 3 to 7 with most between visual mag . These observations confirm widespread press reports that the majority of the satellites are naked-eye objects from dark sites most of the time when illuminated. Detailed modelling of the phase-dependent brightness of the satellites versus elevation is beyond the scope of the present paper. However, knowing the proposed altitudes, we can estimate the approximate zenithal brightness of future satellites of the same design in layers B and C as and respectively. Thus, we expect the layer B satellites will not be naked-eye visible but the layer C satellites will be rather noticeable.
A new SeeSat observing campaign was begun in 2020 February, following the launch of Starlink-1130 (‘Darksat’), a non-operational satellite whose nadir surface had a special coating. Preliminary observations suggested that this coating had not been successful in making this satellite fainter than the others. However, new results in early 2020 March, after satellite had reached its operational altitude and final orientation required to point the darkened face toward nadir, indicate that it is now approximately 1 mag fainter that other Starlink satellites at comparable altitude (Cole 2020, Tregloan-Reed et al. 2020). If similar modifications are made to future satellites, the predictions made in this paper will need to be adjusted accordingly.


V Observational Impacts
Seitzer 2020 and Tyson 2020 have discussed various impacts of bright satellites passing over the field of view of an observation on professional ground-based observations, including image streaks, electronic crosstalk, effects on flat fields, and ghost images. In addition, for some telescopes a very bright satellite passing near the field of view could add scattered light across the field, impacting the limiting magnitude. Transient effects will occur even for non-illuminated satellites, occulting celestial sources. However, these will be rare for a given object and the timescale for the occultation for a 1 arcsecond seeing disk will be of the order of 20 milliseconds, so this should not be a problem for most projects which are looking at much longer timescales. Streaks can also affect observations made from orbit by space telescopes. When the 1100-1200 km layer B of the Starlink constellation and the comparable OneWeb constellation are deployed, one can expect impacts to large (several square degree) field-of-view observatories in lower orbits. With its narrow field of view, the Hubble Space Telescope (HST) should be less impacted, although not immune - on 2020 Feb 28 an exposure was ruined by the pass of a Chinese rocket stage only 34 km above the telescope, leaving a bright streak 23” wide across the target cluster of galaxies (J. Schmidt 2020, personal communication). Stankiewicz et al. 2008, Borncamp & Lim 2016, and Borncamp & Lian Lim 2019 discuss the problem of identifying and masking satellite trails in HST/ACS images.
The Starlink satellites are also likely to be bright thermal infrared sources. I do not consider the impact on near or mid-infrared astronomy in this paper, but further analysis seems warranted. Initial estimates suggest they will be microJansky sources at cm wavelengths but very bright in the submm (Anita Richards, 2020, personal communication). The potential for radio inteference was, of course, anticipated before launch, and the radio astronomy community has been working with SpaceX to minimize problems in that area.
The IAU 2019 and the AAS 2019 have issued statements of concern about the advent of the megaconstellations and the AAS has established a working group on the subject (Krafton 2019). The working group has been focussing on the impact to the Vera Rubin Observatory (formerly LSST) as representative of the worst impacts to observers. However, there appear to be other science projects which may be more severely affected. For example, searches for near-Earth asteroids include observations taken in twilight, a time when the satellites are illuminated year-round. Twilight surveys include the ZTF twilight survey (Ye et al. 2020) and the proposed LSST Twilight Survey (Seaman et al. 2018).
Also, long exposures of wide fields are likely to be affected even in dark time during summer. In all cases, one can assume that the satellite crosses the field of view in a time short compared to the exposure time. The expected number of satellite streaks crossing an image, assuming the satellites are essentially randomly distributed, is proportional to the product of the field of view and the exposure time. By exposure time here, we mean for a single frame, rather than the total accumulated exposure for a target object. One can median-filter sets of frames to remove streaks, as long as the number of streaks is low enough that no pixels are under a streak in multiple frames. However, for many science projects there are overheads associated with each frame that may make slicing the exposure into a larger number of shorter frames infeasible.
If the angular surface number density of satellites (number per square degree) is S, and their angular velocity is (degrees per second), then the expectation value for the number of streaks across an exposure of duration T (seconds) with field of view diameter D is (to within geometrical factors of order 1)
where characterizes the susceptibility of the observation to streaks. Note that this is basically an extension of the classic Buffon’s Needle problem (Buffon 1777).
The terms due to the constellation vary depending on the orbits, time of year, etc. They can be scaled to typical ‘summer midnight’ values of and angular velocity for 550 km orbit at zenith of 0.79 deg/s, and picking X=60 deg s:
We see that it is not implausible to reach , with every exposure having a satellite streak on average. For the Vera Rubin Observatory, X is typically 15 s * 3 deg = 45 deg s. For CFHT/Megacam, the Outer Solar System Origins Survey (Bannister et al. 2016), (Bannister et al. 2018) used a 1 sq deg FOV with up to 400 s exposures, so X = 400 deg s. The TNO searches of Sheppard et al. 2019 used CTIO/DECam (2.7 sq deg) with 420 s exposures, so X = 690 deg s. Thus, these examples are factors of ten more vulnerable to satellite streaks than VRO.
VI Other Megaconstellations
Other currently planned megaconstellations will have less impact on naked-eye observers since their proposed satellites are both smaller and in higher orbits. However, comparable impacts on professional astronomy are likely. OneWeb Satellites (https://onewebsatellites.com), based in the UK, is the other system currently being launched. By 2020 March 1, 49 OneWeb satellites had been deployed; their planned operational orbit is around 1170 km with an inclination of 88 degrees. No photometric observations of OneWeb satellites have yet been reported. The OneWeb system can be compared with the simulations for layer B in my Starlink model, although the higher inclination will result in a different latitude behaviour. China has several less ambitious low orbit constellations planned, including Xinhe (1000 proposed satellites), Hongyun (864 proposed satellites) and Hongyan (320 proposed satellties). Each of these projects has launched at least one test satellite to date.
Hainaut & Williams 2020 have recently performed similar analyses for generic constellations, with a somewhat different method. They derive broadly compatible results, except that they neglect the larger number of visible satellites above 30 degrees elevation expected in northern Europe and other high latitudes. Additionally, we report observations that disprove their parenthetical suggestion that current Starlink satellites are as faint as mag 8 in their final orbits.
Conclusion
The population of large artificial satellites in orbits below 600 km is undergoing rapid change and is now dominated by the Starlink system. Starlink is the first of the megaconstellations to see significant deployment, but it is unlikely to be the only one. Astronomers - and casual viewers of the night sky - must expect a future in which the low Earth orbit population includes tens of thousands of relatively large (few arcsecond angular size) satellites with a sky density of order 0.01 per square degree at zenith acting as sources of reflected sunlight affecting ground-based (and in some cases even space-based) observations. The impacts will be significant for certain types of observation (e.g. twlight observations and long-exposure observations with wide fields of view), certain observatories (those at relatively high latitude) and at certain times of year (local summer).
I am especially grateful to the SeeSat observers who provided Starlink magnitude estimates used here: Jay Respler, Brad Young, Cees Bassa, Bram Dorreman, and Ron Lee; and to Michele Bannister and Martin Elvis for extensive comments. I also thank Pat Seitzer, Patricia Cooper (SpaceX), and Dirk Petry for useful discussions and to the anonymous referee for helpful comments which improved the paper. Parts of this work were supported by the NASA Chandra X-ray Center, which is operated by the Smithsonian Astrophysical Observatory for and on behalf of the National Aeronautics Space Administration under contract NAS8-03060.
References
- AAS (2019) AAS. 2019, AAS Issues Position Statement on Satellite Constellations. https://aas.org/press/aas-issues-position-statement-satellite-constellations
- Bannister et al. (2016) Bannister, M. T., Kavelaars, J. J., Petit, J.-M., et al. 2016, AJ, 152, 70, doi: 10.3847/0004-6256/152/3/70
- Bannister et al. (2018) Bannister, M. T., Gladman, B. J., Kavelaars, J. J., et al. 2018, ApJS, 236, 18, doi: 10.3847/1538-4365/aab77a
- Borncamp & Lian Lim (2019) Borncamp, D., & Lian Lim, P. 2019, Astronomical Society of the Pacific Conference Series, Vol. 521, Satellite Detection in ACS/HST Images, ed. M. Molinaro, K. Shortridge, & F. Pasian, 491
- Borncamp & Lim (2016) Borncamp, D., & Lim, P. L. 2016, Satellite Detection in Advanced Camera for Surveys/Wide Field Channel Images, Instrument Science Report ACS 2016-01. http://www.stsci.edu/hst/acs/documents/isrs/isr1601.pdf
- Buffon (1777) Buffon, G. 1777, Histoire Naturelle, générale et particulière, Vol. Supplement 4, 46–123
- Cole (2020) Cole, R. E. 2020, Research Notes of the AAS, 4, 42, doi: 10.3847/2515-5172/ab8234
- Eberst (1982) Eberst, R. D. 1982, Advances in Space Research, 2, 9, doi: 10.1016/0273-1177(82)90004-7
- Hainaut & Williams (2020) Hainaut, O. R., & Williams, A. P. 2020, Astronomy & Astrophysics, doi: 10.1051/0004-6361/202037501
- IADC (2007) IADC. 2007, IADC (Inter-Agency Debris Committee) Space Debris Mitigation Guidelines, IADC-02-01 Rev 1, Tech. rep. https://www.unoosa.org/documents/pdf/spacelaw/sd/IADC-2002-01-IADC-Space_Debris-Guidelines-Revision1.pdf
- IAU (2019) IAU. 2019, IAU Statement on Satellite Constellations. https://www.iau.org/news/announcements/detail/ann19035/
- Kessler & Cour-Palais (1978) Kessler, D. J., & Cour-Palais, B. G. 1978, J. Geophys. Res., 83, 2637, doi: 10.1029/JA083iA06p02637
- King (2019) King, B. 2019, S&T, 138, 9. https://skyandtelescope.org/observing/spacex-launches-starlink-satellites/
- Krafton (2019) Krafton, K. 2019, AAS Works to Mitigate Impact of Satellite Constellations on Ground-Based Observing. https://aas.org/posts/advocacy/2019/12/aas-works-mitigate-impact-satellite-constellations-ground-based-observing
- McDowell (2018) McDowell, J. C. 2018, Acta Astronautica, 151, 668, doi: 10.1016/j.actaastro.2018.07.003
- Seaman et al. (2018) Seaman, R., Abell, P., Christensen, E., et al. 2018, arXiv e-prints, arXiv:1812.00466. https://arxiv.org/abs/1812.00466
- Seitzer (2020) Seitzer, P. 2020. https://nsf.gov/attachments/299316/public/12_Satellite_Constellations_and_Astronomy-Pat_Seitzer.pdf
- Sheppard et al. (2019) Sheppard, S. S., Trujillo, C. A., Tholen, D. J., & Kaib, N. 2019, AJ, 157, 139, doi: 10.3847/1538-3881/ab0895
- Smith (1982) Smith, F. G. 1982, Advances in Space Research, 2, 7, doi: 10.1016/0273-1177(82)90003-5
- SpaceX (2016) SpaceX. 2016, SAT-LOA-20161115-00118, Application for Fixed Satellite Service by Space Exploration Holdings, LLC, Tech. rep. https://licensing.fcc.gov/myibfs/download.do?attachment_key=1158349
- SpaceX (2017) —. 2017, SAT-LOA-20170301-00027, Application for Fixed Satellite Service by Space Exploration Holdings, LLC, Tech. rep. https://licensing.fcc.gov/myibfs/download.do?attachment_key=1190018
- SpaceX (2019) —. 2019, SAT-MOD-20190830-00087, Application for Fixed Satellite Service by Space Exploration Holdings, LLC, Tech. rep. https://fcc.report/IBFS/SAT-MOD-20190830-00087/1877764.pdf
- Stankiewicz et al. (2008) Stankiewicz, M., Gonzaga, S., & Whitmore, B. 2008, ACS CCD Image Anomalies in the Hubble Legacy Archive, Instrument Science Report HLA 2008-01. http://www.stsci.edu/files/live/sites/www/files/home/hst/instrumentation/acs/documentation/instrument-science-reports-isrs/_documents/hlaisr0801.pdf
- Tregloan-Reed et al. (2020) Tregloan-Reed, J., Otarola, A., Ortiz, E., et al. 2020, arXiv e-prints, arXiv:2003.07251. https://arxiv.org/abs/2003.07251
- Tyson (2020) Tyson, A. 2020, oral presentation in Session 410, Challenges to Astronomy from Satellites, 235th AAS meeting, Honolulu, Hawaii (Jan 2020)
- United States Space Force (2020) United States Space Force. 2020, Satellite Catalog. https://space-track.org
- Ye et al. (2020) Ye, Q., Masci, F. J., Ip, W.-H., et al. 2020, AJ, 159, 70, doi: 10.3847/1538-3881/ab629c