Structure and charge transport of amorphous -doped : An ab initio studyPreprint: APS/123-QED
Abstract
In this paper, we present ab initio computer models of -doped amorphous , a promising candidate for Conducting Bridge Random Access Memory (CBRAM) memory devices, and study the structural, electronic, charge transport and vibrational properties based on plane-wave density functional methods. We offer an atomistic picture of the process of phase segregation/separation between and subnetworks. Electronic calculations show that the models are conducting with extended Kohn-Sham orbitals around the Fermi level. In addition to that, we also characterize the electronic transport using the Kubo-Greenwood formula modified suitably to calculate the space-projected conductivity (SPC) Prasai et al. 2018. Our SPC calculations show that clusters and under-coordinated adjoining the are the conduction-active parts of the network. We also report information about the dependence of the electrical conductivity on the connectivity of the submatrix. Vibrational calculations for one of the models has been undertaken with an emphasis on localization and animation of representative modes.
pacs
71.23I INTRODUCTION
Novel non-volatile memory devices are an area of active inquiry. Research on ferroelectric random access memory (FeRAM) and magnetoresistive random access memory (MRAM) have been limited due to underlying technological and scalability problems Valov et al. 2011. Meanwhile, study of non-volatile memory, based on electrically switchable resistance or resistive random access memory (ReRAM), has gained considerable interest. The first studies of such resistive switching was reported in the 1960’s and was based on oxides in a metal-ion-metal (MIM) framework with formation/dissolution (SET/RESET) of filament electrochemical in nature Dearnaley et al. 1970. Amongst ReRAM’s, electrochemical metallization mechanism (ECM) or conductive bridging random access memory (CBRAM) which utilizes the electrochemical dissolution of an active electrode material such as or for SET/RESET mechanism has shown particular promise. In CBRAM, transition metals in their ionic state are converted to a conducting filament by applying a suitable electric field, which upon reversal, destroys the filament resulting in a resistive state. Several possible candidates for solid electrolytes have been studied elsewhere Lee et al. 2017; Chen et al. 2017; Tsuruoka et al. 2010; Gu et al. 2010; Xu et al. 2014; Pandey et al. 2015. Amorphous tantalum pentoxide/amorphous tantala (a- ) has been investigated as a possible candidate for memory devices, anti-reflection coatings and optical waveguides due to its high dielectric constant, high refractive index, chemical and thermal stability Chen et al. 1997; Reid and Martin 2016; Prasai et. al. 2019. -doped a- shows promising properties for CBRAM based memory devices.
Several experiments as well as calculations gu et al. 2009; Xiao et al. 2014; Banno et al. 2010; Tsuruoka et al. 2015 have been carried out to understand conduction mechanisms in materials. In these studies gu et al. 2009; Banno et al. 2010; Tsuruoka et al. 2015, , , metals were used as electrodes while in one Xiao et. al. Xiao et al. 2014 used nanowires of different diameters inserted into the low density host to study transport and electronic properties of as an electrolyte. These papers indicate that metal filaments are responsible for conduction. It has been reported that conduction paths in different electrolytes differ qualitatively. Metals such as form clusters, leading to a conducting filament in oxides, while no such clustering is observed in chalcogenide based electrolytes Prasai et al. 2018. Since a complete investigation of -doped has not yet been reported, we provide here a thorough investigation amid growing research to test its candidacy as a possible electrolyte for CBRAM technologies.
In this paper, we investigate the structural, electronic and lattice dynamics of amorphous -doped a- . We provide insights into structural properties and coordination statistics, electronic and vibrational properties, and visualize conduction/current paths by computing the space-projected conductivity (SPC) Prasai et al. 2018. We elucidate the atomistic mechanisms of phase segregation and track the emergence of clusters as the melt cools. The rest of paper is organized as follows. In section II, we discuss the computational methodology used to generate our models. This is followed by validation of the generated models with particular attention to the structural, electronic, vibrational, and thermal properties in section III. In Section IV we present the conclusions of our work and future research directions.
(a)

(b)
II Methodology and Models
We prepare two -atom models of a- cooled at different rates by utilizing melt-quenching within the ab initio molecular dynamics (AIMD) method.
The initial density for both of the models was chosen to be that of amorphous tantala ( ), consistent with experimental Bassiri et al. 2011; Alderman et al. 2018
and theoretical studies Xiao et al. 2014. We have performed molecular dynamics simulations using ab initio plane wave code VASP Kresse and Furthmuller 1996; Hacene et al.; Hutchinson and Widom 2012 with projector-augmented
wave (PAW) method Kresse and Joubert 1999 and employed the Perdew-Burke-Ernzerhof (PBE) Perdew et al. 1996 exchange-correlation functional. Due to the size of the unit cell, only the -point is used for Brillouin zone (BZ) integrations. A plane-wave cut off of 500 eV, a time step of 3.0 fs and Nose’ thermostat was used to control the temperature.
II.1 Model I
We fabricated a starting model of 48 , 120 and 42 atoms with random initial positions (with no atoms closer than 2 ) in a cubic box of side 14.14 . This model was then taken through a melt quench (MQ) (Drabold 2009) cycle. Firstly, the system was heated well above melting point to form a liquid at 6000 K and then equilibrated at 6000 K, cooled to 3000K in 18 ps, equilibrated at 3000K for 9ps and further cooled to 300K in 15 ps summing up for a total simulation time of 57 ps. The cell volume was relaxed to obtain zero pressure models. This zero-pressure relaxation produced a volume rise of yielding an optimized density of .
II.2 Model II
Another melt and quench (MQ) model, with slower cooling rate around the melting point of , was made. This model started with the melt of Model I cooled to 3000K and was further cooled to 300K in 24ps without any intermediate equilibration. The total simulation time was 60 ps.
After dynamical arrest, conjugate-gradient relaxation was applied until the magnitude of the force on each atom was reduced to less than . Zero-pressure relaxation increased the volume by and the density was optimized to . A third model, cooled faster than the models discussed here, has been described in the Supplementary Material, to provide some insight into the influence of the quench rate on the network topology.
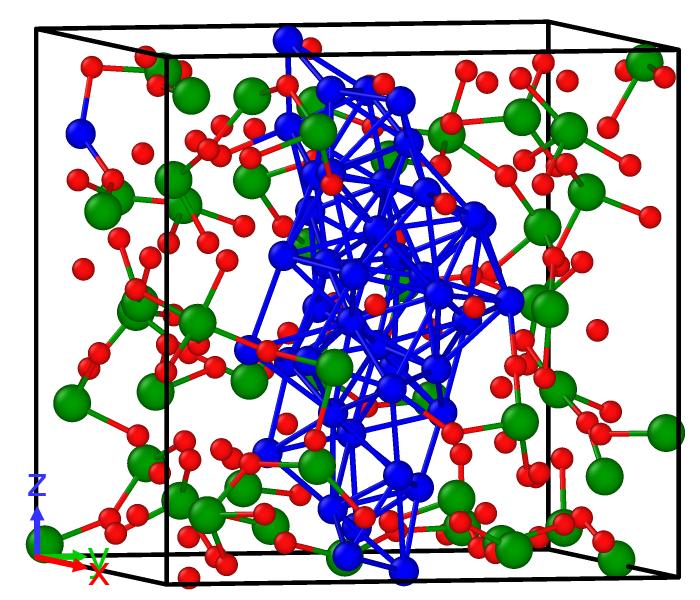
For simplicity and consistency, we follow the same ”color nomenclature” for the atomic species: , , and atoms are colored green, red, and blue respectively.
| Atom | |||||
|---|---|---|---|---|---|
| 7.96 | 1.75 | 5.52 | 0.69 | ||
| 2.44 | 2.21 | 0.00 | 0.23 | ||
| 7.17 | 0.79 | 0.67 | 5.71 | ||
| 8.00 | 1.92 | 5.60 | 0.48 | ||
| 2.45 | 2.24 | 0.00 | 0.21 | ||
| 7.48 | 0.55 | 0.60 | 6.33 |
III RESULTS AND DISCUSSION
III.1 Structural Properties
As shown in Fig.2, the radial distribution function for both models has a first peak at 1.95, which arises from the dominant - bonds and corresponds to the - bond length. This peak is in agreement with experiments Shyam et al. 2016; Bassiri et al. 2011 for pure a- and previous DFT calculations gu et al. 2009 for -doped tantala as well which suggests that the introduction of to the network does not significantly change the local environment around the atoms, i.e. the dominance of - octahedra in the structure persists even after doping. This finding is also supported by low - coordinations. Introduction of , however, steals some coordination from , as seen in Table I, and these under-coordinated atoms have a significant role in conduction which will be explained later.

The - correlations also remain unaffected by -doping but a strong peak, at 2.48, in the - correlations suggests the formation of clusters in the system, as seen in Fig.3, which can be attributed to the ionicity of the - bonds Kim and Stebbins 2011 that drives the -atoms to cluster. Previously, clustering of in ionic host (a-) has been reported Prasai et al. 2018. This strong - correlation suggests that -atoms preferentially bond with themselves, consistent with the coordination statistics. In contrast, zirconia-doped tanatala shows no clustering and, the metal atoms distribute themselves homogenously with no metal-metal pair closer than 2.9 Prasai et. al. 2019. It is quite interesting that our calculations “naturally” produce connected ”wires” that are extended in space (considering the periodic boundary conditions), not by modeler’s “installation”, but as a direct and unbiased consequence of the melt-quench simulations themselves.
(a)
(b)
Two peaks are worth mentioning in the - correlation: the first at around 3.3, and the second around 3.8, firstly because they provide an idea of the how the - octahedra are connected, and secondly because they are implicated in mechanical loss for Laser Interferometer Gravity Wave Observatory application Prasai et. al. 2019. The former comes from the joint contribution of face and edge-shared octahedral connection while the latter derives from the corner-shared connection of the octahedra.
The coordination statistics of the models in Table I largely serve to validate the findings of the RDF and the correlations between different species. It also suggests that, as we lower the cooling rate, the - coordination increases while the - coordination decreases. This implies slower cooling rates produce better clusters with being pushed away from them.
To compare the - and the - environment and its evolution during the melt and quench process in our models, we calculate, at each step, the following quantities:
| (1) |
| (2) |
The sum over j runs over three nearest in the first equation and over three nearest in the second. The scatter plots in Fig. 3 show how these distances change as we cool the melt. This plot clearly shows that as we reduce the cooling rates, the and atoms move apart. Furthermore, the details of the change in the bonding environments of the atoms and the phase segregation of atoms in the network during the melt and quench process has been discussed with animations in the Supplementary Material. There, we provide a visualization of the network formation process, and observe the exclusion of as the host network, rendering the becomes atomus non grata in or near the regions. The main “takeaway” from Fig. 3 is that the more extended cooling produces a more compact cluster for Model II (hence the extended right “leg” on the right side of the “ballerina plot” of Fig. 3b compared to Fig 3a). This suggests that slower cooling rates create clusters that are as compact as possible, and minimize cluster surface area exposed to the host. Of course this hints at a propensity to form crudely spherical clusters, though our simulations are too small to prove this assertion.
(a)

(b)

(c)

(d)

(a)

(b)
III.2 Electronic Properties
To understand the electronic structure of the models, we examine the total density of states (DoS), partial DoS and inverse participation ratio (IPR). These calculations not only help us check the validity of the model, but can also be used for a priori information to model amorphous materials Prasai et al. 2016; Los and Kühne 2013. The plot of the DoS in Fig. 4 reveals that both models have states around the Fermi level with extended Kohn-Sham orbitals indicating conducting behavior. Since the host ( ) is an insulator with a band gap of Wu et al. 1994, we see that the introduction of to the network closes the gap by inducing impurity bands spread throughout the entire host ( ) gap. This is corroborated by the fact that the states near the Fermi level arise from the -3d orbitals hybridized mainly with and small contributions from orbitals, as seen in the partial DoS plots in Fig.4.
Our calculations show that the states near the Fermi level arise mostly due to and and a small contribution from . The occurrence of clusters in the host suggest that the -clusters and atoms near them form the conduction-active parts. In order to study the details of the states near the Fermi level, we plot the species-projected DoS averaged over three states above and below the Fermi level in Fig.5. These plots show that states near the Fermi level arise from both and atoms and is shared among a fairly large number of atoms.
A further insight into the electronic properties is given by IPR defined as:
| (3) |
with being the contribution to the eigenvector from the atomic orbital (, , and ) as obtained from VASP. In physical terms, IPR of electronic states is a measure of localization: localized state having high IPR value (ideally equal to ) while a completely extended state having a value of (1/N), i.e. evenly distributed over N atoms.
Near the Fermi level, we observe low IPR indicating delocalized states and conducting behavior of the models.
III.2.1 Space Projected Conductivity
The density of states provides some hints about the species contributing near the Fermi-level; however, the conduction also depends upon the localization of their electronic states and momentum matrix elements between Kohn-Sham states near the Fermi level. Recently, we have developed a spatial decomposition of the Kubo-Greenwood Kubo 1957; Greenwood 1958 formula that provides information about conducting paths in real space. By introducing a discrete grid in space, we show that the quantity:
| (4) |
provides such information at the spatial grid point x and for which:
| (5) |
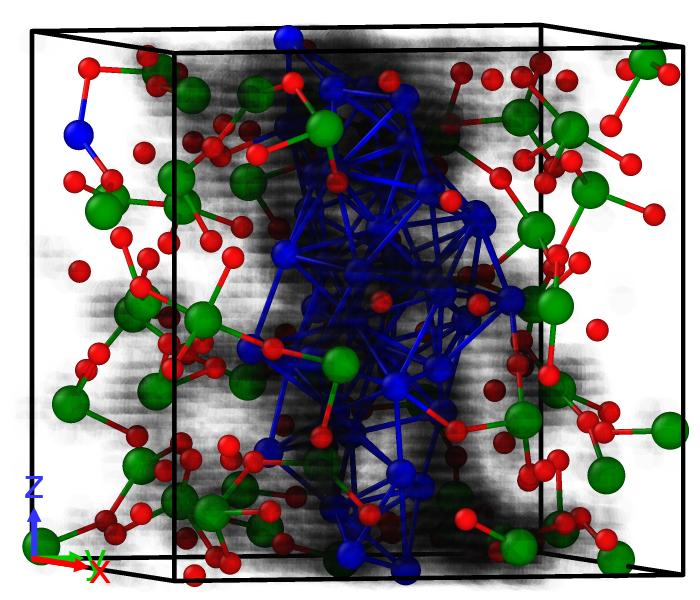
Here, is defined in Prasai et. al Prasai et al. 2018 and is a complex-valued function, is the Kohn-Sham eigenfunction and . We have used this approach to describe transport in a solid electrolyte material (Prasai et al. 2018) and -doped a-alumina Subedi et al. 2019. In a mixed (insulating/conducting) system like ours only a few eigenvectors of characterize essentially all conduction in the system.
The SPC for both models is visualized as a grayscale plot in Fig.6. The figure shows that connected atoms form primary sites of conduction as expected. However, some atoms, which are near the atoms also contribute significantly to the electronic conduction. A detailed analysis of the bonding environment of these atoms show that they are under-coordinated with oxygen,i.e. have less than (or equal to) five bonds, a result that in agreement with previous works on non-stoichiometric tantala Bondi et al. 2013. A detailed discussion of the bonding environment and the coordination statistics of these atoms has been made in the Supplementary Material. Furthermore, slower cooling rates produces higher - coordination and better connectivity, thereby enhancing conductivity. There is a factor of about 5 higher conduction in Model II than Model I, presumably because of the small “neck” interlinking in Model I.
III.3 Vibrational Properties
(a)
(b)
III.3.1 Vibrational Density of States
The vibrational density of states (VDOS) provides key information about local bonding environments in amorphous solids and serves as a test to validate a modelLopinski et al. 1996. Model I was well relaxed, and the lattice vectors were simultaneously relaxed to attain zero pressure, which of course produces a slightly non-orthogonal supercell. We displaced each atom in six directions(,,) by ( 0.015 ), and after each of these small displacements, forces were computed on all atoms, to obtain the force constant matrix, and dynamical matrixBhattarai and Drabold 2017. Classical normal modes were computed from the dynamical matrix by direct diagonalization. The VDOS is defined as:
| (6) |
, with N and representing the number of atoms and the eigenfrequencies of normal modes, respectively. To determine the elemental contribution to the VDOS, we computed species projected VDOS defined as Pasquarello et al. 1998:
| (7) |
, are the eigenvectors of the normal modes and is total number of atoms of species. These species-projected VDOS must satisfy the relation .
As seen in Fig.7 (left panel), the VDOS is peaked at , a peak arising due to the mixing of vibrational motion of and atoms. Partial VDOS plot (right panel) shows that - and - vibrations are both peaked at while the atoms do not contribute to low frequency vibrations as significantly as the other species. However, at frequencies above , VDOS contributions arise mainly from the -atoms, with no mixing, which can be ascribed to the low atomic mass of compared to - and - atoms. In the intermediate region ( - ), vibrations arise from combined contributions of all atomic species. Animations of selected modes are provided in the Supplementary Material. Mode mixing and cross-talk between the phase-separated regions are features of these animations.
III.3.2 Localization of vibrational modes
While the VDOS is an observable that can be measured almost directly from inelastic neutron scattering experiments, the localization of these vibrations are not easily observable. To study the localization of vibrational modes in the -doped , we calculate the vibrational IPR, the vibrational analogue of the electronic IPR, from the eigenvectors as shown in Equation. 8:
| (8) |
where () is displacement vector of atom at normal mode frequency .
A small value of VIPR indicate evenly distributed vibration among the atoms while higher values imply only a few atoms contributing at that particular eigenfrequency. We have plotted the total VIPR in Fig.7. Low values of VIPR below suggest that the vibrational modes are completely delocalized/extended. Above , we observe higher VIPR. To provide visual insight to the spread of vibration over atoms and localization of some vibrational modes, suitable animations and explanations of some normal modes has been provioded in the Supplementary Material.
To investigate the relation between the vibrational localization and atomic species, we evaluate contribution to VIPR from each atomic species, commonly called species-projected VIPR Bhattarai et al. 2019. These projections sum up to the total VIPR, i.e. satisfy the relation:
| (9) |
and is shown on the right panel of Fig. 7. The species-projected VIPR calculations suggest that low frequency modes arise mainly from - and -atoms while the high frequency vibrations come mostly from the -atoms which can be attributed to the atomic masses of the species. Higher values of partial VIPR are seen at higher frequencies. Therefore, the high frequency modes are localized on a few atoms in the network while the low frequency modes are spread among larger number of and atoms. The quantity plotted in the bottom left panel Fig. 7 is the squared-magnitude of normalized eigenvectors summed across the atomic species for all the normal modes. The scatter plot and the partial VDOS plots suggest that the - and -atoms participate almost equally in the low frequency vibrations.
IV Conclusions
We describe the atomistic process of phase segregation of in a- . The did not significantly alter the - bonding but instead phase separated, forming clusters. Models made with a slower cooling rate revealed significantly better (denser) clustering than the one with faster cooling rate. These clusters, along with the neighboring under-coordinated atoms, form a conducting path in the network which is in agreement with previous literature, though presented in novel way in this paper, and not relying only on the Kohn-Sham states near the Fermi level, but also the momentum matrix elements, a legacy of the current-current correlation functions of Kubo. All this lends significant insight into an important CBRAM material.
It is interesting to speculate on what would happen in larger models and different cooling rates. We might expect to see blobs in the network, possibly spatially separated but potentially interconnected by some other conducting fabric, perhaps Cu nanowires (of essential interest of course for CBRAM applications). While direct simulations like this one is computationally impossible for so large a system, it provides potentially useful a priori information for modeling employing simpler interatomic interactions. Electronic DoS calculations show that -doping closes the gap in the DoS of pure a- with extended Kohn-Sham orbitals around the Fermi level. Vibrational modes at low frequencies are shared among many and atoms while those at high frequency are quite localized and come only from atoms.
V Acknowledgements
We thank the National Science Foundation for support under grant DMR-1507670. We thank Dr. Kiran Prasai of Stanford University for helpful discussions.
References
- Prasai et al. (2018) K. Prasai, K. N. Subedi, K. Ferris, P. Biswas, and D. A. Drabold, physica status solidi (RRL) – Rapid Research Letters 12, 1800238 (2018), https://onlinelibrary.wiley.com/doi/pdf/10.1002/pssr.201800238 .
- Valov et al. (2011) I. Valov, R. Waser, J. R. Jameson, and M. N. Kozicki, Nanotechnology 22, 254003 (2011).
- Dearnaley et al. (1970) G. Dearnaley, A. M. Stoneham, and D. V. Morgan, Reports on Progress in Physics 33, 1129 (1970).
- Lee et al. (2017) D. Lee, S. Oukassi, G. Molas, C. Carabasse, R. Salot, and L. Perniola, IEEE Journal of the Electron Devices Society 5, 283 (2017).
- Chen et al. (2017) W. Chen, S. Tappertzhofen, H. J. Barnaby, and M. N. Kozicki, Journal of Electroceramics 39, 109 (2017).
- Tsuruoka et al. (2010) T. Tsuruoka, K. Terabe, T. Hasegawa, and M. Aono, Nanotechnology 21, 425205 (2010).
- Gu et al. (2010) T. Gu, T. Tada, and S. Watanabe, ACS Nano 4, 6477 (2010), pMID: 20932047.
- Xu et al. (2014) X. Xu, J. Liu, and M. P. Anantram, Journal of Applied Physics 116, 163701 (2014).
- Pandey et al. (2015) S. C. Pandey, R. Meade, and G. S. Sandhu, Journal of Applied Physics 117, 054504 (2015).
- Chen et al. (1997) K. Chen, M. Nielsen, G. R. Yang, E. J. Rymaszewski, and T.-M. Lu, Journal of Electronic Materials 26, 397 (1997).
- Reid and Martin (2016) S. Reid and I. W. Martin, Coatings 6 (2016), 10.3390/coatings6040061.
- Prasai et. al. (2019) K. Prasai et. al., Phys. Rev. Lett. 123, 045501 (2019).
- gu et al. (2009) T. gu, Z. Wang, T. Tada, and S. Watanabe, Journal of Applied Physics 106, 103713 (2009).
- Xiao et al. (2014) B. Xiao, T. gu, T. Tada, and S. Watanabe, Journal of Applied Physics 115, 034503 (2014).
- Banno et al. (2010) N. Banno, T. Sakamoto, N. Iguchi, M. Matsumoto, H. Imai, T. Ichihashi, S. Fujieda, K. Tanaka, S. Watanabe, S. Yamaguchi, T. Hasegawa, and M. Aono, Applied Physics Letters 97, 113507 (2010), https://doi.org/10.1063/1.3488830 .
- Tsuruoka et al. (2015) T. Tsuruoka, I. Valov, S. Tappertzhofen, J. van den Hurk, T. Hasegawa, R. Waser, and M. Aono, Advanced Functional Materials 25, 6374 (2015), https://onlinelibrary.wiley.com/doi/pdf/10.1002/adfm.201500853 .
- Bassiri et al. (2011) R. Bassiri, K. B. Borisenko, D. J. H. Cockayne, J. Hough, I. MacLaren, and S. Rowan, Applied Physics Letters 98, 031904 (2011), https://doi.org/10.1063/1.3535982 .
- Alderman et al. (2018) O. L. G. Alderman, C. J. Benmore, J. Neuefeind, E. Coillet, A. Mermet, V. Martinez, A. Tamalonis, and R. Weber, Phys. Rev. Materials 2, 043602 (2018).
- Kresse and Furthmuller (1996) G. Kresse and J. Furthmuller, Phys. Rev. B 54, 11169 (1996).
- (20) M. Hacene, A. Anciaux-Sedrakian, X. Rozanska, D. Klahr, T. Guignon, and P. Fleurat-Lessard, Journal of Computational Chemistry 33, 2581, https://onlinelibrary.wiley.com/doi/pdf/10.1002/jcc.23096 .
- Hutchinson and Widom (2012) M. Hutchinson and M. Widom, Computer Physics Communications 183, 1422 (2012).
- Kresse and Joubert (1999) G. Kresse and D. Joubert, Phys. Rev. B 59, 1758 (1999).
- Perdew et al. (1996) J. P. Perdew, K. Burke, and M. Ernzerhof, Phys. Rev. Lett. 77, 3865 (1996).
- Drabold (2009) D. A. Drabold, The European Physical Journal B 68(1) (2009).
- Shyam et al. (2016) B. Shyam, K. Stone, R. Bassiri, M. Fejer, M. Toney, and A. Mehta, Scientific Reports 6, 32170 (2016).
- Kim and Stebbins (2011) N. Kim and J. F. Stebbins, Chemistry of Materials 23, 3460 (2011), https://doi.org/10.1021/cm200630m .
- Prasai et al. (2016) K. Prasai, P. Biswas, and D. A. Drabold, Phys. Status Solidi A 213, 1653 (2016).
- Los and Kühne (2013) J. H. Los and T. D. Kühne, Phys. Rev. B 87, 214202 (2013).
- Wu et al. (1994) X. Wu, S. Soss, E. Rymaszewski, and T.-M. Lu, Materials Chemistry and Physics 38, 297 (1994).
- Kubo (1957) R. Kubo, J. Phys. Soc. Jpn. 12, 570 (1957).
- Greenwood (1958) D. A. Greenwood, Proceedings of the Physical Society 71, 585 (1958).
- Subedi et al. (2019) K. N. Subedi, K. Prasai, M. N. Kozicki, and D. A. Drabold, Phys. Rev. Materials 3, 065605 (2019).
- Bondi et al. (2013) R. J. Bondi, M. P. Desjarlais, A. P. Thompson, G. L. Brennecka, and M. J. Marinella, Journal of Applied Physics 114, 203 (2013).
- Lopinski et al. (1996) G. P. Lopinski, V. I. Merkulov, and J. S. Lanin, Appl. Phys. Lett. 69, 3348 (1996).
- Bhattarai and Drabold (2017) B. Bhattarai and D. A. Drabold, Carbon 115, 532 (2017).
- Pasquarello et al. (1998) A. Pasquarello, J. Sarnthein, and R. Car, Phys.Rev.B 57, 22 (1998).
- Bhattarai et al. (2019) B. Bhattarai, R. Thapa, and D. A. Drabold, Modelling and Simulation in Materials Science and Engineering 27, 075002 (2019).