How galaxies populate haloes in very low-density environments?
Observatorio Astronómico de Córdoba, UNC, Laprida 854, X5000BGR, Córdoba, Argentina.
Abstract
Context. Evidence shows properties of dark matter haloes may vary with large-scale environment. By studying the halo occupation distribution in cosmic voids it is possible to obtain useful information that can shed light on the subject. The history of the formation of the haloes and galaxies residing in these regions is likely to differ from the global behaviour given their extreme environment.
Aims. Our goal is to characterize the halo occupation distribution in the interior of cosmic voids and compare with the general results to unveil the way galaxies populate haloes in simulated galaxy catalogues.
Methods. We use two public access simulated galaxy catalogues constructed with different methods: a semi-analytical model and a hydrodynamic simulation. In both, we identify cosmic voids and we measure the halo occupation distribution inside these regions for different absolute magnitude thresholds. We compare these determinations with the overall results and we study the dependence of different characteristics of the voids. Also, we analyze the stellar content and the formation time of the haloes inside voids and confront the general halo population results.
Results. Inside the voids, we find a significantly different halo occupation distribution with respect to the general results. This is present in all absolute magnitude ranges explored. We obtain no signs of variation related to void characteristics indicating that the effects depend only on the density of the large-scale environment. Additionally, we find that the stellar mass content also differs within voids, which host haloes with less massive central galaxies () as well as satellites with significantly lower stellar mass content (). Finally, we find a slight difference between the formation times of the haloes which are younger in voids than the average population. These characteristics indicate that haloes populating voids have had a different formation history, inducing significant changes on the halo occupation distribution.
Key Words.
large-scale structure of Universe – Galaxies: halos – Galaxies: statistics – Methods: data analysis – Methods: statistics1 Introduction
The current paradigm for structure formation in the Universe assumes galaxies forming by baryon condensation within the potential wells defined by the collisionless collapse of dark matter haloes (White & Rees 1978). However, the diversity of astrophysical mechanisms involved in the process of galaxy formation and evolution does not allow to determine unambiguously how galaxies occupy haloes. Thus, understanding the links between galaxies and the dark matter haloes in which they reside is one of the keys to comprehending the formation and evolution of large structures.
Several works show that the Halo Occupation Distribution (HOD) is a powerful tool to connect galaxies and dark matter haloes. HOD describes the probability distribution that a virialized halo of mass contains galaxies with some specified characteristic (Jing et al. 1998; Ma & Fry 2000; Peacock & Smith 2000; Seljak 2000; Scoccimarro et al. 2001; Berlind & Weinberg 2002; Cooray & Sheth 2002; Berlind et al. 2003; Zheng et al. 2005; Yang et al. 2007; Rodriguez et al. 2015, e.g.). Moreover, many authors have proposed the use of the HOD to constrain models of galaxy formation and evolution (Benson et al. 2000; Berlind et al. 2003; Kravtsov et al. 2004; Zentner et al. 2005; Zehavi et al. 2011, e.g.) and to cosmological models (Van Den Bosch et al. 2003; Zheng & Weinberg 2007, e.g.).
Generally, the HOD approach assumes that the halo population depends only on their mass, a first approximation that has been ample analyzed. Some examples of this, are the works of Pujol & Gaztañaga 2014 who found that HOD cannot reconstruct the galaxy bias for low mass haloes in several semi-analytic models, and Pujol et al. 2017 semi-analytic models analysis of the influence of local density. In the later, the authors point out HOD as a better predictor of galaxy bias than halo mass, while on the other hand, Berlind et al. 2003 study of the environmental variations of the HOD in hydrodynamical cosmological simulations shows no significant dependence. However, Zehavi et al. 2018, Artale et al. 2018 and Bose et al. 2019 explored the dependence of halo occupation on the large scale environment for some semi-analytic and hydrodynamical simulations, finding some relevant signs of correlation.
As it is well known, the cosmic web that forms the large-scale structure of the Universe contains regions with large mass density fluctuations with respect to the mean background density, with cosmic voids corresponding to the lowest density regions. There are several precise definitions of cosmic voids, where the differences of these definitions account for a diversity of derived void properties such as their topology or the inner mass content (Colberg et al. 2008; Cautun et al. 2018). Nevertheless, all the definitions agree that these regions comprise most of the volume of the Universe, but only contain a small fraction of the galaxy populations (Pan et al. 2012).
The extremely low densities plus the expansion of the void turn gravitational interactions between galaxies less frequent, a fact that affects the growth and fate of structure. These characteristics make cosmic voids ideal regions to study aspects of the formation and evolution of galaxies unlikely to be observed elsewhere. The influence of these extremely low-density environments on their member galaxies may be reflected in different dynamical and astrophysics properties compared to galaxies populating higher density regions. Void galaxies tend to be blue, faint and of late-type morphologies (Rojas et al. 2004; Hoyle et al. 2005; Patiri et al. 2006; Ceccarelli et al. 2008; Hoyle et al. 2012), generally exhibiting young stellar populations and intense star formation activity (Rojas et al. 2005). Thus, void galaxies are expected to have a significantly different dynamical and astrophysical evolution. In this context, the possible dependence of HOD on the environment should be most clearly seen inside cosmic voids.
In previous work, Ruiz et al. 2019 found a significantly low amplitude of the galaxy-galaxy correlation function for galaxy samples inside cosmic voids. As analysed by Cooray & Sheth 2002, the galaxy power spectrum can be expressed in terms of the HOD. Thus, given that the correlation function is straightforwardly associated with the power spectrum (Peebles 1980), HOD is also expected to differ when measured inside the cosmic voids. In this work, we use cosmic void definition following Ruiz et al. 2019 that considers spherical regions where the integrated density contrast doe not exceed a given threshold value . In the literature, see for instance Ruiz et al. 2015b and references therein, this parameter varies between and , so that inside void boundaries there is at most to the mean density of the Universe.
This paper is organized as follows. In Sec. 2 we describe the simulated galaxy catalogues obtained from both, a semi-analytic model , and a hydrodynamical simulation. We also describe the algorithms to identify cosmic voids and the void catalogues obtained. In Sec. 3 we describe the methodology used to determine the HOD inside cosmic voids. In Sec. 4 we present the results of the HODs measurements inside the voids in both catalogues. In this section, we also explore the dependence of the results on void properties such as , void size, and the surrounding void environment. In Sec. 5 we study the halo stellar mass distribution as a function of the total dark matter halo mass. In Sec. 6 we compare the halo formation time inside voids with the overall results. Finally, in Sec. 7 we present our summary and conclusions.
2 Data
In this section we present the simulated galaxy catalogues used in this work. We also present a brief description of the void identification algorithm used, and the final void catalogues obtained.
2.1 Simulated galaxy catalogues
We use two simulated galaxy catalogues, one based on a semi-analytic approach, and one extracted from a hydrodynamic simulation.
2.1.1 The MDPL2-SAG galaxy catalogue
The MDPL2-SAG11 1 doi:10.17876/cosmosim/mdpl2/007 catalogue is part of the MultiDark-Galaxies catalogues (Knebe et al. 2018), publicly available at the CosmoSim22 2 https://www.cosmosim.org and Skies & Universes33 3 https://www.skiesanduniverses.org databases. This catalogue was constructed by applying the semi-analytic model of galaxy formation and evolution SAG (acronym for Semi-Analytic Galaxies) to the dark matter haloes of the MDPL2 cosmological simulation.
The SAG model (Cora et al. 2018) includes all the main physical processes involved in the formation and evolution of galaxies, such as star formation, supernova feedback, radiative cooling of the hot gas, chemical enrichment of gas and galaxies, growth of supermassive black holes, feedback by AGN, starbursts via disc instabilities and galaxy mergers. For readers interested in a complete description of the several physical processes present in the SAG model and the details of its implementation, we refer to Cora 2006, Lagos et al. 2008, Tecce et al. 2010, Ruiz et al. 2015a, Gargiulo et al. 2015 and Cora et al. 2018.
The MDPL2 simulation (Riebe et al. 2013; Klypin et al. 2016), which is also available at the CosmoSim database, counts with 38403 dark matter particles in a comoving box of 1000 on a side, which translates in a particle mass resolution of . The cosmological parameters adopted correspond to a flat CDM scenario consistent with Planck results (Planck Collaboration et al. 2014): , , , and .
The haloes and subhaloes used to populate the simulation with galaxies were identified with the Rockstar Halo Finder (Behroozi et al. 2013a) and the merger trees were constructed with ConsistentTrees (Behroozi et al. 2013b).
From the complete MDPL2-SAG catalogue at , we select all galaxies with absolute magnitudes in the -band , stellar masses and host haloes with masses , where corresponds to the mass enclosed within overdensity of 200 times the critical density of the Universe. The final catalogue comprises 41986893 galaxies.
2.1.2 The TNG300 galaxy catalogue
The TNG300 simulation is part of the IllustrisTNG44 4 http://www.tng-project.org/ suite of hydrodynamical simulations of galaxy formation in cosmological volumes (Marinacci et al. 2018; Naiman et al. 2018; Nelson et al. 2018; Pillepich et al. 2018a; Springel et al. 2018). Particulary, the TNG300 counts with dark matter particles and gas particles in a cubic comoving box of on a side, which results in a dark matter and baryonic mass resolutions of and , respectively. The cosmological model adopted is a flat CDM with parameters also in agreement with Planck results (Planck Collaboration et al. 2016): , , , and . The simulation was evolved using the moving mesh code AREPO (Springel 2010) and includes not only all the relevant processes of galaxy formation but also a detailed magneto-hydrodynamical implementation (see Weinberger et al. 2017 and Pillepich et al. 2018b for a complete description of the physical processes implemented).
We select all galaxies from the snapshot at with and host haloes with masses . The final catalogue counts with 657040 galaxies.
2.2 Void identification and void catalogues
In both MDPL2-SAG and TNG300 galaxy catalogues, cosmic voids were identified using the algorithm presented in Ruiz et al. 2015b. Briefly, the identification starts estimating the density field via a Voronoi tessellation of the galaxy catalogues, which are used as tracers. For each Voronoi cell we can compute a density given by , being the volume of the cell, and define a density contrast as , where is the mean density of tracers. All Voronoi cell which satisfies is selected as a centre of an underdense region, and for those centres, we select as void candidates all-spherical volumes with an integrated density contrast , where is the void radius and is a density contrast threshold, usually chosen as or (which means 20% or 10% of the mean density of tracers, respectively). For each of those void candidates, the computation of is repeated several times in randomly displaced centres near the previous ones, accepting a new centre only if the new void radius is larger than the older one. This random walk procedure is performed in order to obtain void candidates centred the closest as possible in the true minimum of the density field. The final step of the identification removes overlapping void candidates by keeping the largest voids which do not superpose with any other candidate.
In both catalogues used in this work, we select all galaxies with as tracers to identity voids, obtaining 12791 voids for MDPL2-SAG and 301 voids for TNG300. In Fig. 1 we show the radii distribution for both catalogues (MDPL2-SAG in red and TNG300 in green) and in Table 1 we show the relevant numbers of the void catalogues obtained.
It can be seen that TNG300 void radii are smaller than in MDPL2-SAG. This is due to the fact that TNG300 catalogue has a larger number density of tracers in this luminosity range than MDPL2-SAG catalogue (see Table 1). To study the impact of the volume number density of galaxies and voids, in Appendix we have tested our results using samples of voids limited by size, in order to obtain the same number density of voids in both catalogues (Sec. A.1), and with void catalogues identified with equal number density of tracers (Sec. A.2). Furthermore, the results found in this work (Sec. 4, 5 and 6) remain unchanged.
Taken into account that observational works usually consider HOD as a function of a fixed absolute limiting magnitude, and aiming a future comparison with real data, we show here the results obtained with a fixed luminosity threshold.
To complete the description of the void samples of each catalogue, we present in Table 1 the number of voids in each sample and sub-sample considered.
| MDPL2-SAG | TNG300 | |
| Total number of voids | ||
| Number of galaxies in voids | ||
| Median [] |
3 Analysis of HOD in voids
In this section we describe the methodology adopted to measure the HOD and in particular, inside cosmic voids.
We study the mean number of galaxies in haloes of a given mass, , being for both catalogues. In order to compute this quantity, we use the available membership information of galaxies to associate them to their host dark matter haloes. In this case, the HOD is just obtained by binning in halo mass and computing the average number of galaxies in each bin.
To compute HOD inside cosmic voids we follow the same procedure described above but taking into account only those haloes which are completely enclosed within void boundaries, thus we remove from our samples all haloes which have galaxies beyond the void radius.
We have compared the overall HOD results with those computed using only haloes inside voids. In all cases, to compute the variance obtained in HOD calculations we use the jackknife technique. For this purpose, we separate the sample of haloes in 50 equal number sub-samples and we compute HOD variations when we do not consider each one of this sub-samples in the measurements. We also test the results using 10, 100, 150 and 1000 sub-samples in the jackknife procedure finding that, for 50 or more sub-samples the variance values stabilize.
In order to explore for possible HOD dependence on void parameters, we have explored the results obtained as a function of , void radius and void type classification according to their environment (see Sec. 4). We have also compared the stellar mass content of haloes residing inside voids with that derived for the total halo sample. This comparison provides further information to understand the environmental dependence of the relation between halo total stellar mass and number of galaxies.
4 Results
4.1 Dependence on
Cosmic voids are defined as spherical regions where the integrated overdensity is below a certain threshold value . This parameter is fundamental since it is the only free parameter in our identification algorithm. We identify voids with integrated density contrast and . Within these structures, we measure the HOD in each void sample and compare the results with the global HOD obtained for the total haloes sample.
In Fig. 2 we show the dependence of HOD with in both MDPL2-SAG and TNG300 catalogues. The overall HOD is presented in black lines while red lines correspond to the HOD inside cosmic voids. As it can be seen, there is a clear dependence of the mean number of galaxies on the overdensity threshold used to identify the voids. This dependence is stronger in the case of MDPL2-SAG, however, TNG300 follows the same trend. By using less restricted values, the HOD inside the voids becomes similar to that obtained in the complete catalogue. This dependence is in agreement with previous results presented by Zehavi et al. 2018, Artale et al. 2018 and Bose et al. 2019 who find evidence of occupancy variation when considering halo sub-samples taking into account their large-scale environment. However, it is worth to mention some important differences between their approach and our analysis. These authors characterize the environment using spherical volumes (Artale et al. 2018; Bose et al. 2019) or a Gaussian smoothing (Zehavi et al. 2018), both with a fixed scale of 5Mpc, and determine the local density for each dark matter halo. These criteria are substantially different than our spherical void definition, which involve large-scale underdensities with a fixed integrated density contrast, . A consequence of this definition is that, by construction, our voids have a lack of high mass haloes so that the internal void HOD is limited to a certain halo mass, as can be seen in Fig. 2 where the maximum halo mass that is achieved decreases with . For these reasons, given that the methodology and the halo mass range of HOD are different, a direct comparison between our results and those presented by Zehavi et al. 2018, Artale et al. 2018 and Bose et al. 2019 is not straightforward. As a final remark, in Fig. 2 can be seen that beyond halo masses of , the environmental differences become significant, reaching factors as large as 2 for .
Since the aim of this work is to study the behaviour of HOD in very low-density environments, thus we decide to use voids identified with . This selection is also justified by the fact that values of and (which represent 20% and 10% of the mean density of tracers, respectively) are widely used in spherical void finder algorithms in the literature (Padilla et al. 2005; Ceccarelli et al. 2006; Colberg et al. 2008, e.g.,).
4.2 HOD inside voids
Once value is fixed as , we compare the overall HOD with measurements inside voids for different band absolute magnitude thresholds, in order to analyze a possible dependence of the variation in the number of satellites in haloes inside voids with luminosity.
In Fig. 3 we compare the HOD inside voids and the overall results obtained on each catalogue for different absolute magnitude limits. The HOD inside voids is shown in red dashed lines and the overall HOD in black solid lines. The ratio between both is presented at the bottom of each panel. As it can be seen, for all magnitude thresholds ( to , from up to bottom), HOD inside voids is systematically lower for halo masses higher than and achieves differences up to . It is important to note that, for small halo masses, there are no significant differences in the HOD inside voids with respect to the general behaviour. This can be interpreted by considering the formation of the first-ranked galaxy of halos nearly independently of the environment, but with the satellite population differing due to their slower formation and accretion in the extreme low-density environment of cosmic voids. This result is in general agreement with Bose et al. 2019 who explore the HOD in TNG300 simulation.
We have further study HOD as a function of number density cuts instead of luminosity thresholds avoiding possible differences arising in the assignment of galaxy luminosities in the two simulated datasets. The results are given in Sec. A.2 where it can be seen that the differences between void and global environment remain the same than in Fig. 3 using luminosity thresholds.
We have also checked for systematics associated to boundary effects given that HOD is computed in spherical volumes. This was accomplished by randomizing void centre positions and recalculating HOD in these new volumes. For this randomly placed shperical volumes we recover the HOD behaviour of the overall halo sample, providing confidence in our results.
4.3 Dependence on voids radius
So far, we have seen that there is a clear distinction between the HOD inside cosmic voids as compared to the overall behaviour. In this section, we explore a possible dependence on a fundamental parameter of our void sample, namely the void radius.
We divide our samples into several void radius bins and compute the mean HOD in the different radius bins. We define four void sub-samples: Mpc, Mpc Mpc, Mpc Mpc and Mpc . In Fig. 4 we show the results for this analysis. For simplicity, we only present the results for two absolute magnitude thresholds for each galaxy catalogue, MDPL2-SAG on left panels and TNG300 on the right. The adopted absolute magnitude cuts are labelled on each panel. We notice that the results are consistent for all studied ranges of absolute magnitudes. In the figure, each sub-sample is represented by a different colour as indicated in the key figure (upper left panel).
As it can be clearly seen, within uncertainties there is not a significant dependence of the HOD behaviour on void radius . This is somewhat expected because, given our void definition, up to all voids have the same integrated density contrast independently of their size.
4.4 Dependence on void large scale environment
Another way to classify cosmic voids is to use their large-scale environment. According to Ceccarelli et al. 2013, voids can be divided into R-type and S-type voids, where the former are surrounded by large-scale under-dense regions, and the others are embedded into over-dense regions. This is expressed on void profiles and we use the maximum value of between to classify them. A void is classified as S-type if the value of is positive, while if is negative the void is labelled as R-type. Paz et al. 2013 show that this classification implies that the surrounding region surrounding R-types void is in expansion and, for S-type voids, in contraction.
In this section, we analyse the possibility that these dynamical differences can produce an imprint on the HOD behaviour within the void region. In Fig. 5 we show the results of this analysis. For simplicity, only HOD measurements for one absolute magnitude threshold are given for each catalogue, however the results are similar for the whole range of limiting magnitudes studied. R-type voids are presented in yellow triangles and S-type in green circles. Similarly to 4.3, we find no substantial difference between both void sub-samples.
From these results, we conclude that the effects that drive the changes of the HOD shape inside the voids are present in all cases, independently of void size or surrounding large-scale environment. Here again, we highlight the consistency between the semi-analytic model and the hydro-dynamical simulation results
5 Stellar mass content
HOD results obtained in the previous sections indicate that, for a dark matter halo with a given mass above , the number of galaxies decreases if the halo resides inside a cosmic void. In this section our aim is to investigate if galaxies in cosmic voids show a different stellar mass content than globally. The standard scheme is that the galaxy population can be divided into a central halo galaxy and their satellites. We follow this approach in our analysis.
In order to obtain comparable quantities than those obtained before, we compute the mean stellar mass content for galaxies in haloes of a given mass: . This quantity is calculated for both the central galaxy and the satellite population considering all galaxies with .
Fig. 6 shows the results for MDPL2-SAG and TNG300 catalogues on the right and left panels, respectively. As it can be seen in the upper panels, central galaxies in voids (red triangles) have a similar stellar content than the general population of central (dark squares) for both catalogues, meanwhile, satellite galaxies inside voids (light red triangles) show significantly lower values of with respect to the general behaviour of satellite galaxies (grey squares). These results can be clearly noticed in the bottom panels, where the ratio is around for central galaxies (red dashed lines) and for satellite galaxies (light red dotted lines).
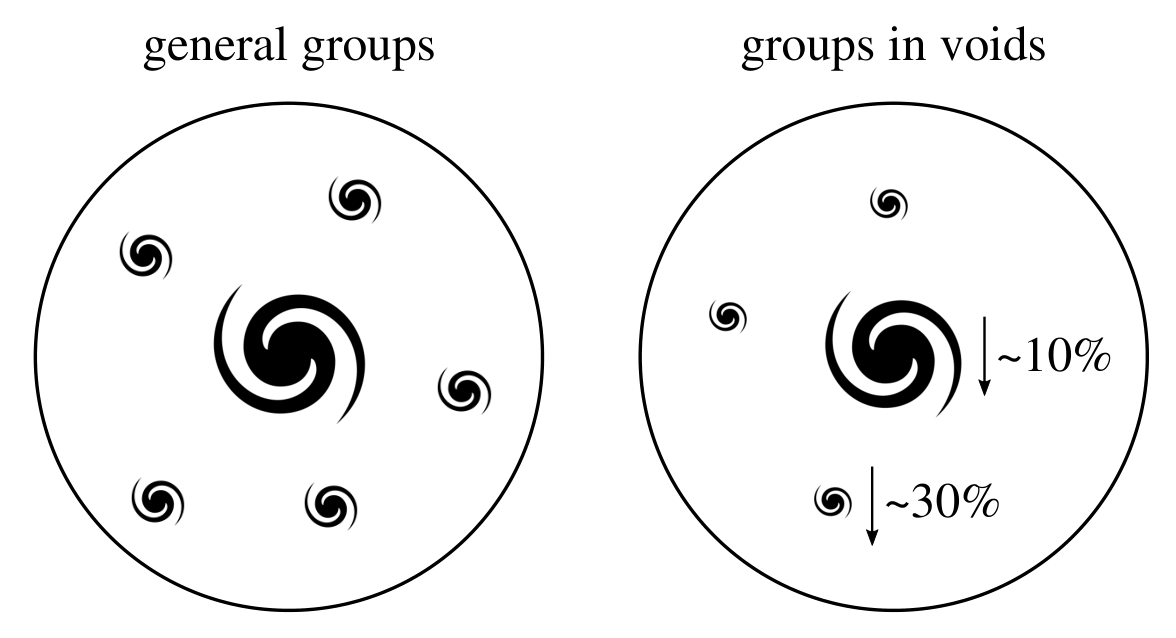
It is important to note that HOD and stellar mass content results are consistent for both galaxy catalogues and point out that a halo inside a cosmic void have fewer galaxies, and also each galaxy has a lower stellar mass content. These two main results are schematized in Fig. 7.
6 Haloes time formation in voids
In order to explore possible causes of the differences in the HOD inside cosmic voids, we study in both, MDPL2-SAG and TNG300-1 haloes catalogues, the distribution of , defined as the redshift at which half of the maximum of the halo mass has been accreted onto a halo for the first time. For this aim, we follow the formation history of each halo to determine its maximum mass and the redshift at which it has reached half of this value. We expect that the distribution of this parameter inside voids may differ to that in the complete catalogue and that this different merging history of the haloes populating voids be responsible for its distinct HOD.
Fig. 8 shows the cumulative fraction of for MDPL2-SAG (solid lines) and TNG300 (dashed lines) haloes. In both cases the distributions of in voids differ from the global behaviour in the same fashion. It is clearer in MDPL2-SAG than in TNG300, showing haloes inside voids (red lines) reaching half of their maximum mass at slightly lower redshifts than elsewhere (black lines). For this analysis we select as the interpolated redshift between the two closest snapshots where haloes achieve 50% of their maximum mass.
These results are consistent with those obtained in previous sections and provide hints that haloes within cosmic voids have a particular formation history with respect to other environments.
7 Summary and conclusions
The HOD links the galaxies with their host dark matter halo. In this work, we study it behaviour in the extremely low-density environments of cosmic voids. For this purpose, we use two simulated galaxy catalogues derived from the MDPL2-SAG semi-analytic model and the TNG300 hydrodynamic simulation. Although these catalogues have different galaxies luminosity function, void density tracers and are built from very different tools, the results obtained for both catalogues are entirely consistent with each other, so that the conclusions and discussions addressed in this section apply suitably to the two data-sets.
Following our definition of voids, we find a clear dependence of HOD on the environment. The differences increase as the value of the parameter lowers (more empty voids). However, we found that low mass haloes () lack variations in HOD, indicating that for these haloes the formation of the central galaxies is nearly independent of the large-scale environment density. For larger masses, haloes in sub-dense regions need more mass than average to increase their number of satellite galaxies.
In this work we use a threshold over-density parameter to define voids, a usually adopted value that presents the greater differences with respect to the global HOD. Our void measurements show that for different ranges of absolute magnitudes, the HOD is always below the overall results. However, the HOD in voids shows no dependence on void radius nor void large-scale environment. By definition, the interior regions of our voids always present the same integrated mass density, so that the lack of HOD dependence on the other parameters suggests that their primary dependence is on the large-scale density where halo/galaxies reside.
The lower HOD values inside the voids correspond to a smaller number of satellite galaxies per halo. The results of Sec. 5 also show that the average stellar mass per satellite is smaller by . Central galaxies are more similar although their stellar mass is smaller by . We conclude that the extreme low-density environment of voids affects more severely the accretion of satellite galaxies generating a population with the fewer satellites and with the lower average stellar mass.
Finally, the results of Sec. 6 show the haloes in voids exhibit lower values, so that void haloes are younger and may have undergone fewer interactions and mergers with other haloes. This fact could explain partially their difficulty in hosting satellite galaxies.
Acknowledgements.
We kindly thank to the anonymous Referee for his/her very useful comments and suggestions that helped to improve this paper. This work was partially supported by Agencia Nacional de Promoción Científica y Tecnológica (PICT 2015-3098, PICT 2016-1975), the Consejo Nacional de Investigaciones Científicas y Técnicas (CONICET, Argentina) and the Secretaría de Ciencia y Tecnología de la Universidad Nacional de Córdoba (SeCyT-UNC, Argentina). The authors gratefully acknowledge the Gauss Centre for Supercomputing e.V. (www.gauss-centre.eu) and the Partnership for Advanced Supercomputing in Europe (PRACE, www.prace-ri.eu) for funding the MultiDark simulation project by providing computing time on the GCS Supercomputer SuperMUC at Leibniz Supercomputing Centre (LRZ, www.lrz.de). The CosmoSim database used in this paper is a service by the Leibniz-Institute for Astrophysics Potsdam (AIP). The MultiDark database was developed in cooperation with the Spanish MultiDark Consolider Project CSD2009-00064. The IllustrisTNG project used in this work (TNG300) have been run on the HazelHen Cray XC40-system at the High Performance Computing Center Stuttgart as part of project GCS-ILLU of the Gauss centres for Supercomputing (GCS).References
- Artale et al. (2018) Artale, M. C., Zehavi, I., Contreras, S., & Norberg, P. 2018, MNRAS, 480, 3978
- Behroozi et al. (2013a) Behroozi, P. S., Wechsler, R. H., & Wu, H.-Y. 2013a, ApJ, 762, 109
- Behroozi et al. (2013b) Behroozi, P. S., Wechsler, R. H., Wu, H.-Y., et al. 2013b, ApJ, 763, 18
- Benson et al. (2000) Benson, A., Cole, S., Frenk, C., Baugh, C., & Lacey, C. G. 2000, MNRAS, 311, 793
- Berlind & Weinberg (2002) Berlind, A. A. & Weinberg, D. H. 2002, ApJ, 575, 587
- Berlind et al. (2003) Berlind, A. A., Weinberg, D. H., Benson, A. J., et al. 2003, ApJ, 593, 1
- Bose et al. (2019) Bose, S., Eisenstein, D. J., Hernquist, L., et al. 2019, MNRAS, 490, 5693
- Cautun et al. (2018) Cautun, M., Paillas, E., Cai, Y.-C., et al. 2018, MNRAS, 476, 3195
- Ceccarelli et al. (2008) Ceccarelli, L., Padilla, N., & Lambas, D. G. 2008, MNRAS, 390, L9
- Ceccarelli et al. (2006) Ceccarelli, L., Padilla, N. D., Valotto, C., & Lambas, D. G. 2006, MNRAS, 373, 1440
- Ceccarelli et al. (2013) Ceccarelli, L., Paz, D., Lares, M., Padilla, N., & Lambas, D. G. 2013, MNRAS, 434, 1435
- Colberg et al. (2008) Colberg, J. M., Pearce, F., Foster, C., et al. 2008, MNRAS, 387, 933
- Cooray & Sheth (2002) Cooray, A. & Sheth, R. 2002, Physics reports, 372, 1
- Cora (2006) Cora, S. A. 2006, MNRAS, 368, 1540
- Cora et al. (2018) Cora, S. A., Vega-Martínez, C. A., Hough, T., et al. 2018, MNRAS, 479, 2
- Gargiulo et al. (2015) Gargiulo, I. D., Cora, S. A., Padilla, N. D., et al. 2015, MNRAS, 446, 3820
- Guo et al. (2015) Guo, H., Zheng, Z., Zehavi, I., et al. 2015, MNRAS, 453, 4368
- Hoyle et al. (2005) Hoyle, F., Rojas, R. R., Vogeley, M. S., & Brinkmann, J. 2005, ApJ, 620, 618
- Hoyle et al. (2012) Hoyle, F., Vogeley, M. S., & Pan, D. 2012, MNRAS, 426, 3041
- Jing et al. (1998) Jing, Y., Mo, H., & Börner, G. 1998, ApJ, 494, 1
- Klypin et al. (2016) Klypin, A., Yepes, G., Gottlöber, S., Prada, F., & Heß, S. 2016, MNRAS, 457, 4340
- Knebe et al. (2018) Knebe, A., Stoppacher, D., Prada, F., et al. 2018, MNRAS, 474, 5206
- Kravtsov et al. (2004) Kravtsov, A. V., Berlind, A. A., Wechsler, R. H., et al. 2004, ApJ, 609, 35
- Lagos et al. (2008) Lagos, C. d. P., Cora, S. A., & Padilla, N. D. 2008, MNRAS, 388, 587
- Ma & Fry (2000) Ma, C.-P. & Fry, J. N. 2000, ApJ, 543, 503
- Marinacci et al. (2018) Marinacci, F., Vogelsberger, M., Pakmor, R., et al. 2018, MNRAS, 480, 5113
- Naiman et al. (2018) Naiman, J. P., Pillepich, A., Springel, V., et al. 2018, MNRAS, 477, 1206
- Nelson et al. (2018) Nelson, D., Pillepich, A., Springel, V., et al. 2018, MNRAS, 475, 624
- Padilla et al. (2005) Padilla, N. D., Ceccarelli, L., & Lambas, D. G. 2005, MNRAS, 363, 977
- Pan et al. (2012) Pan, D. C., Vogeley, M. S., Hoyle, F., Choi, Y.-Y., & Park, C. 2012, MNRAS, 421, 926
- Patiri et al. (2006) Patiri, S. G., Prada, F., Holtzman, J., Klypin, A., & Betancort-Rijo, J. 2006, MNRAS, 372, 1710
- Paz et al. (2013) Paz, D., Lares, M., Ceccarelli, L., Padilla, N., & Lambas, D. G. 2013, MNRAS, 436, 3480
- Peacock & Smith (2000) Peacock, J. & Smith, R. 2000, MNRAS, 318, 1144
- Peebles (1980) Peebles, P. J. E. 1980, The large-scale structure of the universe
- Pillepich et al. (2018a) Pillepich, A., Nelson, D., Hernquist, L., et al. 2018a, MNRAS, 475, 648
- Pillepich et al. (2018b) Pillepich, A., Springel, V., Nelson, D., et al. 2018b, MNRAS, 473, 4077
- Planck Collaboration et al. (2014) Planck Collaboration, Ade, P. A. R., Aghanim, N., et al. 2014, A&A, 571, A16
- Planck Collaboration et al. (2016) Planck Collaboration, Ade, P. A. R., Aghanim, N., et al. 2016, A&A, 594, A13
- Pujol & Gaztañaga (2014) Pujol, A. & Gaztañaga, E. 2014, MNRAS, 442, 1930
- Pujol et al. (2017) Pujol, A., Hoffmann, K., Jiménez, N., & Gaztañaga, E. 2017, A&A, 598, A103
- Riebe et al. (2013) Riebe, K., Partl, A. M., Enke, H., et al. 2013, Astronomische Nachrichten, 334, 691
- Rodriguez et al. (2015) Rodriguez, F., Merchán, M., & Sgró, M. A. 2015, A&A, 580, A86
- Rojas et al. (2004) Rojas, R. R., Vogeley, M. S., Hoyle, F., & Brinkmann, J. 2004, ApJ, 617, 50
- Rojas et al. (2005) Rojas, R. R., Vogeley, M. S., Hoyle, F., & Brinkmann, J. 2005, ApJ, 624, 571
- Ruiz et al. (2019) Ruiz, A. N., Alfaro, I. G., & Garcia Lambas, D. 2019, MNRAS, 483, 4070
- Ruiz et al. (2015a) Ruiz, A. N., Cora, S. A., Padilla, N. D., et al. 2015a, ApJ, 801, 139
- Ruiz et al. (2015b) Ruiz, A. N., Paz, D. J., Lares, M., et al. 2015b, MNRAS, 448, 1471
- Scoccimarro et al. (2001) Scoccimarro, R., Sheth, R. K., Hui, L., & Jain, B. 2001, ApJ, 546, 20
- Seljak (2000) Seljak, U. 2000, MNRAS, 318, 203
- Springel (2010) Springel, V. 2010, MNRAS, 401, 791
- Springel et al. (2018) Springel, V., Pakmor, R., Pillepich, A., et al. 2018, MNRAS, 475, 676
- Tecce et al. (2010) Tecce, T. E., Cora, S. A., Tissera, P. B., Abadi, M. G., & Lagos, C. d. P. 2010, MNRAS, 408, 2008
- Van Den Bosch et al. (2003) Van Den Bosch, F. C., Yang, X., & Mo, H. 2003, MNRAS, 340, 771
- Weinberger et al. (2017) Weinberger, R., Springel, V., Hernquist, L., et al. 2017, MNRAS, 465, 3291
- White & Rees (1978) White, S. D. & Rees, M. J. 1978, MNRAS, 183, 341
- Yang et al. (2007) Yang, X., Mo, H. J., van den Bosch, F. C., et al. 2007, ApJ, 671, 153
- Zehavi et al. (2018) Zehavi, I., Contreras, S., Padilla, N., et al. 2018, ApJ, 853, 84
- Zehavi et al. (2011) Zehavi, I., Zheng, Z., Weinberg, D. H., et al. 2011, ApJ, 736, 59
- Zentner et al. (2005) Zentner, A. R., Berlind, A. A., Bullock, J. S., Kravtsov, A. V., & Wechsler, R. H. 2005, ApJ, 624, 505
- Zheng et al. (2005) Zheng, Z., Berlind, A. A., Weinberg, D. H., et al. 2005, ApJ, 633, 791
- Zheng & Weinberg (2007) Zheng, Z. & Weinberg, D. H. 2007, ApJ, 659, 1
Appendix A Impact of number density in HOD deterinations
As described in Sec. 2.2, by imposing the same absolute magnitude cut in both galaxy catalogues, and given the differences in the luminosity functions, we obtain galaxy samples with different number densities. As a consequence, HOD are measured in galaxy populations with different number densities. Besides, voids identified using these galaxy tracers have also different number densities as a function of void sizes. In this appendix we explore the consequences in HOD measurements when we impose void and galaxy catalogues to have the same number density in both simulations.
A.1 Equal number density of voids limiting by void radius
Fig. 9 shows the volume number density of voids as a function of radius for TNG300 (green) and MDPL2-SAG (red). In the inset figure we also present the radii distribution for both voids catalogues. As it can be seen, the number densities of voids in both catalogues are different, however it is clear from the figure that if we take voids with Mpc, both samples are not only similar in density but also complete in void sizes.
To analyze both the effects of differences in galaxy number density and the lack of completeness on our HOD measurements, we give in Fig. 10 HOD measurements inside voids for the complete sample (circles) and that obtained considering only voids with Mpc (triangles). We perform this comparison for TNG300 (right panels) and MDPL2-SAG (left panels) catalogues for two absolute magnitude thresholds, and showin in the upper and lower panels, respectively. As it can be seen, by restricting the number density of voids cutting by void radius does not produce a significant change in the HOD determination. We conclude that both, the lack of completeness of small voids, and the differences in number density of voids between the catalogues, do not significantly affect the results of our work.
A.2 Equal number density of galaxies and voids
As mentioned above, we have identified voids and calculated the HOD using the same absolute magnitude thresholds. However, we can perform this analysis with the same number density of tracers in order to obtain a similar number density distribution of voids.
In Fig. 11 we show the volume number density of voids as a function of radius when the void identification is restricted to the same number density of tracers, , for both catalogues. The green curve corresponds to TNG300 and the red to MDPL2-SAG. The inset in the figure shows the radii distribution for both void samples. As it can be seen, these results differ from those presented in Fig. 9. As expected, now both void catalogues show the same volume number density and size distribution in the complete range of .
Using these new void catalogues, we use two cuts in number density of galaxies: and , which correspond to the number density of galaxies for and , respectively, from the Sloan Digital Sky Survey (Guo et al. 2015).
Fig 12 shows the comparison between the HOD inside voids (red dashed lines) with the overall results (black solid lines) for MDPL2-SAG (left panels) and TNG300 (right panels) catalogues. Small bottom panels show the ratio between HOD in voids and HOD in the complete sample. It is clear that the results are completely consistent with those obtained in the main part of this work, where we use fixed absolute magnitude cuts. It is worth to mention that the same behaviour is obtained for other equal number density cuts. We believe that it is simpler to use a luminosity threshold to compare the simulations and observational data as well, so our main studies were performed under this prescription.