The Tidal Disruption Event AT 2018hyz II: Light Curve Modeling of a Partially Disrupted Star2020The Tidal Disruption Event AT 2018hyz II: Light Curve Modeling of a Partially Disrupted Star–References
Abstract
AT 2018hyz (=ASASSN-18zj) is a tidal disruption event (TDE) located in the nucleus of a quiescent E+A galaxy at a redshift of , first detected by the All-Sky Automated Survey for Supernovae (ASAS-SN). We present optical+UV photometry of the transient, as well as an X-ray spectrum and radio upper limits. The bolometric light curve of AT 2018hyz is comparable to other known TDEs and declines at a rate consistent with a at early times, emitting a total radiated energy of erg. An excess bump appears in the UV light curve about 50 days after bolometric peak, followed by a flattening beyond 250 days. We detect a constant X-ray source present for at least 86 days. The X-ray spectrum shows a total unabsorbed flux of erg cm-2 s-1 and is best fit by a blackbody plus power-law model with a photon index of . A thermal X-ray model is unable to account for photons keV, while a radio non-detection favors inverse-Compton scattering rather than a jet for the non-thermal component. We model the optical and UV light curves using the Modular Open-Source Fitter for Transients (MOSFiT) and find a best fit for a black hole of M⊙ disrupting a M⊙ star; the model suggests the star was likely only partially disrupted, based on the derived impact parameter of . The low optical depth implied by the small debris mass may explain how we are able to see hydrogen emission with disk-like line profiles in the spectra of AT 2018hyz (see our companion paper, Short et al. 2020).
Keywords:
galaxies: nuclei – black hole physics – transients: tidal disruption events1 Introduction
A tidal disruption event (TDE) can occur when a star gets too close to a supermassive black hole such that the tidal forces from the black hole exceed the self-gravity of the star, eventually tearing it apart (Hills 1975; Rees 1988). Following this disruption, the material from the star is expected to circularize into an accretion disk, and a fallback accretion phase begins, powering an optical transient (Gezari et al. 2009; Guillochon et al. 2009). There are about 60 known TDEs, showing a wide gamut of observational features (Auchettl et al. 2017; Mockler et al. 2019; van Velzen et al. 2020). Some exhibit hydrogen and helium emission, while others only helium (Gezari et al. 2012; Arcavi et al. 2014). More recently, TDEs with nitrogen and oxygen lines, powered by Bowen fluorescence, have been detected (Blagorodnova et al. 2019; Leloudas et al. 2019). van Velzen et al. 2020 defined three classes: TDE-H (hydrogen only), TDE-He (helium only) and TDE-Bowen (Bowen lines in combination with H and/or He). At least one TDE has evolved from showing hydrogen and Bowen lines to helium-only (Nicholl et al. 2019). Some TDEs show X-ray emission in excess of the optical luminosity, while others are X-ray dim (Holoien et al. 2016a; Auchettl et al. 2017). Additionally, radio observations suggest a few TDEs drive relativistic outflows, while others do not (Zauderer et al. 2011; Bower et al. 2013; van Velzen et al. 2013; Alexander et al. 2016).
In this paper we present radio, optical, UV, and X-ray observations of AT 2018hyz, originally discovered as a nuclear optical transient by the All-Sky Automated Survey for Supernovae (ASAS-SN; Shappee et al. 2014; Kochanek et al. 2017) on 2018 Nov 6 and designated ASASSN-18zj (Brimacombe & Stanek 2018). The transient was classified as a TDE on 2018 Nov 9 by Dong et al. 2018 and independently verified by Arcavi 2018 on 2018 Nov 12. van Velzen et al. 2020 first presented optical+Swift photometry of AT 2018hyz. The authors classify it as a TDE-H, one with broad H and H lines. The early hydrogen-dominated spectrum transitions to being helium dominated (Short et al. 2020). The spectra are also blue and show broad double-peaked emission lines that evolve in shape, from a smooth broad profile, to boxy, and then smooth again. For an in-depth description of the spectra see Short et al. 2020.
In §2 we describe the host galaxy of AT 2018hyz. In §3 we present our follow-up observations and describe the publicly available observations of AT 2018hyz. In §4 we present our modeling of the light curve. In §5 we outline different properties of the light curves, and in §6 we outline our key conclusions. Throughout this paper we assume a flat CDM cosmology with km s-1 Mpc-1, , and (Hinshaw et al. 2013).
2 Host Galaxy
From an archival SDSS spectrum, we see that AT 2018hyz is found in the nucleus of a quiescent E+A galaxy (Short et al. 2020). It is unsurprising to see a TDE in this galaxy, since it has been shown that TDEs tend to be over-represented in these types of galaxies by a factor of (Arcavi et al. 2014; French et al. 2016; Graur et al. 2018). van Velzen et al. 2020 modeled the host galaxy photometry (Table 1) with Prospector (Leja et al. 2017) and find a host mass of , a stellar population age of Gyr and a metallicity of .
We model the host’s SED in order to derive its magnitude in the UVOT bands. We performed photometry on images of the host from SDSS and , using a aperture for all filters. We generated templates based on the Bruzual & Charlot 2003 stellar population-synthesis models with the Chabrier initial mass function (Chabrier 2003, IMF;). The star formation history (SFH) was approximated by a declining exponential function of the form , where is the age of the stellar population and the e-folding time-scale of the SFH (varied in nine steps between 0.1 and 30 Gyr). These templates were attenuated with the Calzetti et al. 2000 model that we varied in 22 steps from to 1 mag. The best-fitting templates were identified from minimization. Excluding NIR photometry (due to contamination by a nearby red star), we find a mass , in broad agreement with van Velzen et al. 2020, and negligible current star formation. The limits on star formation rate of M⊙ yr-1 placed by our ALMA non-detections rule out obscured star-formation, in agreement with the current classification as an E+A galaxy and the lack of star-formation inferred from our model fit. We convolve the SED of the best-fitting templates with the UVOT passbands to derive the estimated magnitude of the host in these bands, shown in Table 1.
3 Observations
3.1 Optical and UV Photometry
| Value | Units | |
| NUV | mag ( GALEX) | |
| mag ( SDSS ) | ||
| mag ( SDSS ) | ||
| mag ( 3PI ) | ||
| mag ( SDSS ) | ||
| mag ( 3PI ) | ||
| mag ( SDSS ) | ||
| mag ( 3PI ) | ||
| mag ( 3PI ) | ||
| mag ( SDSS ) | ||
| mag ( 3PI ) | ||
| V | 17.09 | model mag |
| B | 17.74 | model mag |
| U | 19.12 | model mag |
| UVW1 | 20.73 | model mag |
| UVM2 | 21.31 | model mag |
| UVW2 | 21.76 | model mag |
AT 2018hyz was first detected by ASAS-SN on 2018 Oct 14 with a magnitude of and a prior non-detection of on 2018 Oct 10, with no previous deeper upper limits (Shappee et al. 2014; Kochanek et al. 2017). ASAS-SN observed AT 2018hyz regularly until 2019 Jun 27 and provided and V band measurements of the source. The ASAS-SN photometry used in this work was obtained from the ASAS-SN Sky Patrol database 11 1 https://asas-sn.osu.edu/. We average the ASAS-SN photometry on bins of 1 day and only make use of the data before and during peak (extending to ) due to a large observed scatter in the later data.
The UV-Optical Telescope (UVOT; Roming et al. 2005) on board the Neil Gehrels Swift observatory (Swift; Gehrels et al. 2004) regularly observed AT 2018hyz from 2018 Nov 10 until 2019 March 07 with a cadence of about 3 days, with further observations extending to 2019 July 08 until the source became sun-constrained (ObsID: 000109750[01-38]). We requested an additional late-time epoch and observed the source on 2020 May 22, 28 and 31. We determined the magnitude of AT 2018hyz by performing aperture photometry with the HEAsoft uvotsource function (Heasarc 2014). We use a aperture centered on the target to extract UVW2, UVM2, UVW1, U, V, and B transient+host magnitudes and a region to determine background statistics.
In order to isolate the magnitude of the transient, we subtract the magnitude of the host galaxy from each UVOT and ASAS-SN measurement in the corresponding filter, calculated in §2. All the photometry reported in this work is calibrated to AB magnitudes.
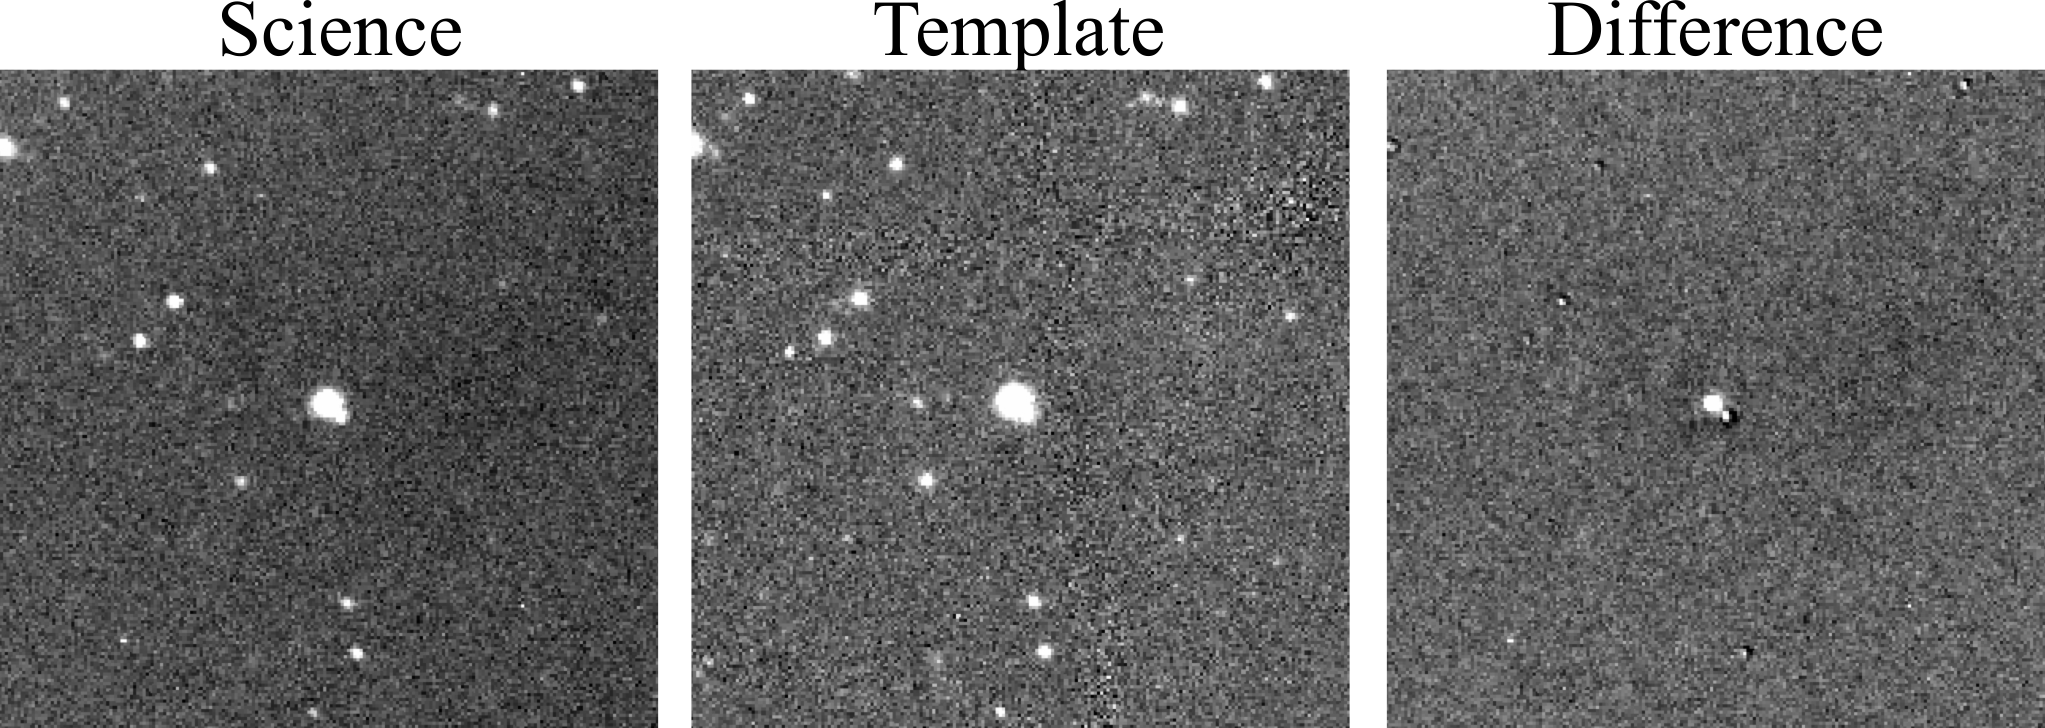
We obtained images of AT 2018hyz in filters using KeplerCam on the 1.2-m telescope at Fred Lawrence Whipple Observatory (FLWO) and the Las Cumbres Observatory’s network of 1m telescopes (Brown et al. 2013). We processed the images using standard IRAF22 2 IRAF is written and supported by the National Optical Astronomy Observatories, operated by the Association of Universities for Research in Astronomy, Inc. under cooperative agreement with the National Science Foundation. routines, and performed photometry with the daophot package. Instrumental magnitudes were measured by modeling the point-spread function (PSF) of each image using reference stars in the image. For calibration, we estimated individual zero-points of each image by measuring the magnitudes of field stars and comparing to photometric AB magnitudes from the PS1/ catalog. The uncertainties reported in this work are the combination of the photometric uncertainty and the zero-point determination uncertainty. To isolate AT 2018hyz from its host galaxy we perform image subtraction on each image using HOTPANTS (Becker 2015). We use archival PS1/ images as reference templates (Chambers & Pan-STARRS Team 2018); an example is shown in Figure 1.
We note there is a red star away from the center of the host galaxy. After performing image subtraction and PSF photometry on the resulting image, we do not detect contamination from the star in the optical bands. Given that this star is brightest in band, and mag fainter in band, we assume minimal to null contamination in the Swift bands. This star does however pose a major contamination problem in infrared photometry, which we do not include in our analysis.
All the ASAS-SN, UVOT, FLWO and Las Cumbres data were corrected for Milky Way galactic extinction using mag, determined using the Schlafly & Finkbeiner 2011 dust maps. The photometry was then corrected to the rest frame from and shifted in time to define phase 0 as the date of peak bolometric brightness, . All the optical+UV photometry used for this work is shown in Figure 2 and 3. The individual FLWO, Las Cumbres, and UVOT data are available in machine readable format in the online version of this journal and on the Open TDE Catalog 33 3 https://tde.space/ (Guillochon et al. 2017).
3.2 Astrometry
AT 2018hyz is located in the nucleus of 2MASS J10065085+0141342, a galaxy at a redshift of or a luminosity distance of Mpc. We performed astrometry on an FLWO -band image by cross-matching the positions of field stars in the image to the ICRS coordinates from Gaia-DR2 (Gaia Collaboration et al. 2016; Gaia Collaboration et al. 2018). We measure the centroid of AT 2018hyz on template subtracted images to be R.A.=, decl.= (J2000), with a centroid uncertainty of . We perform relative astrometry to measure the separation between AT 2018hyz and the center of its host galaxy. Using a pre-explosion template from archival PS1/ images as reference, and 10 template subtracted FLWO -band images to measure the position of AT 2018hyz. The resulting offset is , equivalent to a physical separation of kpc, consistent with the transient being nuclear. Where the uncertainty is the combination of the astrometric error and the scatter in the measured position among different images.
3.3 Radio and Millimeter Observations
We obtained millimeter observations with the Atacama Large Millimeter/submillimeter Array (ALMA) in Band 3 ( GHz) on 2018 November 28 and December 19 with a total on-source integration time of 22.2 minutes per epoch. We report the results of the ALMA data products which used J1058+0133 for bandpass and flux density calibration and J1010-0200 for complex gain calibration. The November 28 and December 19 epochs were imaged using 840 and 378 pixels, respectively, with an image scale of 0.13 and 0.29 arcsec per pixel, corresponding to a synthesized beam size of and , respectively. The images were created using multi-frequency synthesis (MFS; Sault & Wieringa 1994), Briggs weighting with a robust parameter of 0.5, and a standard gridding convolution function. The source is not detected in either epoch with a limit of and Jy for the November and December observations, respectively. This corresponds a to very low star formation rate of M⊙ yr-1 (Kennicutt 1998).
Four hours of AMI-LA 15.5 GHz observations revealed no radio source at the location of the transient, corresponding to a 3 upper limit of Jy on 2018 Nov 15 (Horesh et al. 2018). This upper limit corresponds to a luminosity erg s-1, slightly deeper than the radio detections for ASASSN-14li, possibly a jetted TDE (van Velzen et al. 2016; Alexander et al. 2016). Our limits are comparable to some of the deepest radio upper limits for other TDEs, such as AT 2018zr (van Velzen et al. 2019a) and AT 2017eqx (Nicholl et al. 2019), though shallower than iPTF16fnl (Blagorodnova et al. 2017); these had no detected radio counterparts.
ASASSN-14li has a ratio of total thermal energy to jet energy of (van Velzen et al. 2016). If AT 2018hyz has a similar ratio, the total optical+UV energy of erg in AT 2018hyz would imply a jet energy of erg. Our radio non-detection of AT 2018hyz suggests that any outflow may have been less energetic than that in ASASSN-14li; however, a lower ambient density or larger off-axis observing angle could also be responsible for the lower radio luminosity in this event.
3.4 X-ray Observations
AT 2018hyz was observed by the X-ray Telescope (XRT) onboard Swift (Burrows et al. 2005). We reduced the Swift-XRT data following the prescriptions by Margutti et al. 2013 with HEAsoft v6.26.1 and corresponding calibration files. We apply standard filtering criteria and bin the data into four separate epochs to estimate the source count-rate evolution with time. An X-ray source is detected in three epochs up to a phase of 86 days, while the source is not detected after binning all the data from a phase of 86 to 232 days. The upper limit obtained from the last bin is shallower that the previous detection and is therefore unconstraining, the flux-calibrated X-ray light curve is shown in Figure 3. An additional 3ks observation obtained in 2020 May (phase days) yielded a non-detection with an unconstraining upper limit of erg cm-2 s-1.
We do not find evidence for a statistically significant spectral evolution of the source. We extract a spectrum comprising the data at days to constrain the spectral properties of the source and the count-to-flux conversion factor. We fit the keV spectrum with a single absorbed power-law model with XSPEC and find a best fit photon index of with no evidence for intrinsic absorption. We also fit the X-ray spectrum with a single blackbody and find a best fit temperature of T keV, this model is unable to account for high energy photons above keV, and is therefore disfavored. In Figure 4 we show our preferred model, where we fit the spectrum with a blackbody component and an additional power law to account for the high energy photons. For this model we find a best fit to the blackbody component of T keV, and a photon index of . We adopt a redshift of and a neutral hydrogen column density along the line of sight to AT 2018hyz of NH cm-2 (Kalberla et al. 2005). The total unabsorbed flux is erg cm-2 s-1 ( errors). For this spectrum, the count-to-flux conversion factor is erg cm-2 counts-1.
Most TDEs show a decline in their X-ray light curve (Auchettl et al. 2017). Other TDEs, such as ASASSN-15oi, show a flat X-ray light curve with a subsequent late-time X-ray brightening. Early observations of ASASSN-15oi by Holoien et al. 2016b can not rule out a low-luminosity AGN; while late observations of the same source from Gezari et al. 2017 show brightening consistent with the X-ray emission from a thermal accretion disk from the TDE. AT 2018fyk is another example of a TDE with a flat X-ray light curve with a subsequent brightening (Wevers et al. 2019). The X-ray luminosity of AT 2018hyz is not declining, but consistent with being flat. The X-rays in AT 2018hyz are also consistent with an AGN (Aird et al. 2015); given that the measured luminosity of erg s-1 is of the Eddington luminosity for the inferred black hole mass of M⊙ (See §4 and Short et al. 2020 for a description of the mass estimates).
The ratio between the [O III] and hard (2-20 keV) X-ray luminosity functions of AGNs is dex (Heckman et al. 2005). The host of AT 2018hyz has an archival spectrum from the Sloan Digital Sky Survey (SDSS), with emission line fluxes from the Portsmouth emission line Value Added Catalog (Thomas et al. 2013). Using the power law component from our model for the X-rays with , and the host galaxy [O III] flux of erg cm-2 s-1, we find . This confirms the X-ray luminosity is consistent with an AGN, and that future temporal variability will be required to determine whether it is of AGN or TDE origin.
We compare the power-law index and luminosity of AT 2018hyz to the sample of sources from Auchettl et al. 2017, and see that AT 2018hyz is similar to other confirmed or likely X-ray TDEs. Auchettl et al. 2017 suggest that TDEs can separate into thermal TDEs without a jet, and non-thermal TDEs with a jet. Given the fact that AT 2018hyz has a non-thermal spectrum, that would be indicative of the presence of a jet, or inverse-Compton scattering of X-ray photons from the accretion disk. We fail to detect a jet in radio observations, but future temporal evolution will distinguish whether the X-ray emission is indeed dominated by the TDE or if it is a weak pre-existing AGN.
In Figure 5 we show a broadband SED with the X-ray spectra and best fit model compared to the optical photometry and radio upper limits. We do not account for self-absorption in our extrapolation, however this is reasonable over this frequency range. ASASSN-14li showed a self-absorbed synchrotron spectrum with a peak that moved from GHz to GHz (Alexander et al. 2016), i.e. the turnover was at all times below the frequencies of our radio upper limits. The SED slope measured in radio observations of ASASSN-14li was (compared to for the X-ray model fit to AT 2018hyz). Using a steeper power-law more similar to ASASSN-14li would give a larger discrepancy between the model prediction and our radio upper limits. Thus the radio limits appear to favour inverse-Compton scattering for the non-thermal X-rays.

4 Light Curve Modeling
We model the light curves of AT 2018hyz using the TDE model in the MOSFiT Python package, a Markov chain Monte Carlo (MCMC) code designed to model the light curves of transients using a variety of different power sources (Guillochon et al. 2018). The TDE model in MOSFiT estimates the output luminosity by converting the input fallback rate of material from the disrupted star into radiation via an efficiency parameter. The model also takes into account a normalization and power-law exponent for the photosphere. An impact parameter determines whether the star was partially or entirely disrupted. And a viscous timescale defines how fast the accretion disk forms around the black hole. Lastly, to estimate the magnitude of the transient in each observed band, MOSFiT assumes a blackbody SED that is convolved with the passband of each filter. The full details of the TDE model are described in Mockler et al. 2019. It should be noted that the use of MOSFiT is motivated by speed considerations, which allows us to explore a wide parameter space, but requires the use of simple one-zone models that are not overly complex.
We run the MCMC using an implementation of the emcee sampler (Foreman-Mackey et al. 2013) and test for convergence by ensuring that the models reach a potential scale reduction factor of (Gelman & Rubin 1992), which corresponds to about 2000 steps with 200 walkers. The best-fit parameters of the TDE model with the corresponding statistical confidence intervals on the fit are shown in Table 2. Figure 6 shows the best model realizations and Figure 7 shows the corresponding correlation among the most relevant parameters.
The uncertainties presented in this work represent only the statistical model uncertainties. Mockler et al. 2019 quantify the systematic uncertainties of the MOSFiT TDE model to be dex for the mass of the star, and dex for the mass of the black hole. These uncertainties come mostly from the uncertainty in the mass-radius relation assumed for the disrupted star. The systematic uncertainties of the other parameters being fit are shown in Table 2.
These parameters were not fit for, but were calculated using all the posterior distribution samples of the fitted parameters.
| Parameter | Prior | Best Fit | Best Fit | Systematic | Units |
|---|---|---|---|---|---|
| (All data) | (Excluding UV) | Error | |||
| M⊙ | |||||
| dex | M⊙ | ||||
| days | |||||
| dex | |||||
| days | |||||
| cm-2 | |||||
| mag |

From the MOSFiT model we derive an estimated disruption date of . We find the best model is that of a black hole of M⊙ partially disrupting a star of M⊙. A black hole mass consistent with the value of M⊙ found by Hung et al. 2020. A star is considered partially disrupted when a core remains post-disruption, and fully disrupted when the mass bound to the black hole is greater than half the total mass of the star. The impact parameter (the tidal radius over the pericenter orbit of the star) is reparametrized in MOSFiT in terms of the parameter , due to the fact that this varies with the polytrope index of the star and the fraction of mass bound to the black hole. For stars M⊙, MOSFiT assumes a polytropic index of (Mockler et al. 2019). A value of represents a full disruption of the star, while signifies no disruption. For AT 2018hyz we find a value of (), making this the least disrupted star in the TDE sample of Mockler et al. 2019, with the next lowest value being for TDE1. We caution that the systematic uncertainty for in MOSFiT is , which would allow to vary anywhere from a minimal disruption to a more significant disruption with . A full hydrodynamical simulation might be able to confirm if this is the case.
In order to test the robustness of the model and explore its dependence on the UV-bump we run an identical model that excludes the UV data from the fit. With the exception of the photosphere radius, we find the relevant parameters shown in Figure 7 to be in good agreement with the model of the full data set, both shown in Table 2.
Ryu et al. 2020 simulate a series of stars of different masses being disrupted by a M⊙ black hole, similar to the one in AT 2018hyz. The authors find that for a M⊙ star (their closest model to our best inferred mass of M⊙), an impact parameter of corresponds to of the star surviving the disruption. For AT 2018hyz, this would correspond to a disrupted mass of M⊙. For comparison, PS1-11af, a TDE that resulted from the partial disruption of a star (Chornock et al. 2014), has a and a minimum stripped mass of M⊙. Ryu et al. 2020 also find that for this model the decline rate at late times is closer to . We show in Figure 10 how the corresponding fit is roughly consistent with the AT 2018hyz light curve at late times.
For a black hole mass of M⊙ disrupting a M⊙ star, the implied pericenter of the encounter is (or for M M⊙), given the impact parameter of . The hydrogen emission lines from the accretion disk imply an orbital radius of material emitting at (Short et al. 2020). The models of Bonnerot & Lu 2020 show that the size of the accretion disk in a TDE is . For AT 2018hyz, the observed emission lines are consistent with this model, but would point towards a smaller black hole mass. For our best estimate of M⊙, , while for the lower mass black hole estimate of M⊙ the radius of the disk would be closer to .
Short et al. 2020 find a supermassive black hole mass in the range of M⊙, obtained from assuming different M- relations, lower than the mass estimate of M⊙ we obtain from MOSFiT; which is most similar to the estimate obtained from the McConnell & Ma 2013 M MBH relation of M⊙. The peak bolometric luminosity of AT 2018hyz is erg s-1, corresponding to for a M⊙ black hole; this is a typical Eddington ratio for TDE light curve models (see Table 6 in Mockler et al. 2019).
5 Observed Properties of the Light Curves
To obtain the bolometric light curve of AT 2018hyz we first bin the light curve on three day intervals to be able to generate individual SEDs for each epoch to which we fit a blackbody. For the bins that are missing one or more bands we estimate the missing value by interpolating the full light curves with a 5th or 6th degree polynomial in order to trace the non-monotonic structure of the light curves. We fit a blackbody to each epoch (Figure 8) to measure the bolometric temperature and radius. We estimate the flux outside the observed bands by extrapolating the blackbody fit. We then integrate the entire SED to generate a bolometric light curve. The resulting bolometric light curve, radius and temperature evolution are shown in Figure 9.
We calculate the total radiated energy of AT 2018hyz from a phase of 0 to 233 days to be erg, obtained by integrating the bolometric light curve shown in Figure 9. For the data before a phase of 0 days we lack color information, and therefore estimate the values of luminosity, radius, and temperature from the inferred MOSFiT models described in section 4. We estimate the total radiated energy before phase of 0 days to be erg. This gives a total radiated energy of erg for AT 2018hyz. Similarly, from fitting an empirical model to the light curve, van Velzen et al. 2020 find a peak luminosity of , a mean temperature of , and a peak date of MJD.
We measure a peak temperature of K near phase 0, which decreases to K at a phase of 50 days, and then rises back up to K until a phase of 150 days (Figure 9). The TDE models from Mockler et al. 2019 show a similar increase in temperature at later times. Lodato & Rossi 2011 demonstrate that for an opaque radiatively-driven wind, photons are released at a photospheric radius much larger than the launching radius, and as the accretion rate decreases, the photosphere sinks in, and the corresponding temperature increases. A good example of this process might be the TDE ASASSN-14ae (Holoien et al. 2014), which shows a temperature evolution that resembles that of AT 2018hyz, shown in Figure 9.
In Figure 10 we show the bolometric light curve of AT 2018hyz as compared to other TDEs, and see that it is similar in luminosity and decline rate to some TDEs. The early time bolometric light curve (phase days) is well fit by a power law that falls as , the theoretical decline rate expected for TDEs (Rees 1988). After a phase of 50 days the bolometric light curve deviates from a decline, and we see a bump that lasts for days, most pronounced in the UV. The TDE candidate ASASSN-15lh also shows a similar bump in the late time light curve, although much more pronounced than in AT 2018hyz (Leloudas et al. 2016). It should be noted that although ASASSN-15lh originated in the nucleus of a quiescent galaxy, it is a highly unusual event of uncertain nature, also suggested to be a superluminous supernova (Dong et al. 2016). Swift J1644+5734 is another TDE that shows a bump in its light curve 30-50 days after peak, most prominent in bluer bands, same as for AT 2018hyz. AT 2018fyk also has a secondary optical bump (Wevers et al. 2019), where the authors suggest that the second bump might be powered by efficient reprocessing of X-rays from a variable super-Eddington disk wind. One possible explanation for the bump in the bolometric light curve of AT 2018hyz is the mechanism outlined in Leloudas et al. 2016. Those authors suggest that the light curves of TDEs are powered by two mechanisms: circularization of the debris, and accretion onto the black hole. For the smaller supermassive black holes, it is hard to disentangle these two; but for the most massive black holes ( M⊙), the accretion disk will be thin, increasing the viscous timescale, allowing accretion to be observed in the form of a secondary peak in the light curve.
While only a few TDEs show a resolved secondary bump, many have now shown a flattening on timescales of hundreds of days after disruption; both at low black hole mass M⊙ (van Velzen et al. 2019b) and at more typical masses, for example ASASSN-14li ( M⊙; Brown et al. 2017), ASASSN-18pg ( M⊙; Holoien et al. 2020), and AT 2018zr ( M⊙; van Velzen et al. 2019a). This flattening is likely due to an additional contribution of emission from the accretion disk. AT2018hyz shows both a secondary bump at around 50 days, and a flattening of the light curve at days. If the late-time flattening indicates the formation of a thick accretion disk, we may need another mechanism to account for the earlier bump.
Instead, the flattening in AT 2018hyz could be produced by a sudden outflow of material; supported by the fact that the time the flattening beings coincides with the appearance of two spectral lines blueshifted from H and H by km s-1, respectively (Short et al. 2020). Additionally, the rise in temperature observed in AT 2018hyz corresponds to the emergence of He II lines in the spectra, which develop after a phase of days and were suggested to be related to an outflow or material or colliding debris (Short et al. 2020). If this is the case for AT 2018hyz, it would be late compared to outflows launched from other TDEs, such as AT 2018fyk, which showed a plateau 40 days after discovery, explained by either stream-stream collisions or subsequent accretion after the main peak (Wevers et al. 2019). For comparison, ASASSN-14li showed an outflow which was estimated to be launched 20-30 days before its bolometric peak (Alexander et al. 2016).
Adopting a total disrupted mass of M⊙ and a photospheric blackbody radius of cm during the light curve peak (Figure 9), we measure the average density of material behind the photosphere to be g cm-3, which implies an optical depth (for an opacity dominated by electron scattering in ionized hydrogen cm2 g-1). At later times, after the photosphere contracts to cm, the corresponding optical depth is . The low optical depth at early times might allow us to peer deep into the TDE, allowing us to see disk signatures (double-peaked Balmer emission lines) more clearly than in other TDEs (Short et al. 2020). The increasing optical depth may help to explain why we no longer see disk-like line profiles beyond days.
As noted, the UV brightness in a late-time Swift observation taken at a phase of days suggests a relatively flat light curve between days. The measured magnitude is brighter than we would expect from the MOSFiT model shown in Figure 6, and the expected model host photometry, listed in Table 3. Given that we know AT 2018hyz to harbor an accretion disk from the spectroscopic observations of Short et al. 2020, the fact that we see a flat UV light curve at late times supports the interpretation of van Velzen et al. 2019b that late-time UV emission observed in TDEs is produced by long-term accretion. The integrated UV luminosity at this phase is erg s-1, which corresponds to an accretion rate M⊙ yr-1 assuming an efficiency .
| Swift Band | Photometry | MOSFiT Model | Host Model |
|---|---|---|---|
| (542d) | |||
| UVW2 | 21.76 | ||
| UVM2 | 21.31 | ||
| UVW1 | 20.73 | ||
| U | 19.12 |
6 Conclusions and Discussion
AT 2018hyz is a tidal disruption event found in the nucleus of a quiescent E+A galaxy at a redshift of . We presented optical and UV photometry of AT 2018hyz from UVOT, ASAS-SN, FLWO, and Las Cumbres, representing one of the best sampled TDE light curves in the literature (in addition to densely sampled spectroscopic observations, presented in Short et al. 2020), allowing us to study its evolution in detail.
We modeled the light curves using MOSFiT and find a best fit for a M⊙ black hole disrupting a M⊙ star. Comparing to other similar MOSFiT models of TDEs we find AT 2018hyz to have the least disrupted star compared to the Mockler et al. 2019 sample, with an impact parameter of just . This corresponds to an inferred total disrupted mass of M⊙. A low disrupted mass may produce a low optical depth, which in turn allows us to see the accretion disk spectra with less reprocessing than other TDEs, which we observe in the form of double peaked hydrogen emission lines (Short et al. 2020).
We detect a bump in the bolometric light curve after a phase of 50 days, most prominent in the UV, which could be due to a sudden outflow of material or reprocessing of X-rays into optical/UV radiation. This is consistent with the emergence of He II lines in the spectra and an increase in the bolometric temperature. We detect a strong UV-excess at a phase of days. Given that we know AT 2018hyz has an accretion disk, evidenced by its spectra (Short et al. 2020); this supports the interpretation of van Velzen et al. 2019b that suggests late-time UV excess in TDEs is produced by late-time accretion.
An X-ray source is detected up to a phase of 86 days, consistent with having a constant luminosity. The X-ray spectra can not be explained by a simple blackbody, but instead we find a best fit to an absorbed blackbody plus power-law model with a photon index of . A non-thermal X-ray spectrum is expected for jetted TDEs. Extending the power-law component of the X-ray model to radio wavelengths predicts a radio flux in excess of our limits (Jy), thus the non-detection in the radio seems to favour inverse-Compton scattering for the non-thermal X-rays.
We consider three possible origins for the X-ray emission: the TDE itself, a pre-existing AGN, or star-formation. The latter can be excluded due to the negligible ongoing star-formation inferred from our radio data and host SED fitting. The X-rays could be consistent with a weak AGN given the measured luminosity, but temporal evolution in future deep X-ray observations will allow us to determine the nature of the X-ray emission.
The rich dataset we have presented and the finding of a very low disrupted mass indicates a new way to account for the diversity in observed TDEs.
Acknowledgements
We thank B. Mockler for useful discussions regarding the MOSFiT TDE model and an anonymous referee for comments towards the improvement of this paper. The Berger Time-Domain Group at Harvard is supported in part by NSF under grant AST-1714498 and by NASA under grant NNX15AE50G. S. Gomez is partly supported by an NSF Graduate Research Fellowship. MN is supported by a Royal Astronomical Society Research Fellowship. KDA acknowledges support provided by NASA through the NASA Hubble Fellowship grant HST-HF2-51403.001 awarded by the Space Telescope Science Institute, which is operated by the Association of Universities for Research in Astronomy, Inc., for NASA, under contract NAS5-26555. IA is a CIFAR Azrieli Global Scholar in the Gravity and the Extreme Universe Program and acknowledges support from that program, from the Israel Science Foundation (grant numbers 2108/18 and 2752/19), from the United States - Israel Binational Science Foundation (BSF), and from the Israeli Council for Higher Education Alon Fellowship. Operation of the Pan-STARRS1 telescope is supported by the National Aeronautics and Space Administration under grant No. NNX12AR65G and grant No. NNX14AM74G issued through the NEO Observation Program. This work has made use of data from the European Space Agency (ESA) mission Gaia (https://www.cosmos.esa.int/gaia), processed by the Gaia Data Processing and Analysis Consortium (DPAC, https://www.cosmos.esa.int/web/gaia/dpac/consortium). Funding for the DPAC has been provided by national institutions, in particular the institutions participating in the Gaia Multilateral Agreement. This paper includes data gathered with the 6.5 meter Magellan Telescopes located at Las Campanas Observatory, Chile. Observations reported here were obtained at the MMT Observatory, a joint facility of the University of Arizona and the Smithsonian Institution. This research has made use of NASA’s Astrophysics Data System. This research has made use of the SIMBAD database, operated at CDS, Strasbourg, France. Additional software used for this paper: Astropy(Astropy Collaboration et al. 2018), PyRAF(Science Software Branch at STScI 2012), SAOImage DS9 (Smithsonian Astrophysical Observatory 2000), Matplotlib(Hunter 2007), NumPy(Oliphant 2007), extinction (Barbary 2016) PYPHOT(https://github.com/mfouesneau/pyphot).
Data Availability
All the optical photometry used for this work and shown in Figure 2 are available on the online supplementary material version of this article.
References
- Aird et al. (2015) Aird J., Coil A. L., Georgakakis A., Nandra K., Barro G., Pérez-González P. G., 2015, MNRAS, 451, 1892
- Alexander et al. (2016) Alexander K. D., Berger E., Guillochon J., Zauderer B. A., Williams P. K. G., 2016, ApJ, 819, L25
- Arcavi (2018) Arcavi I., 2018, Transient Name Server Classification Report, 2018-1764, 1
- Arcavi et al. (2014) Arcavi I., et al., 2014, ApJ, 793, 38
- Astropy Collaboration et al. (2018) Astropy Collaboration et al., 2018, AJ, 156, 123
- Auchettl et al. (2017) Auchettl K., Guillochon J., Ramirez-Ruiz E., 2017, ApJ, 838, 149
- Barbary (2016) Barbary K., 2016, extinction, doi:10.5281/zenodo.804967, https://doi.org/10.5281/zenodo.804967
- Becker (2015) Becker A., 2015, HOTPANTS: High Order Transform of PSF ANd Template Subtraction (ascl:1504.004)
- Blagorodnova et al. (2017) Blagorodnova N., et al., 2017, ApJ, 844, 46
- Blagorodnova et al. (2019) Blagorodnova N., et al., 2019, ApJ, 873, 92
- Bonnerot & Lu (2020) Bonnerot C., Lu W., 2020, MNRAS, 495, 1374
- Bower et al. (2013) Bower G. C., Metzger B. D., Cenko S. B., Silverman J. M., Bloom J. S., 2013, ApJ, 763, 84
- Brimacombe & Stanek (2018) Brimacombe J., Stanek K. Z., 2018, Transient Name Server Discovery Report, 2018-1708, 1
- Brown et al. (2013) Brown T. M., et al., 2013, PASP, 125, 1031
- Brown et al. (2017) Brown J. S., Holoien T. W. S., Auchettl K., Stanek K. Z., Kochanek C. S., Shappee B. J., Prieto J. L., Grupe D., 2017, MNRAS, 466, 4904
- Bruzual & Charlot (2003) Bruzual G., Charlot S., 2003, MNRAS, 344, 1000
- Burrows et al. (2005) Burrows D. N., et al., 2005, Space Sci. Rev., 120, 165
- Calzetti et al. (2000) Calzetti D., Armus L., Bohlin R. C., Kinney A. L., Koornneef J., Storchi-Bergmann T., 2000, ApJ, 533, 682
- Chabrier (2003) Chabrier G., 2003, PASP, 115, 763
- Chambers & Pan-STARRS Team (2018) Chambers K., Pan-STARRS Team 2018, in American Astronomical Society Meeting Abstracts #231. p. 102.01
- Chornock et al. (2014) Chornock R., et al., 2014, ApJ, 780, 44
- Dong et al. (2016) Dong S., et al., 2016, Science, 351, 257
- Dong et al. (2018) Dong S., Bose S., Chen P., Brink T. G., de Jaeger T., Filippenko A. V., Zheng W., 2018, The Astronomer’s Telegram, 12198, 1
- Foreman-Mackey (2016) Foreman-Mackey D., 2016, The Journal of Open Source Software, 1
- Foreman-Mackey et al. (2013) Foreman-Mackey D., Hogg D. W., Lang D., Goodman J., 2013, PASP, 125, 306
- French et al. (2016) French K. D., Arcavi I., Zabludoff A., 2016, ApJ, 818, L21
- Gaia Collaboration et al. (2016) Gaia Collaboration et al., 2016, A&A, 595, A1
- Gaia Collaboration et al. (2018) Gaia Collaboration et al., 2018, A&A, 616, A1
- Gehrels et al. (2004) Gehrels N., et al., 2004, ApJ, 611, 1005
- Gelman & Rubin (1992) Gelman A., Rubin D. B., 1992, Statistical Science, 7, 457
- Gezari et al. (2009) Gezari S., et al., 2009, ApJ, 698, 1367
- Gezari et al. (2012) Gezari S., et al., 2012, Nature, 485, 217
- Gezari et al. (2017) Gezari S., Cenko S. B., Arcavi I., 2017, ApJ, 851, L47
- Graur et al. (2018) Graur O., French K. D., Zahid H. J., Guillochon J., Mandel K. S., Auchettl K., Zabludoff A. I., 2018, ApJ, 853, 39
- Guillochon et al. (2009) Guillochon J., Ramirez-Ruiz E., Rosswog S., Kasen D., 2009, ApJ, 705, 844
- Guillochon et al. (2017) Guillochon J., Parrent J., Kelley L. Z., Margutti R., 2017, ApJ, 835, 64
- Guillochon et al. (2018) Guillochon J., Nicholl M., Villar V. A., Mockler B., Narayan G., Mandel K. S., Berger E., Williams P. K. G., 2018, ApJS, 236, 6
- Heasarc (2014) Heasarc N. H. E. A. S. A. R. C., 2014, HEAsoft: Unified Release of FTOOLS and XANADU (ascl:1408.004)
- Heckman et al. (2005) Heckman T. M., Ptak A., Hornschemeier A., Kauffmann G., 2005, ApJ, 634, 161
- Hills (1975) Hills J. G., 1975, Nature, 254, 295
- Hinshaw et al. (2013) Hinshaw G., et al., 2013, ApJS, 208, 19
- Holoien et al. (2014) Holoien T. W. S., et al., 2014, MNRAS, 445, 3263
- Holoien et al. (2016a) Holoien T. W. S., et al., 2016a, MNRAS, 455, 2918
- Holoien et al. (2016b) Holoien T. W. S., et al., 2016b, MNRAS, 463, 3813
- Holoien et al. (2020) Holoien T. W. S., et al., 2020, arXiv e-prints, p. arXiv:2003.13693
- Horesh et al. (2018) Horesh A., Sfaradi I., Bright J., Fender R., 2018, The Astronomer’s Telegram, 12218, 1
- Hung et al. (2020) Hung T., et al., 2020, arXiv e-prints, p. arXiv:2003.09427
- Hunter (2007) Hunter J. D., 2007, Computing in Science and Engineering, 9, 90
- Kalberla et al. (2005) Kalberla P. M. W., Burton W. B., Hartmann D., Arnal E. M., Bajaja E., Morras R., Pöppel W. G. L., 2005, A&A, 440, 775
- Kennicutt (1998) Kennicutt Robert C. J., 1998, ARA&A, 36, 189
- Kochanek et al. (2017) Kochanek C. S., et al., 2017, PASP, 129, 104502
- Leja et al. (2017) Leja J., Johnson B. D., Conroy C., van Dokkum P. G., Byler N., 2017, ApJ, 837, 170
- Leloudas et al. (2016) Leloudas G., et al., 2016, Nature Astronomy, 1, 0002
- Leloudas et al. (2019) Leloudas G., et al., 2019, ApJ, 887, 218
- Lodato & Rossi (2011) Lodato G., Rossi E. M., 2011, MNRAS, 410, 359
- Margutti et al. (2013) Margutti R., et al., 2013, MNRAS, 428, 729
- McConnell & Ma (2013) McConnell N. J., Ma C.-P., 2013, ApJ, 764, 184
- Mockler et al. (2019) Mockler B., Guillochon J., Ramirez-Ruiz E., 2019, ApJ, 872, 151
- Nicholl et al. (2019) Nicholl M., et al., 2019, MNRAS, 488, 1878
- Oliphant (2007) Oliphant T. E., 2007, CSE, 9, 10
- Rees (1988) Rees M. J., 1988, Nature, 333, 523
- Roming et al. (2005) Roming P. W. A., et al., 2005, Space Sci. Rev., 120, 95
- Ryu et al. (2020) Ryu T., Krolik J., Piran T., Noble S. C., 2020, arXiv e-prints, p. arXiv:2001.03503
- Sault & Wieringa (1994) Sault R. J., Wieringa M. H., 1994, Astronomy and Astrophysics Supplement Series, 108, 585
- Schlafly & Finkbeiner (2011) Schlafly E. F., Finkbeiner D. P., 2011, ApJ, 737, 103
- Science Software Branch at STScI (2012) Science Software Branch at STScI 2012, PyRAF: Python alternative for IRAF (ascl:1207.011)
- Shappee et al. (2014) Shappee B. J., et al., 2014, ApJ, 788, 48
- Short et al. (2020) Short P., et al., 2020, arXiv e-prints, p. arXiv:2003.05470
- Smithsonian Astrophysical Observatory (2000) Smithsonian Astrophysical Observatory 2000, SAOImage DS9: A utility for displaying astronomical images in the X11 window environment (ascl:0003.002)
- Thomas et al. (2013) Thomas D., et al., 2013, MNRAS, 431, 1383
- Wevers et al. (2019) Wevers T., et al., 2019, MNRAS, 488, 4816
- Zauderer et al. (2011) Zauderer B. A., et al., 2011, Nature, 476, 425
- van Velzen et al. (2013) van Velzen S., Frail D. A., Körding E., Falcke H., 2013, A&A, 552, A5
- van Velzen et al. (2016) van Velzen S., et al., 2016, Science, 351, 62
- van Velzen et al. (2019a) van Velzen S., et al., 2019a, ApJ, 872, 198
- van Velzen et al. (2019b) van Velzen S., Stone N. C., Metzger B. D., Gezari S., Brown T. M., Fruchter A. S., 2019b, ApJ, 878, 82
- van Velzen et al. (2020) van Velzen S., et al., 2020, arXiv e-prints, p. arXiv:2001.01409