E-mails: {ioannis.avgouleas, nikolaos.pappas, vangelis.angelakis}@liu.se
Cacheable and Non-Cacheable Traffic Interplay in a Relay-Assisted Wireless Network
Abstract
We study a discrete-time wireless network that serves both cacheable and non-cacheable traffic with assistance of a relay node with storage capabilities for both types of traffic. We investigate how allocating the storage capacity to cacheable and non-cacheable traffic affects the network throughput. Our numerical results provide useful insights by varying not only the allocation of cacheable to non-cacheable storage but also the rate by which non-cacheable content is transmitted, the rate by which cacheable content is requested, as well as different popularity distributions of the cached files.
I Introduction
Wireless data traffic grew immensely over the past 10 years and is expected to comprise 20 percent of total IP traffic by 2022 with 1.5 mobile-connected device per capita. Almost three-fifths of traffic will be offloaded from cellular networks to Wi-Fi by the same year [1]. Mobile devices represented a large part of the total wireless traffic with wireless video being one of the main sources of wireless data traffic. Moreover, the introduction of high quality video formats such as 4K, 8K, 360o etc. will further contribute to degraded user experience due to increased delay and congestion. Video streaming services are interested in mitigating such performance issues by offloading content closer to the users [2].
Additionally, the advent of the Internet of Things (IoT) will necessitate serving a massive amount of devices with limited resources of energy, memory and computation. Thus, the attention of the research community is moving towards effectively supporting IoT communications. For instance, Named Data Networking (NDN) is an information-centric Internet architecture which has been recently considered as an enabling technology for IoT, due to its innovative features like named-based routing and in-network caching [3]. NDN allows for caching at intermediate nodes which proves to be effective in mitigating the network delay and traffic as well as the load on content producers [4].
Caching has been quite successful recently in reducing cellular traffic and delay as well as increasing network throughput and reliability. Cache-enabled 5G wireless systems and future network architectures will benefit from caching in terms of reduced costs for the network infrastructure and the quality of service available to the end users. A cache can typically store a small subset of the files library because of its limited capacity. Therefore, caching policies are necessary to decide which files are placed into the cache as well as which files to evict from the cache when the cache is full and a new file should be cached. Many content placement strategies have been proposed in the literature e.g., caching the least frequently used content [5], caching the most popular content everywhere [5], probabilistic caching [6], cooperative caching [7], and geographical caching [8]. The role of caching for future communication systems is analyzed in [9].
Caching policies usually assume a model for file requests which, in practice, is a priori unknown and time-varying [10]. Additionally, there are caching architectures whose caches receive a low number of requests and, thus, realize request processes with high non-stationary popularity [11]. However, such models are challenging to fit and depend on strong assumptions about the popularity distribution. The authors in [12] develop a class of policies that make no assumptions on the file request distribution and, hence, is robust to popularity deviations by adjusting their caching decisions when the popularity model changes.
Typical performance criteria for a caching policy include the cache hit ratio (or probability), the density of successful receptions [6], energy efficiency[13] and the traffic load of the wireless links [14], among others. Additionally, a considerable amount of contemporary works consider throughput and/or delay with caching helpers [15, 16, 17]. To reduce delay, many works mitigate the backhaul or transmission delay under the assumption that traffic or requests are saturated. Works that do not make this assumption, but assume stochastic arrivals have also appeared e.g., [18].
The rise of wireless networks serving a massive amount of devices, such as 5G or IoT networks, will give birth to new traffic patterns. For example, traffic generated from Machine to Machine (M2M) devices is generally different compared to traditional smartphone traffic [19, 20]. These findings along with the aforementioned proliferation of caching techniques at the network edge suggest that understanding traffic is key to designing and optimizing the performance of future networking architectures.
I-A Our work
In this paper, we study a wireless system that serves both cacheable and non-cacheable traffic. A relay node partially assists the non-cacheable transmissions by queueing the non-cacheable packets that failed to be transmitted to the destination. The queued packets are intended to be transmitted from the relay to the destination in a subsequent time slot.
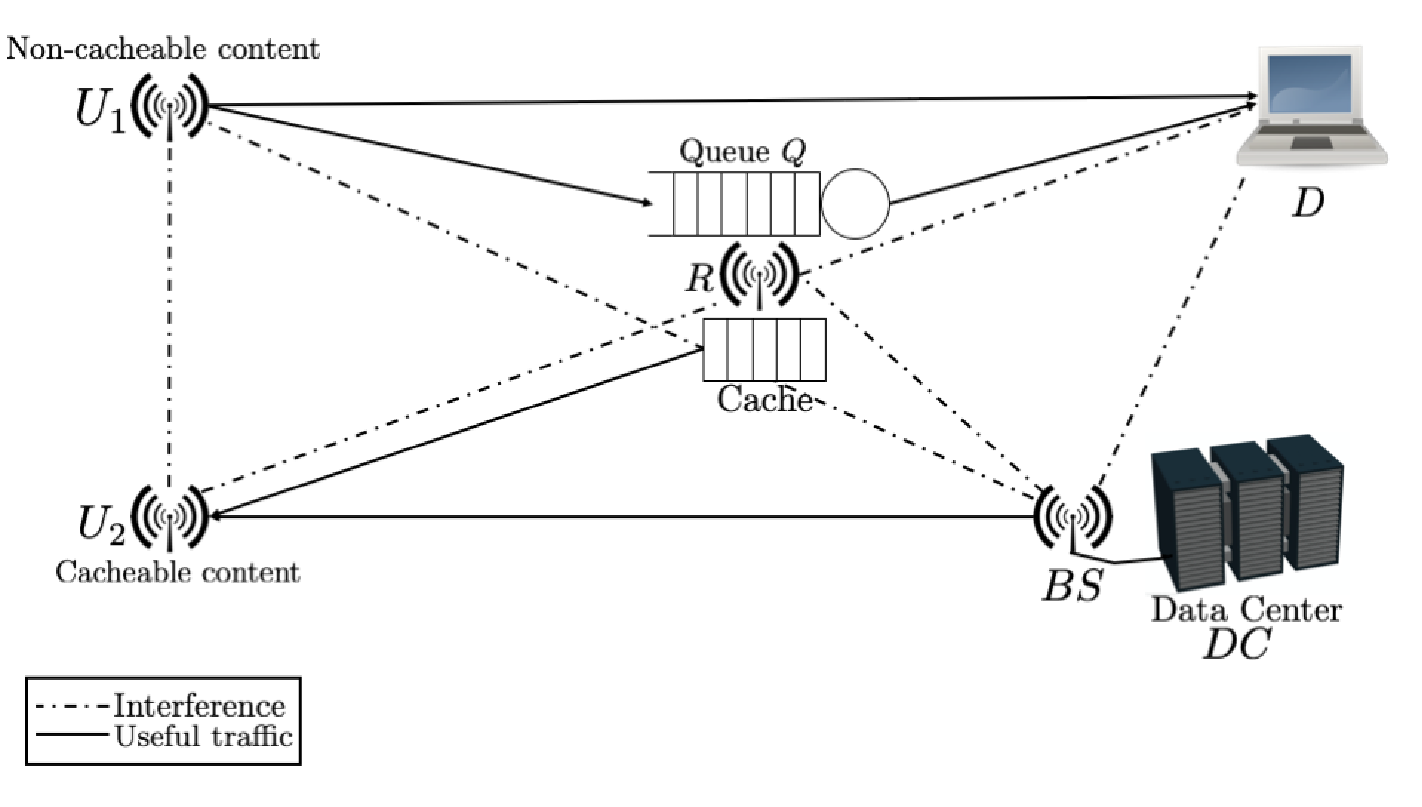
Moreover, when the relay node is not assisting the non-cacheable pair, it is available to serve cached files to another wireless user within in its coverage. The wireless user that requests cached content can also be served by a data center in case the relay misses the requested file or is not available for caching. The data center is assumed to contain the file library and is connected directly to a wireless base station through a backhaul link. Files from the data center are fetched to the cached user through the base station if the data center is available to serve cached files.
We analyze the network throughput considering the rate by which non-cacheable traffic is transmitted to the destination as well as the rate by which the relay attempts transmissions for non-cacheable traffic. In our numerical results, we vary the storage capacity dedicated to non-cacheable traffic and, thus, to cacheable traffic, to gain useful insights into the throughput of such systems and introduce the first step for the understanding of larger network topologies.
II System Model
II-A Network Model
We consider the following network system: a user device serving non-cacheable traffic to a destination node with the assistance of a wireless relay node , and another user, , requesting cached files in case of a local cache miss. The requested cached file can be served by external resources i.e., from the relay node or the data center . We assume that packets and files are equally sized, so, thereafter, we use the terms packet and files interchangeably. The topology of the studied system can be found in Fig. 1.
We assume slotted time and that a packet transmission takes exactly one time-slot. Nodes have random access to the wireless medium with no coordination between them regarding transmissions’ scheduling. Thus, nodes attempt transmissions to the channel with some probability. An acknowledgment mechanism is assumed such that instantaneous and error-free acknowledgment/ negative-acknowledgment (ACK/NACK) packets are sent by the receiver over a separate channel. As a result, when successfully receives a packet from , the latter removes it from its buffer and is ready to attempt transmission of the next packet (in the next time slot) and the relay discards it from its queue (if it has successfully received it). When successfully receives a packet that did not reach , node discards it from its buffer and is ready to attempt transmission of the next packet. The evolution of the relay’s queue is analysed in Section III-A.
Additionally, the relay node does not generate packets on its own and is equipped with a FD transceiver i.e., it can receive and transmit a packet within the same time slot. Its purpose is two-fold: (i) forward non-cacheable packets to the destination node, and (ii) serve cached files to user . In each time slot, the relay is available to serve either non-cacheable or cacheable traffic. For that purpose, it hosts files that can be used for serving both types of traffic. Non-cacheable incoming packets to are stored in its queue with size for packets. The rest of the storage capacity is devoted to cached files for user . Consequently, the cache at the relay can hold files to help user ’s file requests from external resources. The operation of the relay’s cache is described in Section II-D.
The data center can be accessed through a wireless base station () and stores the library of files i.e., all files that might request. We model ’s availability with probability to model the fact that it can be out of service due to serving other users, failure, maintenance etc. If the is always available to , then . On the other hand, if the is not available for , then .
II-B Transmission Model
| Notation | Description |
|---|---|
| probability of attempting non-cacheable transmission. | |
| probability of being available to serve . | |
| probability of requesting a cached file from external | |
| resources ( or ). | |
| probability of cache hit at . | |
| probability of being available to serve requests. | |
| success probability of link , when node is the | |
| only transmitter. | |
| success probability of link , when and nodes | |
| in are transmitting. |
In each time slot, attempts to transmit non-cacheable traffic to with probability and the relay can serve non-cacheable traffic to with probability . Thus, it is available to serve cacheable traffic to with probability . Moreover, in each time slot, requests a cached file from external resources with probability . Therefore, if the relay node serves with non-cacheable traffic, then interferes with the transmission from to and any transmission from to which happens when has requested a file which will be served by the data center . On the other hand, if the relay node serves with cacheable traffic, then it only interferes with the transmission from to . We summarize the aforementioned events and notation in Table I.
II-C Physical Layer Model
We assume Rayleigh fading for the wireless channel and that a packet transmission from node to node is successful if and only if the link Signal-to-Interference-plus-Noise power ratio (SINR) between node and exceeds a minimal threshold . The received power at node when transmits is , where is a unit-mean exponentially distributed random variable and the received power factor is: where is the power measured at away from the transmitting antenna of node , is the distance in between and , and is the path-loss exponent.
The success probability of link , with denoting the set of transmitting nodes, is given by [Rayleigh:fading:success:prob]:
where is the noise power at receiver .
II-D Caches’ Operation
We assume the content placement is given and that the cached nodes i.e., and , follow the Collaborative Most Popular Content (CMPC) policy. According to the latter, user stores the first most popular files in its cache, the relay node caches the next most popular files, and the data center hosts all files that might request. When the user node requests for a file that is not stored in its most popular files, it first probes for it. The relay node serves if it is available for caching i.e., when not serving , and has the requested file. Otherwise, user requests the file from the data center. If the latter is available for (which happens with probability ), then the file is fetched by the data center. We assume that the information exchange required for the operation of the CMPC policy e.g., the cache size of each device and the content placement in each device, is negligible.
Moreover, we consider a finite content library of files with denoting the -th most popular file. For the sake of simplicity, we assume that all files have equal size and that access to cached files happens instantaneously. The request probability of the is given by: , where is the normalization factor and is the shape parameter of the Zip law which determines the correlation of user requests. As a result, the probability that user requests a file that is not located in its cache is: and the cache hit probability at the relay node is given by: where and are the storage capacity and the queue size at the relay node, respectively.
III Analysis
In this section, we present the analysis for the states of the relays’ queue and the throughput of the system in Fig. 1.
III-A Relay’s Queue Analysis
Let denote the buffer size of the relay’s queue . The latter follows the first-come-first-serve (FCFS) discipline. Moreover, we assume that when the queue is full i.e., holds packets, and a new packet arrives at the relay, the relay rejects its arrival and acknowledgments user to attempt retransmitting that packet in a subsequent time slot. We consider that this acknowledgment is instantaneous and error-free. The evolution of the Discrete Time Markov Chain (DTMC) of is shown in Fig. 2.
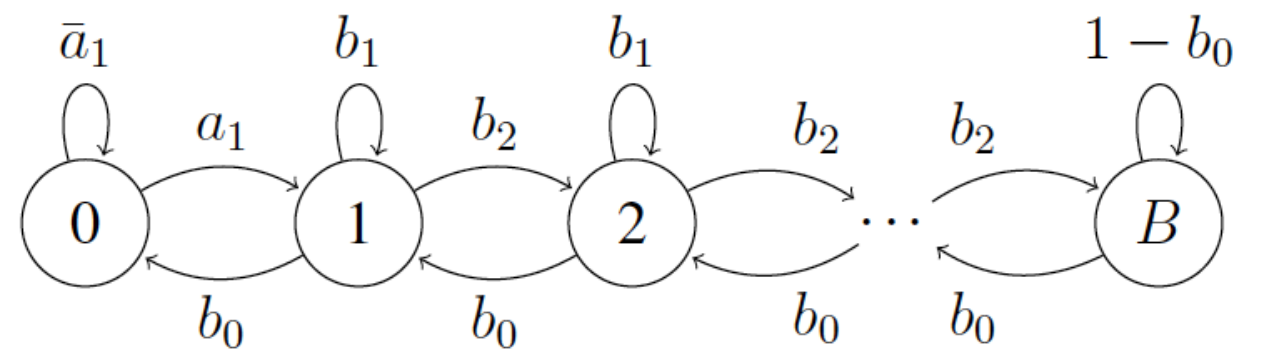
The transition matrix that models the DTMC above is given by the following stochastic column matrix:
where . The entries of are given by:
To derive the steady state distribution , we need to solve the balance equations: which produce the following relation for calculating the probability of being in state :
where:
III-B Throughput Analysis
First, we derive the direct throughput from user to the destination node and the relayed throughput from the relay node to with the intention of deriving the throughput of . Then, we formulate the cacheable throughput seen by user . Recall that user and the relay attempt transmissions with probabilities and , respectively. Moreover, requests a file from external resources with probability , and is the probability of a cache hit at the relay’s cache. Also, denotes the probability with which the data center is available to serve file requests of and denotes the probability that i.e., the queue at the relay, is not empty (please see Table I for the description of our notation).
The direct throughput from user to is:
The relayed throughput from to is given by:
The non-cacheable throughput seen by is given by:
The cacheable throughput seen by is given by:
IV Numerical Results
In this section, we present numerical evaluations of the analysis in Section III. The transmission power of each device and the distances between nodes are set as per Table II. Please notice that we use the same SINR for every wireless link in our system and the same noise power for every receiver.
| Parameter | Value |
|---|---|
| or dB |
| Parameter | Value |
|---|---|
| Parameter | Value |
|---|---|
| Parameter | Value |
|---|---|
Regarding caching, we assume that the cache of node hosts files, and that the relay node stores files for both types of traffic. Its queue has finite size for cacheable traffic and, hence, holds files the non-cacheable traffic. We also assume that the whole library (at the data center) holds files. The caches follow the Collaborative Most Popular Content (CMPC) policy (which we describe in Section II-D). The random availability of the data center for was set to . We summarize the cache parameters in Table III. In the following results, we vary to gain insight into its effect on the throughput at the destination nodes ( and ) and the distribution of the packets at the queue of the relay .
| Parameter | Description | Value |
|---|---|---|
| cache size at user | or | |
| number of files at the relay | ||
| number of files at the data center | ||
| shape parameter for the correlation of the files | or | |
| probability of requesting a cached file | or | |
| probability of being available to serve . | ||
| from external resources ( or ) | ||
| probability of being available to serve | ||
| links SINR minimum value | dB |
IV-A Throughput and vs. Queue Size
In this section, we study how i.e., the storage at the relay for non-cacheable traffic affects , , and i.e., the non-cacheable throughput at destination node , the cacheable throughput at user node , and the network throughput given by: , respectively. We present two cases in each plot: (i) and , and (ii) and . It should be noted that i.e., the probability of requesting content from external resources decreases with for fixed , and for (see Section II-D). In Fig. 3(a) and (b), we plot the aforementioned throughputs versus for and , respectively. We observe that is increased with since increasing results in attempting transmissions more frequently. As a result, more interference to is realized from and , and, hence, , is decreased with . Additionally, we observe that the network throughput is decreased with .
Furthermore, when , we observe that increasing above a minimum value is not beneficial for the three throughputs when and . However, this is not the case when and user has no cache i.e., . We observe that obtains its maximum value when i.e., when is not set to hold any non-cacheable packets, and, thus, is only available for serving cacheable traffic. There is a considerable drop in , when is set to hold non-cacheable packets () as well, since i.e., the probability of being available to serve non-cacheable traffic, was set to in our results. The network throughput behaves similarly to .
When raising to , we observe that increases with no matter the values for and . Regarding , we observe a similar behavior to the case in which , but with lower values. The slight decrease of with that is observed for can be attributed to the fact that when the queue is increased, the cache size at the relay is decreased and, hence, user requests more frequently content from instead of . Similarly to , starts to drop with increased up to and, then, increases with .
IV-B Distribution of relay’s queue states
In this section we study i.e., the probability of the queue at the relay being in a specific state or, equivalently, holding non-cacheable packets, versus for the cases of Section IV-A: (i) and , and (ii) and . We used three different values for i.e., the size of the queue at the relay, to gain insight into its effect on the distribution of the queue states.
For , it is more probable for the relay to store no packets at all when and and more probable to store one packet when and (see Fig. 4). Furthermore, when , the queue is more probable to hold on average more packets when and than when and no matter the value of . We observe that, when i.e., the storage at the relay is equally split among cacheable and non-cacheable purposes, or when i.e., the storage at the relay is dedicated to non-cacheable traffic, then the probability of the queue holding more than packets is almost zero for (see Fig. 4(a)). This is anticipated since, in our results, i.e., the probability by which the relay is available to serve non-cacheable traffic is double the rate by which non-cacheable traffic is transmitted to the network by .
However, this is not the case if is increased to . In general, increasing yields higher values of for higher states since increasing the rate by which attempts transmissions results in more failed transmissions to and, hence, more attempts to queue the failed packets at the relay. Consequently, the queue is more probable to store more packets for higher values of compared to lower ones. Moreover, for fixed , when and , increasing over five has a decreasing effect on for higher states i.e., increasing produces a queue that has a higher probability of holding less packets. This is not the case when and where the distributions of the queue states for the first six states are very close for .
V Conclusion
In this work, we studied the effect of a relay node with storage capabilities in a wireless system that serves two types of traffic: cacheable and non-cacheable traffic. The relay’s storage can be split to accommodate the needs of both types of traffic. We derived the network throughput taking into consideration the number of files for cacheable and non-cacheable traffic at the relay, the wireless links’ parameters, the availability of the data center, and the rate by which cacheable and non-cacheable content is requested and transmitted, respectively.
Our numerical results provide insight into the network throughput and distribution of the relay’s files in terms of the aforementioned parameters. It is shown how the network throughput is affected by allocation of the relay storage to cacheable and non-cacheable files as well as how the distribution of the cached files affects the network’s performance.
References
- [1] “Cisco Visual Networking Index: Global Mobile Data Traffic Forecast Update, 2017–2022 White Paper,” 2019. [Online]. Available: https://www.cisco.com/c/en/us/solutions/collateral/service-provider/visual-networking-index-vni/white-paper-c11-738429.html
- [2] S. Dernbach, N. Taft, J. Kurose, U. Weinsberg, C. Diot, and A. Ashkan, “Cache content-selection policies for streaming video services,” IEEE INFOCOM 2016 - The 35th Annual IEEE International Conference on Computer Communications, pp. 1–9, April 2016.
- [3] Cheng Yi and Alexander Afanasyev and Ilya Moiseenko and Lan Wang and Beichuan Zhang and Lixia Zhang, “A case for stateful forwarding plane,” Computer Communications, vol. 37, no. 7, pp. 779 – 791, 2013.
- [4] M. A. Hail, M. Amadeo, A. Molinaro, and S. Fischer, “Caching in Named Data Networking for the wireless Internet of Things,” International Conference on Recent Advances in Internet of Things (RIoT), pp. 1–6, April 2015.
- [5] G. Paschos, E. Bastug, I. Land, G. Caire, and M. Debbah, “Wireless caching: technical misconceptions and business barriers,” IEEE Communications Magazine, vol. 54, no. 8, pp. 16–22, Aug. 2016.
- [6] Z. Chen, N. Pappas, and M. Kountouris, “Probabilistic Caching in Wireless D2D Networks: Cache Hit Optimal versus Throughput Optimal,” IEEE Communications Letters, vol. 21, no. 3, pp. 584–587, Mar. 2017.
- [7] J. Ma, J. Wang, and P. Fan, “A Cooperation-Based Caching Scheme for Heterogeneous Networks,” IEEE Access, vol. 5, pp. 15 013–15 020, 2017.
- [8] Z. Chen and M. Kountouris, “D2D caching vs. small cell caching: Where to cache content in a wireless network?” IEEE 17th International Workshop on Signal Processing Advances in Wireless Communications (SPAWC), pp. 1–6, July 2016.
- [9] L. Li, G. Zhao, and R. S. Blum, “A Survey of Caching Techniques in Cellular Networks: Research Issues and Challenges in Content Placement and Delivery Strategies,” IEEE Communications Surveys Tutorials, vol. 20, no. 3, pp. 1710–1732, thirdquarter 2018.
- [10] N. Carlsson and D. Eager, “Ephemeral Content Popularity at the Edge and Implications for On-Demand Caching,” IEEE Transactions on Parallel and Distributed Systems, vol. 28, no. 6, pp. 1621–1634, June 2017.
- [11] Elayoubi, Salah-Eddine and Roberts, James, “Performance and Cost Effectiveness of Caching in Mobile Access Networks,” Proceedings of the 2nd ACM Conference on Information-Centric Networking (ACM-ICN), pp. 79–88, 2015.
- [12] G. Paschos, A. Destounis, L. Vigneri, and G. Iosifidis, “Learning to Cache With No Regrets,” IEEE Conference on Computer Communications (INFOCOM), pp. 235–243, April 2019.
- [13] D. Liu and C. Yang, “Energy Efficiency of Downlink Networks With Caching at Base Stations,” IEEE Journal on Selected Areas in Communications, vol. 34, no. 4, pp. 907–922, Apr. 2016.
- [14] J. Rao, H. Feng, C. Yang, Z. Chen, and B. Xia, “Optimal caching placement for D2D assisted wireless caching networks,” IEEE International Conference on Communications (ICC), pp. 1–6, May 2016.
- [15] N. Pappas, Z. Chen, and I. Dimitriou, “Throughput and Delay Analysis of Wireless Caching Helper Systems With Random Availability,” IEEE Access, vol. 6, pp. 9667–9678, Feb. 2018.
- [16] I. Avgouleas, N. Pappas, and V. Angelakis, “Performance Evaluation of Wireless Caching Helper Systems,” 15th International Conference on Wireless and Mobile Computing, Networking and Communications (WiMob), Oct. 2019.
- [17] G. Smpokos, N. Pappas, Z. Chen, and P. Mohapatra, “Wireless Caching Helper System with Heterogeneous Traffic and Secrecy Constraints,” IEEE 20th International Workshop on Signal Processing Advances in Wireless Communications (SPAWC), pp. 1–5, July 2019.
- [18] F. Rezaei and B. H. Khalaj, “Stability, Rate, and Delay Analysis of Single Bottleneck Caching Networks,” IEEE Transactions on Communications, vol. 64, no. 1, pp. 300–313, Jan. 2016.
- [19] M. Z. Shafiq, L. Ji, A. X. Liu, J. Pang, and J. Wang, “Large-Scale Measurement and Characterization of Cellular Machine-to-Machine Traffic,” IEEE/ACM Transactions on Networking, vol. 21, no. 6, pp. 1960–1973, Dec. 2013.
- [20] S. Di Domenico, M. De Sanctis, E. Cianca, L. Silvestri, V. Curcurú, and A. Betti, “Classification of Heterogenous M2M/IoT Traffic Based on C-plane and U-plane Data,” IEEE 29th Annual International Symposium on Personal, Indoor and Mobile Radio Communications (PIMRC), pp. 1–5, Sep. 2018.