Ultrarelativistic quark-nucleus scattering in a light-front Hamiltonian approach
Abstract
We investigate the scattering of a quark on a heavy nucleus at high energies using the time-dependent basis light-front quantization (tBLFQ) formalism, which is the first application of the tBLFQ formalism in QCD. We present the real-time evolution of the quark wave function in a strong classical color field of the relativistic nucleus, described as the Color Glass Condensate. The quark and the nucleus color field are simulated in the QCD SU(3) color space. We calculate the total and the differential cross sections, and the quark distribution in coordinate and color spaces using the tBLFQ approach. We recover the eikonal cross sections in the eikonal limit. We find that the differential cross section from the tBLFQ simulation is in agreement with a perturbative calculation at large , and it deviates from the perturbative calculation at small due to higher-order contributions. In particular, we relax the eikonal limit by letting the quark carry realistic finite longitudinal momenta. We study the sub-eikonal effect on the quark through the transverse coordinate distribution of the quark with different longitudinal momentum, and we find the sub-eikonal effect to be sizable. Our results can significantly reduce the theoretical uncertainties in small region which has important implications to the phenomenology of the hadron-nucleus and deep inelastic scattering at high energies.
I Introduction
Scattering of an ultrarelativistic quark off a heavy nucleus is one of the most direct ways to study the structure of the cold nuclear matter at low values of Bjorken’s . The perturbative calculations involve resummation of the multiple scatterings of the quark in the nucleus Dumitru and Jalilian-Marian 2002 and of the radiative processes Tuchin 2004; Kovchegov and Tuchin 2006 all in the eikonal limit. Due to the gluon saturation at small , the typical transverse momentum scale in this process is the semi-hard saturation momentum, which makes the perturbative approach possible Gribov et al. 1983; Mueller and Qiu 1986. The resummation can be very efficiently performed by means of the Color Glass Condensate (CGC) theory that treats heavy nucleus as a random color field Gelis et al. 2010; Weigert 2005.
While the perturbative eikonal approach yielded essential insights into the structure and dynamics of the cold nuclear matter at small Kovchegov and Levin 2012, the corresponding phenomenological approaches often suffer from uncertainties that arise from the infrared and sub-eikonal corrections. Motivated by the future experimental program at the Electron-Ion Collider Accardi et al. 2016 we initiate in this paper investigation of the sub-eikonal non-perturbative corrections to the quark-nucleus scattering using the computational formalism the time-dependent basis light-front quantization (tBLFQ) Zhao et al. 2013. We ignore the radiative effects that contribute to the quantum evolution of the quark wave function with energy.
The tBLFQ formalism is a natural extension of the basis light-front quantization (BLFQ) approach Vary et al. 2010, that has been developed based on the light-front quantum field theory and the Hamiltonian formalism to tackle bound state problems. The implementation of the basis function representation allows us to choose a basis with the same symmetries of the system under investigation, and is therefore advantageous for carrying out efficient numerical calculations. This method has been applied to study the QED bound state system of positronium Wiecki et al. 2015, the QCD bound states of heavy and light mesons Li et al. 2016; Li et al. 2017; Tang et al. 2018; Tang et al. 2019; Jia and Vary 2019, and the bound states of the nucleon-pion system with a simple chiral model Du et al. 2019. It has been shown that tBFLQ is particularly well-suited for calculating non-perturbative effects through the applications of the nonlinear Compton scattering Zhao et al. 2013; Hu et al. 2019, and the interaction of an electron with intense electromagnetic fields Chen et al. 2017. Its counterpart in quantum mechanics, the time-dependent basis function approach, has been applied to investigate deuteron heavy ion scatterings under the Coulomb interaction Du et al. 2018; Yin et al. 2019.
In this paper we apply the tBLFQ formalism to investigate the quark-nucleus scattering, by treating the nucleus as a classical SU(3) color field using the CGC theory McLerran and Venugopalan 1994a; McLerran and Venugopalan 1994b; McLerran and Venugopalan 1994c. In particular, we solve for the time evolution of the quark as a quantum state inside the CGC. We calculate the quark-nucleus elastic and total scattering cross sections, and we study the evolution of the quark’s distribution in the transverse coordinate space as well as in the color space. The intrinsic non-perturbative feature of the tBLFQ formalism provides us an opportunity to study the sub-eikonal effects. At high energy, the propagation time of the quark through the target nucleus is short and its transverse position does not change substantially during the propagation. Neglecting such change is usually implemented as the eikonal limit in many studies Kovchegov and Levin 2012. However, in reality the quark carries a finite longitudinal momentum and therefore admits sub-eikonal effects. A variety of works using pQCD has studied sub-eikonal effects from different aspects, including helicity change of the quark, longitudinal momentum exchange, and finite length of the background field Jalilian-Marian 2017; Jalilian-Marian 2019a; Jalilian-Marian 2019b; Kovchegov and Sievert 2019a; Kovchegov and Sievert 2019b; Altinoluk et al. 2016; Chirilli 2019. In this work, we treat the quark with finite energy and keep its interaction time with the nucleus finite, and we reveal a sub-eikonal effect through the evolution of the quark’s transverse coordinate distribution from the non-perturbative aspect.
The results presented in this paper can be used to calculate particle production in A collisions in the proton fragmentation region by convoluting the quark total cross section with the quark distribution function of the proton and with the quark-hadron (jet) fragmentation function. Generalization to dipole-nucleus scattering is also straightforward and will allow us in the future to investigate deep inelastic scattering and exclusive vector meson production using light-front wavefunction obtained in the BLFQ formalism. This work also provides the foundation for the study of particle production and evolution in the glasma field created by heavy-ion collisions, where the initial gluon field can be solved analytically Chen et al. 2015.
II Methodology: time-dependent basis light-front quantization
We start by considering scattering of a high-energy quark moving in the positive direction, on a high-energy nucleus moving in the negative direction, as shown in Fig. 1. The quark has momentum and whereas the nucleus has momentum and (see definitions of the light-front variables in Appendix A). We treat the quark state at the amplitude level and the nucleus as an external background field. The quark interacts with the nuclear field at .
II.1 Time evolution under a background field
We consider a quark interacting with the background field generated by the heavy nucleus. To start with, we truncate the Fock space of the quark to the leading sector as . Consequently, the QCD Lagrangian reduces to
| (1) |
where and . is the 3 by 3 unit matrix in color space, and is the background gluon field. The light-front Hamiltonian is derived from the Lagrangian through the standard Legendre transformation Brodsky et al. 1998,
| (2) | ||||
The standard QCD light-front Hamiltonian is formulated in the light cone gauge of . Here the dynamical gauge field is absent due to Fock sector truncation, and we apply the condition to the background field. The first term is the light-front QCD Hamiltonian in the sector, which is the kinetic energy of the quark, denoted as . The two terms in the second line are the interactions introduced by the external field, and together they are signified by . The interaction term, in general, could have a time dependence arising from the external field, such that .
We are interested in how the quark, as an eigenstate of the QCD Hamiltonian, , evolves due to interactions with the background field. It is therefore natural to use an interaction picture to solve the evolution equation on the light front,
| (3) |
is the interaction Hamiltonian in the interaction picture. The solution of Eq. (3) describes the state of the investigated system at any given light-front time ,
| (4) |
where is the light-front time ordering. In the perturbative calculations, the time-ordered exponential is written as a Taylor series expansion, and only the leading terms are retained. However, in cases where the external fields are strong, the perturbative treatment may not be sufficient. Our aim is to solve the problem through a non-perturbative treatment. We decompose the time-evolution operator into many small steps of the light-front time ,
| (5) | ||||
The step size is , and the intermediate times are . This product expansion is exact in the continuum limit of . In practical calculations, the value of could be determined so as to achieve a desiring convergence of the final state. Observables could then be evaluated from the evolved state.
II.2 Gluon field as the Color Glass Condensate
The CGC formalism provides a description of gluon dynamics in the small-x region Jalilian-Marian 2017. The underlying approximation involved in the CGC theory of high energy scattering is the eikonal approximation, i.e. small angle deflection of a high energy projectile traversing a medium. The classical gluon field is found from the Yang-Mills equation,
| (6) |
() is the color current, and is the color generator. The current generated by the high-energy nucleus moving along the negative z direction has only one nonzero component, , and it is independent of its time Kovchegov and Levin 2012.
Due to Lorentz contraction, the dependence of the nucleus is peaked around , and in the extreme limit it is usually taken to be a delta function. Here we keep the dependence to allow for an extended target. The valence charges are treated as stochastic variables satisfying the correlation relation,
| (7) |
This correlation relation could be achieved by taking the color charge density to be a stochastic random variable with a local Gaussian distribution McLerran and Venugopalan 1994a; McLerran and Venugopalan 1994b,
and are the unit lengths in the and directions respectively. The Gaussian form is reasonable when the color charges at high rapidity are uncorrelated and random McLerran and Venugopalan 1999; Jalilian-Marian et al. 1997.
The field in the covariant gauge of has only one nonzero component ,
| (8) |
The gluon mass is introduced to regularize the infrared (IR) divergence in the field, which simulates color neutrality on the source distribution Krasnitz et al. 2003. The field solved from this regularized Poisson equation can be expressed in terms of the Green’s function
| (9) |
where
| (10) |
The field is logarithmically ultraviolet (UV) divergent. The divergence corresponds to the large momentum modes in the nuclear wavefunction, which are the degrees of freedom not meant to be included in the classical field. It is then natural to introduce a UV regulator Lappi 2006. In the numerical calculations of this work, the discretization of the transverse space automatically introduces a UV cutoff. Alternatively, one can introduce an additional parameter when solving the gluon field as in Eq. (10), and the integral measure becomes Müller 2019.
In this work, we follow the McLerran-Venugopalan (MV) model, where a quantum correction to saturation scale is not implemented. Consequently, the saturation scale is a constant for a fixed charge density , , and the extension of the field along Dumitru and Jalilian-Marian 2002; Fukushima and Hidaka 2007,
| (11) |
This differs from more sophisticated methods where the saturation scale is related to the gluon structure function of the nucleus and depends on Kovchegov and Levin 2012. In our numerical analysis we vary the density parameter at fixed (see Appendix B for more discussion of ).
Note that since the background field has only one nonzero component , the quark instantaneous interaction vanishes and only one term remains in ,
| (12) |
This interaction changes the transverse dependence and the color distribution of the quark, but leaves the longitudinal distribution and the spin of the quark unchanged.
II.3 Basis construction
To solve the time evolution equation of Eq. (3), one could select a basis and then work with the matrix form of the equation. An optimal basis should preserve the symmetries of the system and approximate the eigenfunctions of the Hamiltonian.
To begin, let us first identify the eigenstates and eigenvalues of , such that
| (13) |
Since only contains the kinetic energy of the quark, its eigenstates are therefore the momentum states of the quark. Considering that the background field interacts with the quark in the transverse space and the color space, we construct the basis state as , where and are the transverse momentum of the quark and is the color of the quark. This choice of basis is very similar to the discretized momentum representation Pauli and Brodsky 1985; Eller et al. 1987.
We then expand the quark state as a sum over the QCD eigenstates:
| (14) |
where are the basis coefficients. The initial state at can be specified by as a vector . The solution of Eq. (4) can be written in the QCD eigenstate basis in the matrix form as
| (15) |
where the matrix elements of are defined as . Once we know the wavefunction of the state via , it is straightforward to evaluate observables from it.
II.4 Numerical scheme
In the numerical calculation, the fields are color SU(3) matrices on the sites of a 3-dimensional discrete space. The 2-dimensional transverse space is a lattice extending from to for each side. The number of transverse lattice sites is , giving the lattice spacing . As such, a vector would read as,
This space satisfies periodic boundary conditions. It follows that in the momentum space, for any vector, ,
where is the resolution in momentum space. The momentum space extends from to . Therefore, the transverse lattice introduces a pair of IR and UV cutoffs, and . We include details of the conventions and relations in the discrete space in Appendix C.
The longitudinal dimension of the field (note that this is the light-front time of the incident quark) is discretized into a number of layers Lappi 2008. If the field extends along , each layer would have an expansion of . For example, the -th () layer extends as .
To summarize, our calculation depends on those numerical parameters.
- •
, color charge density parameter. We take different values for it and study how observables depend on it.
- •
, screening mass, the IR regulator. We will take and use a range of values when investigating its role.
- •
The transverse lattice: size , number and spacing . In most cases, we take as estimated from the radius of gold nucleus. Exceptions will be separately noted.
- •
The direction: duration , the number of layers and interval . We take and study the convergence on .
In this discretized space, the correlation relation of the color charge as defined in Eq. (7) also takes a discrete form as,
| (16) |
Note that the Kronecker delta dividing the discrete resolution replaces the Dirac delta in Eq. (7), and they converge in the continuous limit of and .
III Numerical Results
In this section, we discuss various observables obtained from the tBLFQ formalism. We first study the total and elastic cross sections, and support our approach by comparing to predictions in the eikonal limit. We then study the differential cross section and look into the time evolution of the quark’s distribution in transverse coordinate space and color space. We further relax the eikonal condition and explore sub-eikonal effects with finite .
III.1 The cross sections
The cross section is calculated as the sum of the squares of the transition amplitudes. Peskin and Schroeder 1995,
| (17) | ||||
stands for the initial state, and is the final state; sums over the phase space of the final state. The in the equation is the evolution operator from the initial state to the final through a finite time transition, and is different from the case where one takes the infinite time limit. In evaluating the cross section, one should average over the color charge density as in Eq. (7). This would give us the total cross section by definition,
| (18) | ||||
The total cross section is the summation of the elastic contribution and the inelastic contributions (, , etc.), Kovchegov and Levin 2012. To calculate the elastic cross section, we carry out the configuration average on the amplitude level to get the elastic scattering amplitude first, and afterwards square it Mueller 1998; Kovchegov and McLerran 1999; Dumitru and Jalilian-Marian 2002.
| (19) |
In the eikonal limit, the longitudinal momentum of the quark is infinite, , thus the phase factor (see text associated with Eq. (3)) is 1 and reduces to . In this limit, the cross sections can be expressed analytically in terms of the charge density , the interaction duration , the IR cutoff and the UV cutoff Dumitru and Jalilian-Marian 2002. A detailed derivation of the interaction matrix is included in Appendix D.
| (20) | ||||
We have introduced the screening mass as the IR regulator, therefore . Though the gluon field has a UV divergence, the cross sections have finite limits. We therefore do not implement such a cutoff in calculating the cross sections unless specified.
We first calculate the total and elastic cross sections in the eikonal limit and compare our results with the eikonal expectations in Eq. (20). We also study the sensitivity of the cross sections to the parameters, , and . We then relax the eikonal condition to allow a finite , and explore potential effects. The light-front kinetic energy of the quark is calculated as , we use in the presented results. We have checked that using quark mass in the range of does not make noticeable change in the results.
We then check the dependence of the cross sections on the lattice by varying and . Note that a reasonable numerical grid should cover the physical range of interest. In this case, we should make sure that the numerical IR cutoff is much smaller than the physical IR cutoff , and the numerical UV cutoff much higher than that. Thus a suitable grid for our investigation should satisfy:
| (21) |
Figure 2 represents the total and elastic cross sections as functions of at different for a fixed . The results show a convergence with increasing . We take the standard deviation of the 100 averaged configurations as the uncertainty. Such uncertainty is smaller at larger . This is not hard to imagine, since with more sites on the lattice, the fluctuation of each configuration is more likely to smooth out when averaged over equal number of events.
Most importantly, there is a good agreement between the tBLFQ results and the eikonal analytical expectations calculated from Eq. (20). This agreement helps verify our formalism.
The dependence of the cross sections on the grid size is also checked and shown in Figure 3. The total and elastic cross sections are calculated as functions of at different for a fixed lattice spacing . The results show agreement with the eikonal analytical expectations from Eq. (20). We again observe that the lattice with a larger number of grids has smaller uncertainties. The cross sections are not sensitive to the grid size.
We next show in Fig. 4 the dependence of the cross sections on the number of layers in the longitudinal direction, . An interesting “oscillation” pattern is observed when . At , the source hence the gluon field along is constant, this breaks one necessary ingredient for the CGC field: sources are uncorrelated along , as in Eq. (7). It follows that in deriving the analytical expression of the cross section, the contraction of multiple sources is no longer preserved, causing a nontrivial “oscillation”. In our calculation, the duration is divided into layers, each lasting equally for . The color charges from different layers belong to different nucleons, so they are uncorrelated with each other, as in Eq. (16). Within each layer, the field is constant along . The continuum limit is restored at , as in Eq. (22).
This “oscillation” gets strongly suppressed when , and for larger , the physical results converge to the analytical expectation and depend very little on , as shown in Fig. 4.
| (22) | ||||
Another dependence of the cross sections comes from the IR cutoff . Fig. 5 presents the cross sections evaluated at different on the same grid. These values are covered by the grid range (see Eq. (21) and the associated discussion), and the cross sections agree well with the analytical eikonal expectation. Though not shown in the figure, we found that when the value is not between the numerical IR and UV cutoffs , the results would start to deviate from the expectations.
We have seen that the cross sections in the eikonal limit agree with the analytical expectations. We now relax the condition so that we have finite and see if this could affect the cross section. Figure 6 presents the cross sections at different values. It turns out that even for very small , the cross section does not show noticeable differences from the case.
The tBLFQ results of the cross sections agree well with the analytical eikonal expectations in the eikonal limit. It also shows good numerical convergences on the various parameters. To study differences from the eikonal limit, we will investigate other observables that depend on additional kinematic variables in what follows.
III.2 The differential cross sections
The differential cross section is also of great interest. Convoluted with the quark distribution function of the proton at the factorization scale, the cross section can be obtained from the cross section.
In Fig. 7, we present the tBLFQ calculations and compare with perturbative approximations. The differential cross section in the eikonal limit is given in Ref. Dumitru and Jalilian-Marian 2002, and we derive its perturbative approximations as power series expansions of in Appendix E. In the large region, i.e. , the tBLFQ results agree with the leading order (LO) and next-to-leading order (NLO) perturbative calculations, whereas at small region, the perturbation approximation deviates.
We also check the dependence of the differential cross section on the grid parameters, and . Like the total and the elastic cross sections, the dependence is not noticeable for grids covering the physical range. The result is also not sensitive to the longitudinal resolution, , as in Fig. 8. Unlike the cross sections, no “oscillation” pattern appears even at .
III.3 The evolution of the quark state
By carrying out the explicit time-evolution of the quark, we are able to access the intermediate information and investigate the process of the quark-nucleus scattering. In particular, we study how the quark evolves in two aspects, the transverse coordinate space and the color space.
To explore how the quark state evolves in the transverse coordinate space, we take the initial state of the quark to be a Gaussian packet , where and is the normalization coefficient. This chosen Gaussian packet has a rather small width, such that the quark is still relatively localized though not point-like. Snapshots of the quark’s transverse coordinate distribution at a sequence of light-front time are presented in Fig. 9. In the eikonal limit, i.e. , the quark does not change its transverse location. But with finite values of , the quark undergoes changes in its transverse coordinate distribution. In the plot of a single event as shown in Fig. 9(b), the quark dissipates with a random pattern, which is related to the randomly generated field. In the plot of averaged event as shown in Fig. 9(c), the quark spreads out more evenly, as expected by averaging the field configurations.


We know that even without an external field, the quark should dissipate in the coordinate space with a finite . For comparison, Fig. 10 shows the evolution of the quark’s transverse coordinate distribution when no external field exists. The quark spreads out slower with the expected simple isotropic pattern compared with cases where external field exists.

To study the effect of the external field quantitatively, we calculate the expectation value of the quark’s transverse coordinate in cases with and without external fields.
We first show how the energy scale of the quark, , and the color charge density, , affect the evolution. Fig. 11 presents the expectation value of the quark’s transverse coordinate as a function of light-front time at various and for a range of color charge densities. It shows that the CGC field promotes the quark’s dissipation in the transverse plane compared with the no-field case (). In concert with simple intuition, the quark spreads faster with smaller and larger color charge density.
We also check the sensitivity of the quark’s evolution to grid parameters at different color charge densities. Results at different lattice size and at different color charge densities with a fixed lattice spacing of are compared in Fig. 12. We find that the evolution is not very sensitive to the lattice size described by these parameters over the range of values shown.
We study the dependence on the grid number at a selection of external field strengths in Fig. 13. When the external field is absent or weak, the evolution of agrees among these cases with different . However, with a strong external field, the evolution of diverges, as seen in Fig. 13(a). This divergence is expected from the ultravioletly divergent gluon field, as discussed in text associated with Eq. (10). We verify this source of divergence by imposing an explicit UV cutoff on the gluon field. The results become better converged, that is independent of at the stronger field strength, with the imposed UV cutoff, as presented in Fig. 13(b).
The quark admits changes in the transverse coordinate at finite , and this is achieved through the phase factor with . One might then expect that using different values of the quark mass could influence this effect. However, since does not change through the interaction, is the same for all basis states and therefore, and cancel out in the phase factors, leaving (see Eq. (3) and associated text). We show that the role of the quark mass is indeed minimal at a selection of color charge densities by using and in Fig. 14.
In the color space, the quark evolves toward a uniformly distributed state, . This is shown in Fig. 15. The quark evolves faster in the color space with larger color charge density as may be expected but does not show significant dependence on when comparing the and results.
III.4 Profiled CGC field
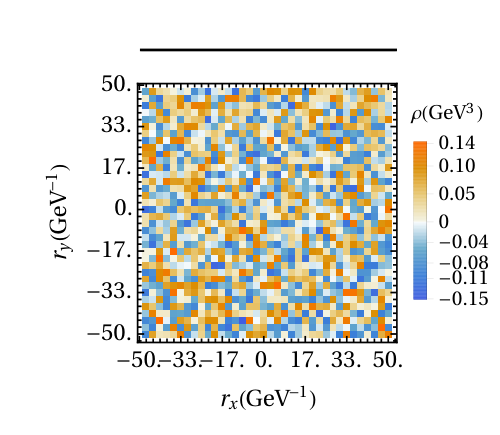
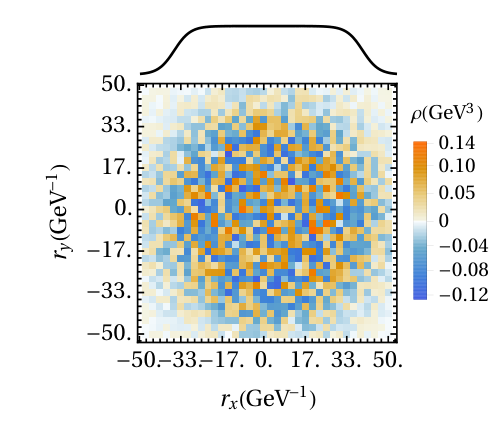
The CGC field we adopt so far is uniform in the transverse plane. In reality, the field generated from a large nucleus should be stronger at the center than on the edges. We take this into consideration by introducing a Gaussian profile and a Woods-Saxon profile to scale the CGC field in the transverse coordinate space.
In the Gaussian form, the scale factor reads
| (23) |
where is taken as the nuclear radius. For the gold nucleus, .
In the Woods-Saxon form, the scale factor reads
| (24) |
We use the usual parametrization, where is taken as the nuclear radius and is the surface diffuseness Suhonen 2007.
We revisit the quark’s evolution, the cross section and the -dependent differential cross section in Fig. 16.
To study the total cross sections with different profiles, we choose the initial state of the quark as , such that the quark is distributed on the entire transverse space. We find that the total cross sections are smaller with the Gaussian and Woods-Saxon profiles where the background fields are also smaller overall, as shown in Fig. 16(d). Note that we use as the total cross section, which is equivalent to the average of over the entire transverse space with area . For the uniform profile, , since the color charge density is a constant on the transverse plane. But for both the Gaussian and the Woods-Saxon profiles, the cross section as a function of the impact parameter is not constant. The tBLFQ result is computed in the transverse momentum space which automatically sums over the contributions in the entire transverse coordinate space, and gives .
The differential cross section is more peaked around when the fields are scaled by these two profiles, as shown in Fig. 16(e). Considering that the initial state is , the profiled fields which are reduced in strength, make less change to the quark state compared to the uniform field.
However, the evolution of does not seem to be sensitive to the profiles, as shown in Fig. 16(f). This is likely for the reason that during the evolution process the quark state is still constrained in the central area where all three profiles have similar strengths of the field.

IV Conclusions and outlook
In this work, we applied the tBLFQ formalism to a QCD problem for the first time, the quark-nucleus scattering. We are able to access the wavefunction of the quark at any intermediate time during the evolution. This provides us with an opportunity to carry out detailed studies of the time-dependent process.
Our results of the total and differential cross sections are in good agreement with the analytical expectations under the eikonal condition . In the sub-eikonal case with a finite , the cross sections do not show noticeable deviation from the eikonal limit. However, there are clear sub-eikonal effects shown from the distribution of the quark’s transverse coordinate. At finite , the quark admits changes in its transverse coordinate distribution. We aim to study the implication on transverse momentum distribution in particle production in A collision in the future.
We used the single quark sector to carry out the calculations as an initial investigation. In general, the single dressed quark state expands in the Fock space,
| (25) |
This includes the bare quark as well as its dressed states with gluons and sea quarks. With the parameter sensitivities established in the present work, we are enabled to extend the Fock space to and study gluon emission and absorption during the collision process. The QCD Lagrangian will then be restored by including the dynamical gluon in Eq. (1).
In this work, we take the MV model as the background field of the nucleus, and keep the dominant field component () in our calculation. In future works, we also hope to include the transverse component of the color field () and further investigate its role in the evolution process, for example, the effect on the spin of the quark.
We foresee more applications of the tBLFQ approach to scattering processes in the near future. The work on quark-nucleus scattering formulated in this paper could be extended to the -nucleus and -nucleus scatterings, which are the basic ingredients of any cross section at high energies. We also look forward to investigating the particle production and evolution in the glasma field created by heavy-ion collisions.
Acknowledgments
We wish to thank Shaoyang Jia, Wenyang Qian, Shuo Tang, Anji Yu for valuable discussions. M. Li acknowledges the communication with A. Dumitru and discussions with M. Sievert, G. Beuf and T. Lappi. M. Li would also like to thank the hospitality of the QCD Theory Group of University of Jyväskylä during the progress of this work. G. Chen acknowledges discussion with R.J. Fries on this project. X. Zhao is supported by Key Research Program of Frontier Sciences, CAS, Grant No ZDBS-LY-7020. This work was supported in part by the US Department of Energy (DOE) under Grant Nos. DE-FG02-87ER40371, DE-SC0018223 (SciDAC-4/NUCLEI), DE-SC0015376 (DOE Topical Collaboration in Nuclear Theory for Double-Beta Decay and Fundamental Symmetries). This research used resources of the National Energy Research Scientific Computing Center (NERSC), a U.S. Department of Energy Office of Science User Facility operated under Contract No. DE-AC02-05CH11231. This work has been supported in part by the European Research Council (ERC) under the European Union’s Horizon 2020 research and innovation programme (grant agreement No ERC-2015-CoG-681707). The content of this article does not reflect the official opinion of the European Union and responsibility for the information and views expressed therein lies entirely with the authors.
Appendix A Conventions
The light-front coordinates are defined as , where is the light-front time, is the longitudinal coordinate and are the transverse coordinates. Non-vanishing elements of the metric tensor are
| (26) |
The Dirac matrices are four unitary traceless matrices:
| (27) | ||||
where,
| (28) |
We use the following spinor representation,
| (29) |
Appendix B The interaction time
To estimate , consider the quark moving along the positive-z direction with speed and the nucleus moving along the negative-z direction with speed , as illustrated in Fig. 1. The starting point of the quark-nucleus interaction is at , i.e. . The end point of their interaction is at . Thereby,
| (30) | ||||
is the width of the nucleus in its rest frame. If we consider a gold beam at the RHIC energy of , and estimate its velocity according to with the mass of gold nucleus, thereby . Its rest width for a central impact is . Assuming that the quark has the same speed, i.e. , we get , which is small just as we expected. However the color field generated by the nucleus is identified as the small momentum degrees of freedom in the nucleus, and should admit a smaller longitudinal momentum scaled by Bjorken-x, . The resulting Lorentz factor is also scaled as . At , , and at , . We therefore take as the duration of the color field along in our calculations.
Appendix C Discretization
In the numerical calculation, the fields are SU(3) matrices on the sites of a 3-dimensional discrete space. The 2-dimensional transverse space is a lattice extending from to for each side. The number of transverse lattice sites is , giving the lattice spacing . For any vector in this space, ,
This space satisfies periodic boundary conditions. It follows that in the momentum space, for any vector, ,
where is the resolution in momentum space. The momentum space extends from to .
The conversion of the integration is
| (31) |
The Dirac delta is converted to the Kronecker delta as follows
| (32) | ||||
and
| (33) | ||||
The (inverse-)Fourier transformation becomes
| (34) | ||||
Appendix D The eikonal limit of the interaction matrix
In the eikonal approximation, the momentum of the quark is dominated by and correspondingly for the target . This is usually simplified as and . In such circumstances, the interaction picture and the Schrödinger picture become equivalent, . In our calculation, the field exists during . The evolution of the quark can be written in terms of the Wilson line,
| (35) |
The physical observables such as the cross section could be determined from the configuration average of the Wilson line, as . The Taylor expansion of the time-ordered exponential function leads to
| (36) | ||||
where is given in Eq. (10). According to the correlation function of given in Eq. (7), the configuration average for the production of odd number charge densities is zero; for even number cases , only the adjacent contractions survive under the time-ordered integrals.
| (37) | ||||
The integral on each of the two-point charge correlators can be carried out separately, and then the Wilson line can be recollected into an exponential,
| (38) |
Note that is the identity matrix in the color space.
Appendix E Perturbative approximations of the differential cross section in the eikonal limit
In the eikonal limit, the differential cross section is given by Dumitru and Jalilian-Marian 2002,
| (39) | ||||
Note that is the difference between the quark’s initial and final transverse momentum. Therefore for numerical calculation, it is convenient to study the differential cross section with the quark’s initial state as , and this is also what we did in this work.
We implement an infrared cutoff on the integral of the transverse momentum , such that
| (40) | ||||
and
| (41) | ||||
The first term of Eq. (39) contributes to region. Expand the exponential over to its second order,
| (42) | ||||
The second term of Eq. (39) contributes to . We also expand the exponential over to its second order,
| (43) | ||||
The approximation up to the leading order (LO) of is
| (44) | ||||
The approximation up to the next-to-leading order (NLO) is
| (45) | ||||
References
- Dumitru and Jalilian-Marian (2002) A. Dumitru and J. Jalilian-Marian, Phys. Rev. Lett. 89, 022301 (2002), arXiv:hep-ph/0204028 [hep-ph] .
- Tuchin (2004) K. Tuchin, Phys. Lett. B593, 66 (2004), arXiv:hep-ph/0401022 [hep-ph] .
- Kovchegov and Tuchin (2006) Y. V. Kovchegov and K. Tuchin, Phys. Rev. D74, 054014 (2006), arXiv:hep-ph/0603055 [hep-ph] .
- Gribov et al. (1983) L. V. Gribov, E. M. Levin, and M. G. Ryskin, Phys. Rept. 100, 1 (1983).
- Mueller and Qiu (1986) A. H. Mueller and J.-w. Qiu, Nucl. Phys. B268, 427 (1986).
- Gelis et al. (2010) F. Gelis, E. Iancu, J. Jalilian-Marian, and R. Venugopalan, Ann. Rev. Nucl. Part. Sci. 60, 463 (2010), arXiv:1002.0333 [hep-ph] .
- Weigert (2005) H. Weigert, Prog. Part. Nucl. Phys. 55, 461 (2005), arXiv:hep-ph/0501087 [hep-ph] .
- Kovchegov and Levin (2012) Y. V. Kovchegov and E. Levin, Camb. Monogr. Part. Phys. Nucl. Phys. Cosmol. 33, 1 (2012).
- Accardi et al. (2016) A. Accardi et al., Eur. Phys. J. A52, 268 (2016), arXiv:1212.1701 [nucl-ex] .
- Zhao et al. (2013) X. Zhao, A. Ilderton, P. Maris, and J. P. Vary, Phys. Rev. D88, 065014 (2013), arXiv:1303.3273 [nucl-th] .
- Vary et al. (2010) J. P. Vary, H. Honkanen, J. Li, P. Maris, S. J. Brodsky, A. Harindranath, G. F. de Teramond, P. Sternberg, E. G. Ng, and C. Yang, Phys. Rev. C81, 035205 (2010), arXiv:0905.1411 [nucl-th] .
- Wiecki et al. (2015) P. Wiecki, Y. Li, X. Zhao, P. Maris, and J. P. Vary, Phys. Rev. D91, 105009 (2015), arXiv:1404.6234 [nucl-th] .
- Li et al. (2016) Y. Li, P. Maris, X. Zhao, and J. P. Vary, Phys. Lett. B758, 118 (2016), arXiv:1509.07212 [hep-ph] .
- Li et al. (2017) Y. Li, P. Maris, and J. P. Vary, Phys. Rev. D96, 016022 (2017), arXiv:1704.06968 [hep-ph] .
- Tang et al. (2018) S. Tang, Y. Li, P. Maris, and J. P. Vary, Phys. Rev. D98, 114038 (2018), arXiv:1810.05971 [nucl-th] .
- Tang et al. (2019) S. Tang, Y. Li, P. Maris, and J. P. Vary, (2019), arXiv:1912.02088 [nucl-th] .
- Jia and Vary (2019) S. Jia and J. P. Vary, Phys. Rev. C99, 035206 (2019), arXiv:1811.08512 [nucl-th] .
- Du et al. (2019) W. Du, Y. Li, X. Zhao, G. A. Miller, and J. P. Vary, (2019), arXiv:1911.10762 [nucl-th] .
- Hu et al. (2019) B. Hu, A. Ilderton, and X. Zhao, (2019), arXiv:1911.12307 [nucl-th] .
- Chen et al. (2017) G. Chen, X. Zhao, Y. Li, K. Tuchin, and J. P. Vary, Phys. Rev. D95, 096012 (2017), arXiv:1702.06932 [nucl-th] .
- Du et al. (2018) W. Du, P. Yin, Y. Li, G. Chen, W. Zuo, X. Zhao, and J. P. Vary, Phys. Rev. C97, 064620 (2018), arXiv:1804.01156 [nucl-th] .
- Yin et al. (2019) P. Yin, W. Du, W. Zuo, X. Zhao, and J. P. Vary, (2019), arXiv:1910.10586 [nucl-th] .
- McLerran and Venugopalan (1994a) L. D. McLerran and R. Venugopalan, Phys. Rev. D49, 2233 (1994a), arXiv:hep-ph/9309289 [hep-ph] .
- McLerran and Venugopalan (1994b) L. D. McLerran and R. Venugopalan, Phys. Rev. D49, 3352 (1994b), arXiv:hep-ph/9311205 [hep-ph] .
- McLerran and Venugopalan (1994c) L. D. McLerran and R. Venugopalan, Phys. Rev. D50, 2225 (1994c), arXiv:hep-ph/9402335 [hep-ph] .
- Jalilian-Marian (2017) J. Jalilian-Marian, Phys. Rev. D96, 074020 (2017), arXiv:1708.07533 [hep-ph] .
- Jalilian-Marian (2019a) J. Jalilian-Marian, (2019a), arXiv:1912.08878 [hep-ph] .
- Jalilian-Marian (2019b) J. Jalilian-Marian, Phys. Rev. D99, 014043 (2019b), arXiv:1809.04625 [hep-ph] .
- Kovchegov and Sievert (2019a) Y. V. Kovchegov and M. D. Sievert, Phys. Rev. D99, 054032 (2019a), arXiv:1808.09010 [hep-ph] .
- Kovchegov and Sievert (2019b) Y. V. Kovchegov and M. D. Sievert, Phys. Rev. D99, 054033 (2019b), arXiv:1808.10354 [hep-ph] .
- Altinoluk et al. (2016) T. Altinoluk, N. Armesto, G. Beuf, and A. Moscoso, JHEP 01, 114 (2016), arXiv:1505.01400 [hep-ph] .
- Chirilli (2019) G. A. Chirilli, JHEP 01, 118 (2019), arXiv:1807.11435 [hep-ph] .
- Chen et al. (2015) G. Chen, R. J. Fries, J. I. Kapusta, and Y. Li, Phys. Rev. C92, 064912 (2015), arXiv:1507.03524 [nucl-th] .
- Brodsky et al. (1998) S. J. Brodsky, H.-C. Pauli, and S. S. Pinsky, Phys. Rept. 301, 299 (1998), arXiv:hep-ph/9705477 [hep-ph] .
- McLerran and Venugopalan (1999) L. D. McLerran and R. Venugopalan, Phys. Rev. D59, 094002 (1999), arXiv:hep-ph/9809427 [hep-ph] .
- Jalilian-Marian et al. (1997) J. Jalilian-Marian, A. Kovner, L. D. McLerran, and H. Weigert, Phys. Rev. D55, 5414 (1997), arXiv:hep-ph/9606337 [hep-ph] .
- Krasnitz et al. (2003) A. Krasnitz, Y. Nara, and R. Venugopalan, Nucl. Phys. A717, 268 (2003), arXiv:hep-ph/0209269 [hep-ph] .
- Lappi (2006) T. Lappi, Phys. Lett. B643, 11 (2006), arXiv:hep-ph/0606207 [hep-ph] .
- Müller (2019) D. Müller, Simulations of the Glasma in 3+1D, Ph.D. thesis, TU Vienna (2019), arXiv:1904.04267 [hep-ph] .
- Fukushima and Hidaka (2007) K. Fukushima and Y. Hidaka, JHEP 06, 040 (2007), arXiv:0704.2806 [hep-ph] .
- Pauli and Brodsky (1985) H. C. Pauli and S. J. Brodsky, Phys. Rev. D32, 1993 (1985).
- Eller et al. (1987) T. Eller, H. C. Pauli, and S. J. Brodsky, Phys. Rev. D35, 1493 (1987).
- Lappi (2008) T. Lappi, Eur. Phys. J. C55, 285 (2008), arXiv:0711.3039 [hep-ph] .
- Peskin and Schroeder (1995) M. E. Peskin and D. V. Schroeder, An Introduction to quantum field theory (Addison-Wesley, Reading, USA, 1995).
- Mueller (1998) A. H. Mueller, Workshop on Interplay between Soft and Hard Interactions in Deep Inelastic Scattering Heidelberg, Germany, September 29-October 1, 1997, Eur. Phys. J. A1, 19 (1998), arXiv:hep-ph/9710531 [hep-ph] .
- Kovchegov and McLerran (1999) Y. V. Kovchegov and L. D. McLerran, Phys. Rev. D60, 054025 (1999), [Erratum: Phys. Rev.D62,019901(2000)], arXiv:hep-ph/9903246 [hep-ph] .
- Suhonen (2007) J. Suhonen, From Nucleons to Nucleus, Theoretical and Mathematical Physics (Springer, Berlin, Germany, 2007).