ALMA CO Observations of the Host Galaxies of Long-duration Gamma-ray Bursts. I: Molecular Gas Scaling Relations
Abstract
We present the results of CO observations toward 14 host galaxies of long-duration gamma-ray bursts (GRBs) at –2.5 by using the Atacama Large Millimeter/submillimeter Array. We successfully detected CO(3–2) or CO(4–3) emission in eight hosts (–2), which more than doubles the sample size of GRB hosts with CO detection. The derived molecular gas mass is (0.2– assuming metallicity-dependent CO-to-H2 conversion factors. By using the largest sample of GRB hosts with molecular gas estimates (25 in total, of which 14 are CO-detected) including results from the literature, we compared molecular gas properties with those of other star-forming galaxies (SFGs). The GRB hosts tend to have a higher molecular gas mass fraction () and a shorter gas depletion timescale () as compared with other SFGs at similar redshifts especially at . This could be a common property of GRB hosts or an effect introduced by the selection of targets which are typically above the main-sequence line. To eliminate the effect of selection bias, we analyzed and as a function of the distance from the main-sequence line (MS). We find that the GRB hosts follow the same scaling relations as other SFGs, where increases and decreases with increasing . No molecular gas deficit is observed when compared to other SFGs of similar SFR and stellar mass. These findings suggest that the same star-formation mechanism is expected to be happening in GRB hosts as in other SFGs.
Keywords:
cosmology: observations — galaxies: high-redshift — galaxies: ISM — gamma rays: bursts — radio lines: galaxiesI Introduction
Long-duration gamma-ray bursts (GRBs) have been shown to be associated with the explosions of massive stars (Hjorth et al. 2003; Stanek et al. 2003, e.g.,). GRBs are expected to be a new tool for probing the star-forming activity in the distant universe (Totani 1997; Wijers et al. 1998; Kistler et al. 2009, e.g.,) because i) they are related to star formation, ii) they are bright enough to be observable in the cosmological distances (Tanvir et al. 2009; Salvaterra et al. 2009, e.g.,), and iii) observations of afterglows and host galaxies provide information about the interstellar medium or star-forming activity in GRB environments. It is still a subject of debate whether GRBs can be used as unbiased tracers of star formation, that is, whether GRBs occur in normal star-forming environments. For example, observations of GRB hosts suggest that GRBs occur more often in low-metallicity environments (Stanek et al. 2006; Levesque et al. 2010b; Graham, & Fruchter 2013; Perley et al. 2016, e.g.,). Theoretical models also support this preference for low-metallicity environments, where a line-driven mass loss in the progenitor is avoided to form an accretion disk upon collapse (Woosley & Heger 2006; Langer, & Norman 2006; Yoon et al. 2006, e.g.,). Although multi-wavelength observations of GRB hosts have been conducted, the understanding of the properties of molecular gas, which is the fuel for star formation, has not been well provided. Observations of molecular gas in GRB hosts are important for establishing the link between GRBs and star-forming activity. Although molecular hydrogen in absorption in the spectra of GRB afterglows provides useful information in the vicinity or line of sight to GRBs (Prochaska et al. 2009; Krühler et al. 2013; D’Elia et al. 2014, e.g.,), molecular lines need to be detected in emission to measure the gas content in host galaxies.
Searches for CO line emission have been conducted to probe molecular gas in GRB hosts (Kohno et al. 2005; Endo et al. 2007; Hatsukade et al. 2007; Hatsukade et al. 2011; Stanway et al. 2011). So far, six GRB hosts have been detected in CO emission: GRB 980425 at (Michałowski et al. 2018a), GRB 051022 at (Hatsukade et al. 2014), GRB 080207 at (Arabsalmani et al. 2018; Michałowski et al. 2018a; Hatsukade et al. 2019), GRB 080517 at (Stanway et al. 2015b), GRB 111005A at (Michałowski et al. 2018a), and 190114C at (de Ugarte Postigo et al. 2020). Earlier works have suggested a deficiency of molecular gas in GRB hosts for their star formation rate (SFR) or stellar mass (Hatsukade et al. 2014; Stanway et al. 2015b; Michałowski et al. 2016). Stanway et al. 2015b found a shorter gas depletion timescale for GRB hosts compared to local star-forming galaxies, suggesting that GRBs occur toward the end of a star formation episode or in the burst phase of star formation. A possible scenario is that a recent merger or gas inflow induced star formation and that the progenitor formed in the star formation episode that took place in newly accreted gas, as suggested in Hi observations (Michałowski et al. 2015; Arabsalmani et al. 2015, e.g.,). Michałowski et al. 2015 proposed that star formation proceeds directly in the atomic gas before it converts to the molecular phase, resulting a lower molecular gas mass for its SFR. However, recent studies have shown that the difference is not significant and that GRB hosts have more diverse molecular gas properties with an additional sample, appropriate CO-to-H2 conversion factors (), or choice of comparison sample (Arabsalmani et al. 2018; Michałowski et al. 2018a). Arabsalmani et al. 2018 detected the CO(3–2) line in a host of GRB 080207 with the Plateau de Bure/NOrthern Extended Millimeter Array (NOEMA). They found that the host was molecular gas-rich and that the molecular gas mass fraction and gas depletion timescale were comparable to those of typical star-forming galaxies at similar redshifts. Hatsukade et al. 2019 conducted a detailed study of the molecular gas properties in the same GRB host by using the CO(1–0) line data with the Karl G. Jansky Very Large Array (VLA) and spatially-resolved CO(4–3) line data with the Atacama Large Millimeter/submillimeter Array (ALMA). They found that the host had molecular gas properties (such as gas fraction, gas depletion timescale, gas-to-dust ratio, location in the gas mass–SFR relation, and kinematics) similar to those of main-sequence (MS) galaxies at similar redshifts. Michałowski et al. 2018a performed CO(2–1) observations of seven GRB hosts with the APEX and IRAM 30-m telescopes and detected three GRB hosts (GRBs 980425, 080207, and 111005A). They combined the hosts with previous CO observations and found that the GRB hosts have molecular properties that are consistent with those of other galaxies. Recently, de Ugarte Postigo et al. 2020 detected the CO(3–2) line in an interacting galaxy hosting GRB 190114C at and found a high molecular gas fraction.
Because the molecular gas mass fraction or depletion timescale are correlated with other physical quantities such as SFR, specific SFR (sSFR ), stellar mass, and the distance from the MS line (Saintonge et al. 2012; Magdis et al. 2012; Tacconi et al. 2013; Genzel et al. 2015; Tacconi et al. 2018, e.g.,), it is important to examine the molecular gas properties of GRB hosts with these parameters. So far, only a handful of GRB hosts have been detected in CO, and the sample size is too small to discuss the common characteristics of GRB hosts. In order to understand the molecular gas properties in GRB hosts, a larger sample with CO observations is necessary.
In this paper, we present the results of CO observations toward 14 GRB hosts conducted with ALMA. We more than doubled the sample size of GRB hosts with CO observations, providing the largest sample for statistical studies. The arrangement of this paper is as follows. Section II outlines the GRB hosts used in this study, the observations and data reduction, and the results. Section III describes the analysis of spectral energy distributions (SEDs) for obtaining SFRs and stellar masses of the targets. Section IV presents the derived physical quantities. In Section V, we describe the molecular gas properties of the hosts in comparison with other star-forming galaxy populations and discuss the scaling relations of molecular gas for GRB hosts and star-forming galaxies. Our conclusions are presented in Section VI. The spatially resolved properties of molecular gas and detailed analysis of the kinematics are presented in a separate paper. Throughout the paper, we adopt a cosmology with km s-1 Mpc-1, , and . SFRs in this paper are converted to a Chabrier 2003 initial mass function (IMF) from a Salpeter 1955 IMF by multiplying by 0.61. The forms of a Chabrier 2003 IMF and a Kroupa 2001 IMF are similar and we do not distinguish between them.
II Data
II.1 GRB Hosts
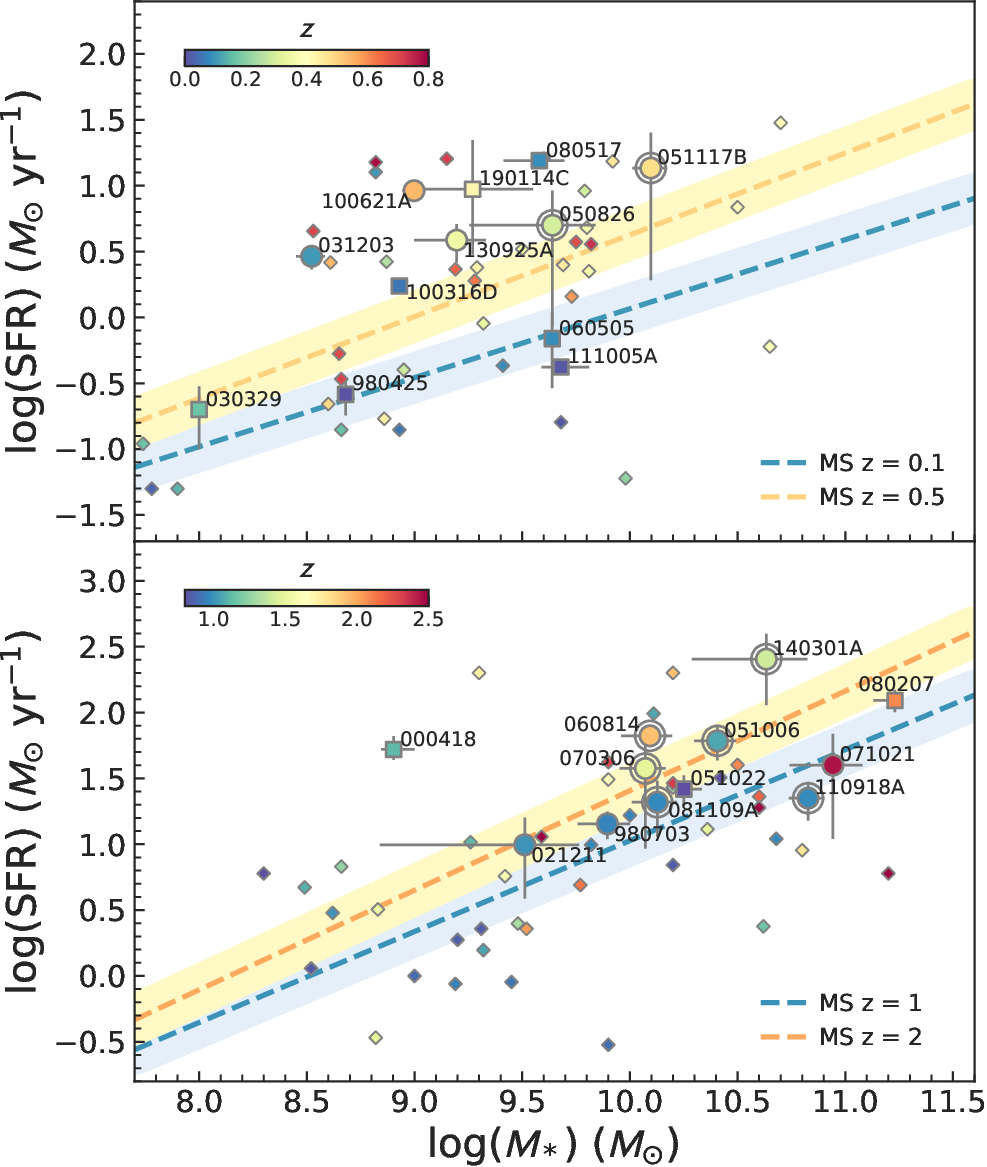
The targets were selected from previous studies on GRB hosts, where multi-wavelength analysis are available (Savaglio et al. 2009; Svensson et al. 2010; Krühler et al. 2015; Perley et al. 2013; Perley et al. 2015), thus allowing us to compare their physical quantities (such as SFR, stellar mass, or metallicity) with those of other galaxy populations. The selection criteria were as follows: (i) spectroscopic redshifts are determined to securely observe the CO lines, (ii) the redshifted CO line is observable with the ALMA bands, (iii) hosts with high SFRs (1 yr-1 at , 50 yr-1 at , and 150 yr-1 at ), and (iv) located at moderate redshifts () to ensure a significant constraint on the molecular gas mass. It is known that far-infrared luminosity () correlates well with CO luminosity () for local and high-redshift star-forming galaxies (Solomon & Vanden Bout 2005, e.g.,), and galaxies with high SFRs are expected to have a large amount of molecular gas. We selected 14 GRB hosts at –2.5 and their physical properties are presented in Table 1. The SFRs adopted here are corrected for dust extinction. It is possible that the GRB hosts with a higher radio-based SFR than a UV-based SFR have dust-obscured star-forming activity. The targets included dark GRBs (060814, 070306, 071021, 100621A, and GRB 130925A) whose afterglows are optically dark compared with what is expected from X-ray afterglows (Jakobsson et al. 2004; van der Horst et al. 2009).
The selection criteria could introduce biases to the sample. GRB hosts with a spectroscopic redshift tend to have a bright afterglow or are bright at optical/near infrared (NIR) wavelengths because the redshift determination is mainly conducted through optical/NIR spectroscopic observations, which might miss heavily dust-obscured hosts. The SFR selection criteria target more active star-forming hosts than typical GRB hosts. We compare the stellar mass and SFR for the targets along with MS star-forming galaxies at –2.5, taken from Speagle et al. 2014, in Figure 1. A majority of the targets are located above the MS line at their redshift. For comparison with other GRB hosts, we used the database of the GRB Host Studies (GHostS)11 1 http://www.grbhosts.org/ (Savaglio et al. 2006), which is a public database dedicated to GRB hosts; it contains information on more than 230 hosts. Figure 1 shows that our targets have a higher SFR compared to the GHostS sample. In order to take the possible bias into account, we compared their properties with those of other galaxy populations by introducing the offset from the MS of star-forming galaxies (Section V.3).
| GRB | Ref. | SFRUVa | Ref. | SFRHαb | Ref. | SFRRadioc | Ref. | d | Ref. | e | Ref. | |
|---|---|---|---|---|---|---|---|---|---|---|---|---|
| ( yr-1) | ( yr-1) | ( yr-1) | () | |||||||||
| 980703 | 1 | 13 | – | – | 20,21 | 13 | 8.15/8.31 | 18 | ||||
| 021211 | 2 | 13 | – | – | , 41, | 22,23,21 | 13 | 8.29f | – | |||
| 031203 | 3 | 13 | 2.9 | 18 | 24,22 | 13 | 8.19 | 27 | ||||
| 050826 | 4 | 0.85 | 14 | 1.8 | 18 | – | – | 18 | 8.48 | 18 | ||
| 051006 | 5 | 15 | – | – | 15 | 15 | 8.54f | – | ||||
| 051117B | 5 | 3.4 | 16 | 19 | 27 | 22 | 20.6 | 16 | 8.72 | 19 | ||
| 060814 | 6 | 15 | 19 | 15 | 15 | 8.15 | 21 | |||||
| 070306 | 7 | 15 | 19 | 15 | 15 | 8.36 | 19 | |||||
| 071021 | 6 | 13 | 19 | – | – | 13 | 8.12g | – | ||||
| 081109A | 8 | 13 | 19 | – | – | 13 | 8.51 | 19 | ||||
| 100621A | 9 | 8 | 19 | , 30 | 25,26 | 8 | 8.35 | 19 | ||||
| 110918A | 10 | 10 | 10 | 84 | 26 | 10 | 8.66 | 19 | ||||
| 130925A | 11 | 17 | 17 | – | – | 17 | 8.50 | 19 | ||||
| 140301A | 12 | – | – | 19 | – | – | – | – | 8.62 | 19 |
Note. — a UV-based SFR from SED fitting (corrected for extinction). b SFR from H luminosity (corrected for extinction). c SFR from radio continuum flux. d Stellar mass derived from SED fitting to UV–IR data. e Metallicity converted to the calibration of Pettini & Pagel 2004 by using the metallicity conversion of Kewley, & Ellison 2008. f Metallicity derived from the mass–metallicity conversion of Genzel et al. 2015. g Metallicity derived from the line fluxes reported in Krühler et al. 2015.
(1) Djorgovski et al. 1998; (2) Vreeswijk et al. 2003; (3) Prochaska et al. 2004; (4) Mirabal et al. 2007; (5) Jakobsson et al. 2012; (6) Krühler et al. 2012; (7) Jaunsen et al. 2008; (8) Krühler et al. 2011; (9) Milvang-Jensen et al. 2010; (10) Elliott et al. 2013; (11) Vreeswijk et al. 2013; (12) Krühler et al. 2014; (13) Perley et al. 2013; (14) Svensson et al. 2010; (15) Perley et al. 2015; (16) Krühler & Schady 2017; (17) Schady et al. 2015; (18) Levesque et al. 2010b; (19) Krühler et al. 2015; (20) Berger et al. 2003; (21) Perley et al. 2017a; (22) Michałowski et al. 2012; (23) Hatsukade et al. 2012; (24) Stanway et al. 2010; (25) Stanway et al. 2014; (26) Greiner et al. 2016; (27) Niino et al. 2017.
| GRB | COa | Band | b | Date | Config.c | d | e | Baselinef | (original)g | (tapered)h |
|---|---|---|---|---|---|---|---|---|---|---|
| (GHz) | (min) | (m) | (′′) | (′′) | ||||||
| 980703 | 4–3 | 6 | 234.507 | 2016-05-22 | C36-3 | 30 | 37 | 16.5–640.0 | ||
| 021211 | 4–3 | 6 | 229.831 | 2016-04-01 | C36-2/3 | 20 | 44 | 15.1–452.8 | – | |
| 031203 | 3–2 | 7 | 312.796 | 2016-07-14 | C40-5 | 11 | 36 | 15.1–867.2 | ||
| 050826 | 3–2 | 6 | 266.818 | 2016-10-19 | C40-6 | 81 | 44 | 16.7–1800 | ||
| 051006 | 4–3 | 6 | 223.915 | 2016-03-31 | C36-2/3 | 24 | 44 | 15.1–452.8 | – | |
| 051117B | 4–3 | 6 | 233.567 | 2016-10-19 | C40-6 | 90 | 44 | 16.7–1800 | ||
| 060814 | 3–2 | 4 | 157.729 | 2016-05-04 | C36-3 | 19 | 41 | 15.1–640.0 | – | |
| 070306 | 3–2 | 4 | 138.546 | 2016-04-28 | C36-2/3 | 44 | 41 | 15.1–640.0 | – | |
| 071021 | 4–3 | 4 | 133.558 | 2016-05-16 | C36-3 | 31 | 41 | 15.1–640.0 | – | |
| 081109A | 4–3 | 6 | 232.967 | 2016-05-16 | C36-3 | 19 | 40 | 15.1–640.0 | ||
| 100621A | 3–2 | 6 | 224.252 | 2016-04-01 | C36-2/3 | 21 | 44 | 15.1–452.8 | – | |
| 110918A | 4–3 | 6 | 232.344 | 2016-11-05 | C40-6 | 29 | 44 | 18.6–1100 | ||
| 2016-11-27 | C40-4 | 29 | 42 | 15.1–704.1 | ||||||
| 130925A | 3–2 | 6 | 256.468 | 2016-10-21 | C40-6 | 57 | 44 | 18.6–1800 | ||
| 140301A | 3–2 | 4 | 143.157 | 2016-10-21 | C40-6 | 41 | 44 | 18.6–1800 | ||
| 2016-10-22 | C40-6 | 41 | 39 | 18.6–1700 | ||||||
| NOTE. - a CO rotational transition. b Representative frequency. c Array configuration. d On-source integration time. e Number of antennas. f Range of baseline lengths. g Synthesized beam size in velocity-integrated CO intensity maps created with natural weighting without tapering the data. h Synthesized beam size in velocity-integrated CO intensity maps created with natural weighting and taper. | ||||||||||
In this study, we also utilized the data from CO observations in the literature: Six hosts with CO detection (GRBs 980425, 051022, 080207, 080517, 111005A, and 190114C) and five hosts with upper limits (GRBs 000418, 030329, 060505, 060814, and 100316D). We did not include the GRB 090423 host at (Stanway et al. 2011) because the physical properties (such as stellar mass or SFR) are not well constrained. The physical properties are summarized in Table 6 in Appendix A. The hosts are also plotted in Figure 1 for comparison with our targets.
II.2 Observations and Results
ALMA observations of the targets were conducted in March–November, 2016, for the Cycle 3 and Cycle 4 programs (Project code: 2015.1.00939.S and 2016.1.00455.S) as summarized in Table 2. In order to observe the CO line and dust continuum simultaneously, the CO(3–2) or CO(4–3) line was observed at band 4, 6, or 7 depending on the target redshift.
The required sensitivity was estimated by using the SFR– relation of Kennicutt 1998, and the –(3–2) relation of (3–2) (Iono et al. 2009). The typical 5 detection limit for molecular gas is shown in Figure 9 by assuming a Galactic CO-to-H2 conversion factor of 4.4 (K km s-1 pc2)-1 (Bolatto et al. 2013).
The correlator was used in the frequency domain mode with a bandwidth of 1875 MHz (488.28 kHz 3840 channels). Four spectral windows were used, providing a total bandwidth of 7.5 GHz. Bandpass, phase, and flux calibrations were done with nearby quasars. The second level of Quality Assurance (QA2) performed by the ALMA data reduction team was “PASS” except for the data set of the GRB 031203 host, where the QA2 was “SEMIPASS” because the synthesized beam size achieved was significantly smaller than requested and the rms noise level was higher than requested.
The data were reduced with Common Astronomy Software Applications (McMullin et al. 2007, CASA;).
Data calibration was done with the ALMA Science Pipeline Software of CASA versions 4.5.3, 4.7.0, and 4.7.2.
The maps were processed with a tclean task with the natural weighting.
The continuum maps were created with a total bandwidth of 7.5 GHz, excluding channels with emission lines.
Clean boxes were placed when a component with a peak signal-to-noise ratio (S/N) above 5 was identified, and
LEAN }ed down to a $2\sigma$ level.
The GRB hosts were observed with different array configurations.
All targets with a synthesized beam size smaller than $0\farcs7$ were {\it uv}-tapered with a value of 0\farcs8.
When a source was spatially resolved, the total flux was measured with a
ASA task imfit as an integrated flux density, otherwise the peak flux was adopted.
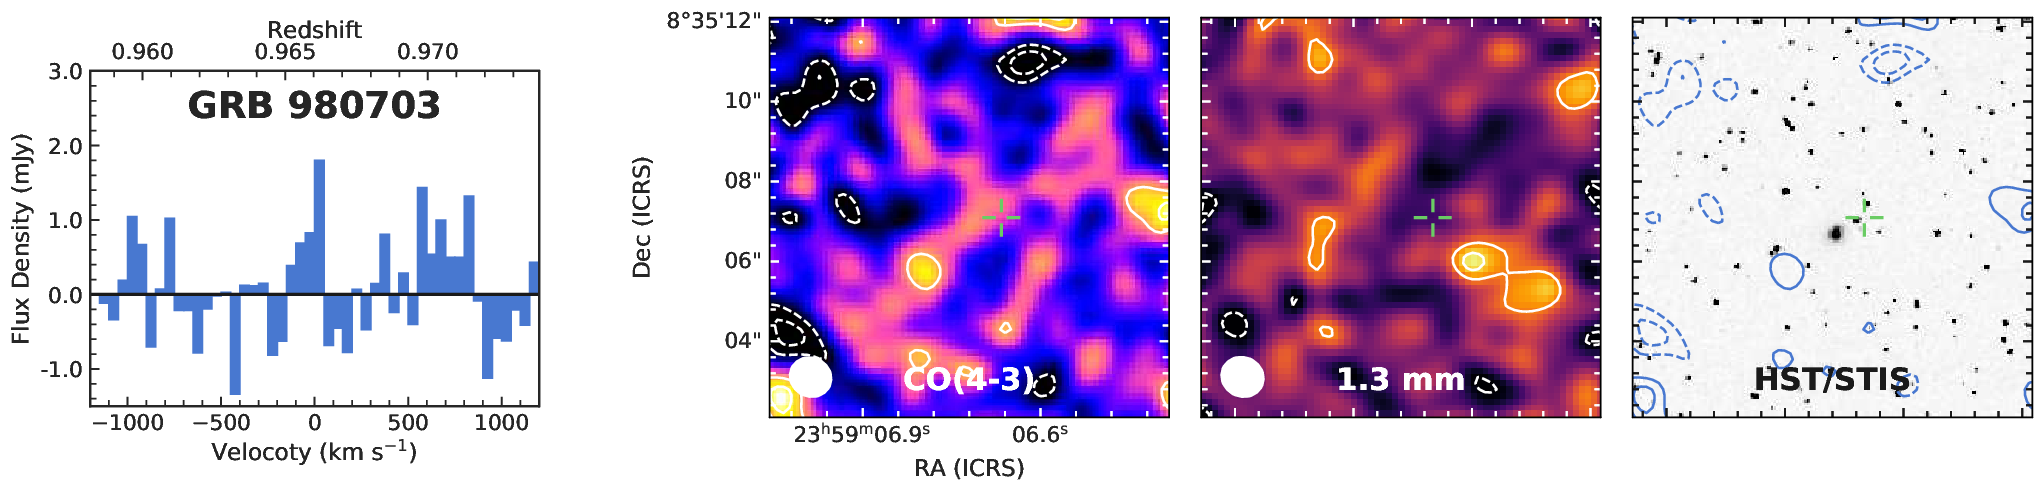
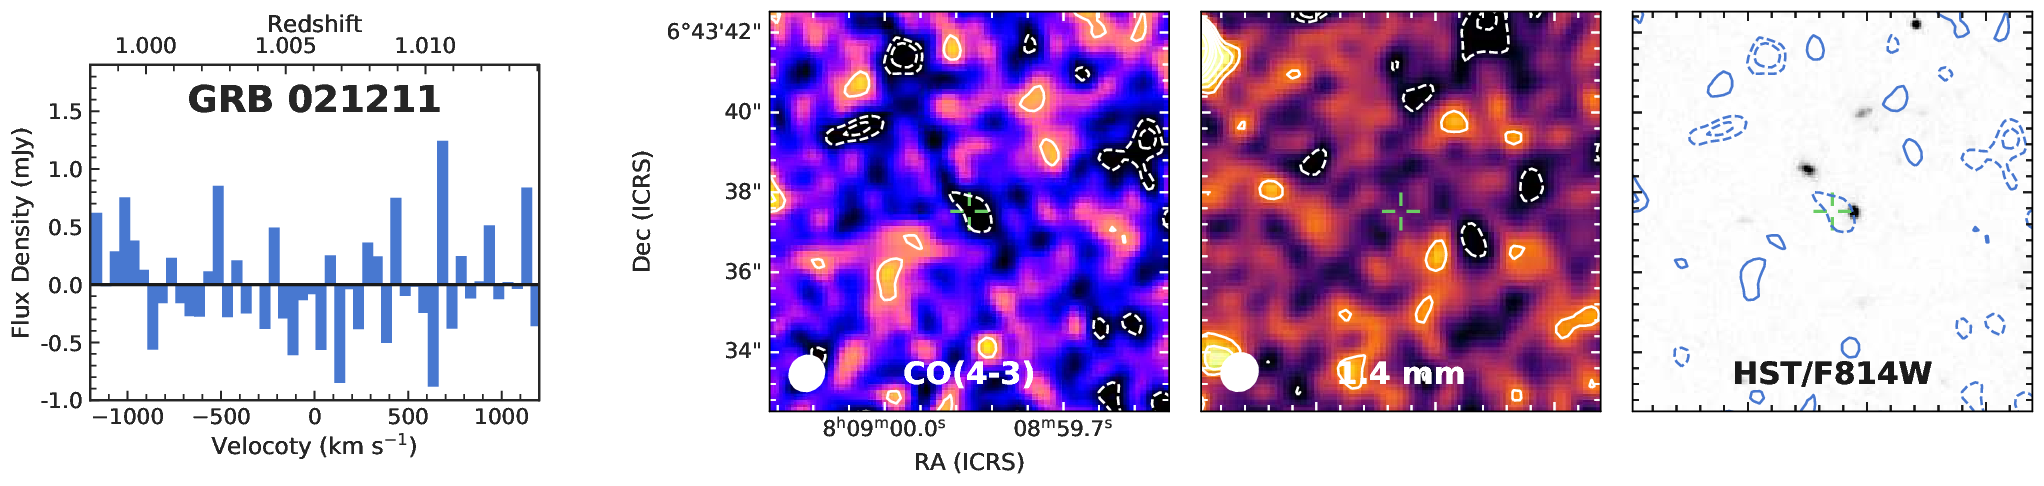
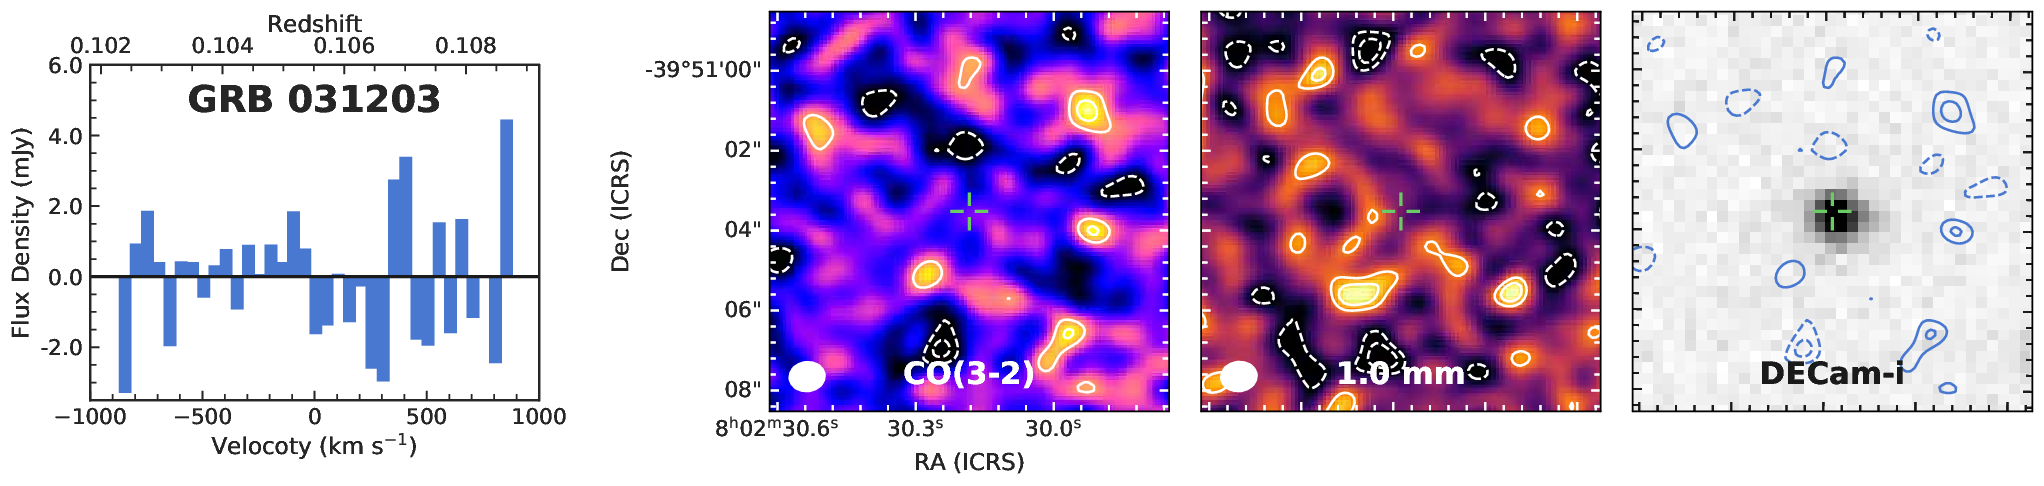
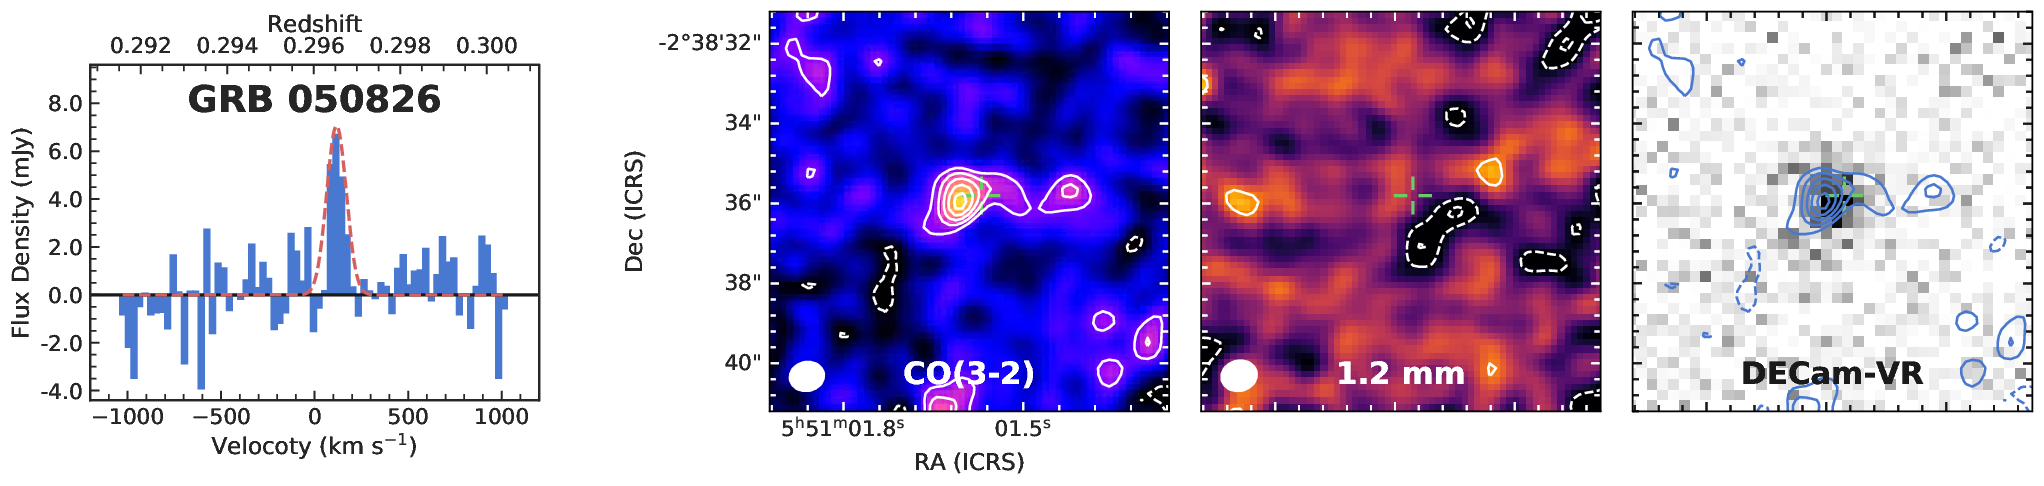
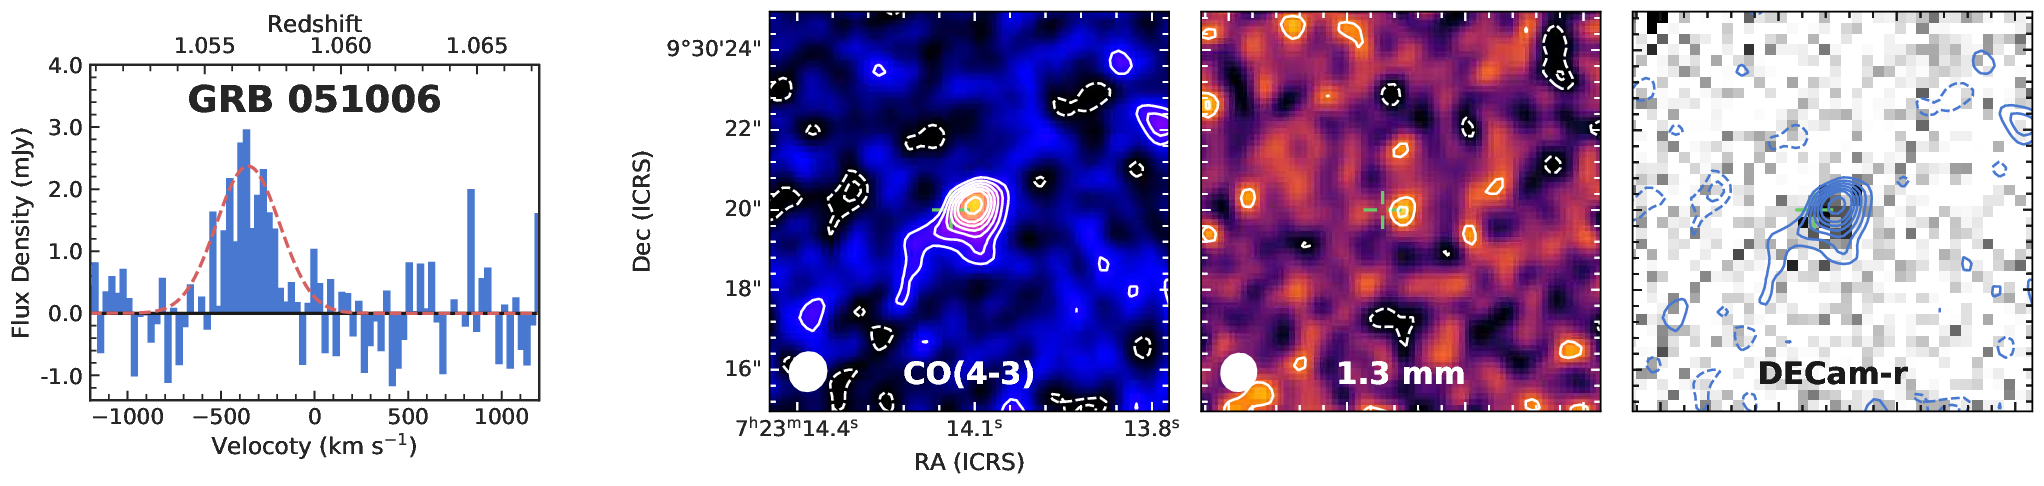
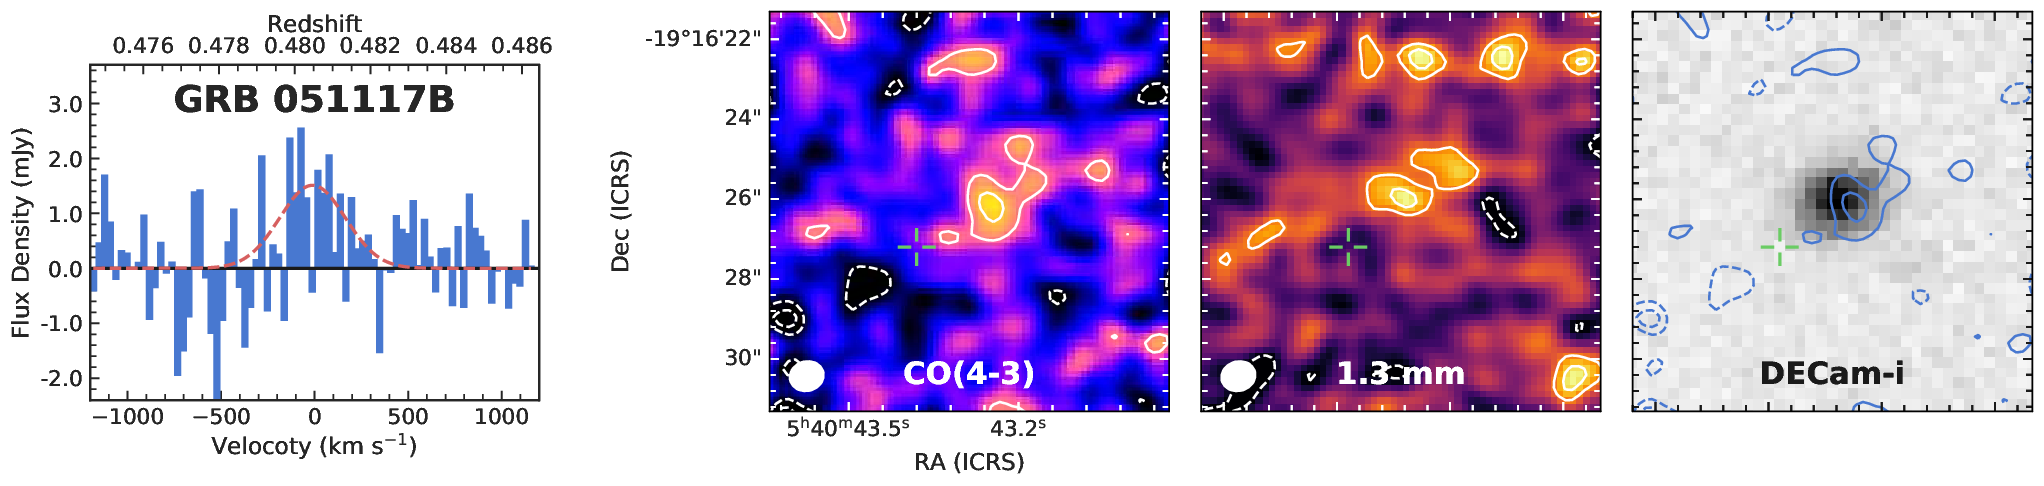
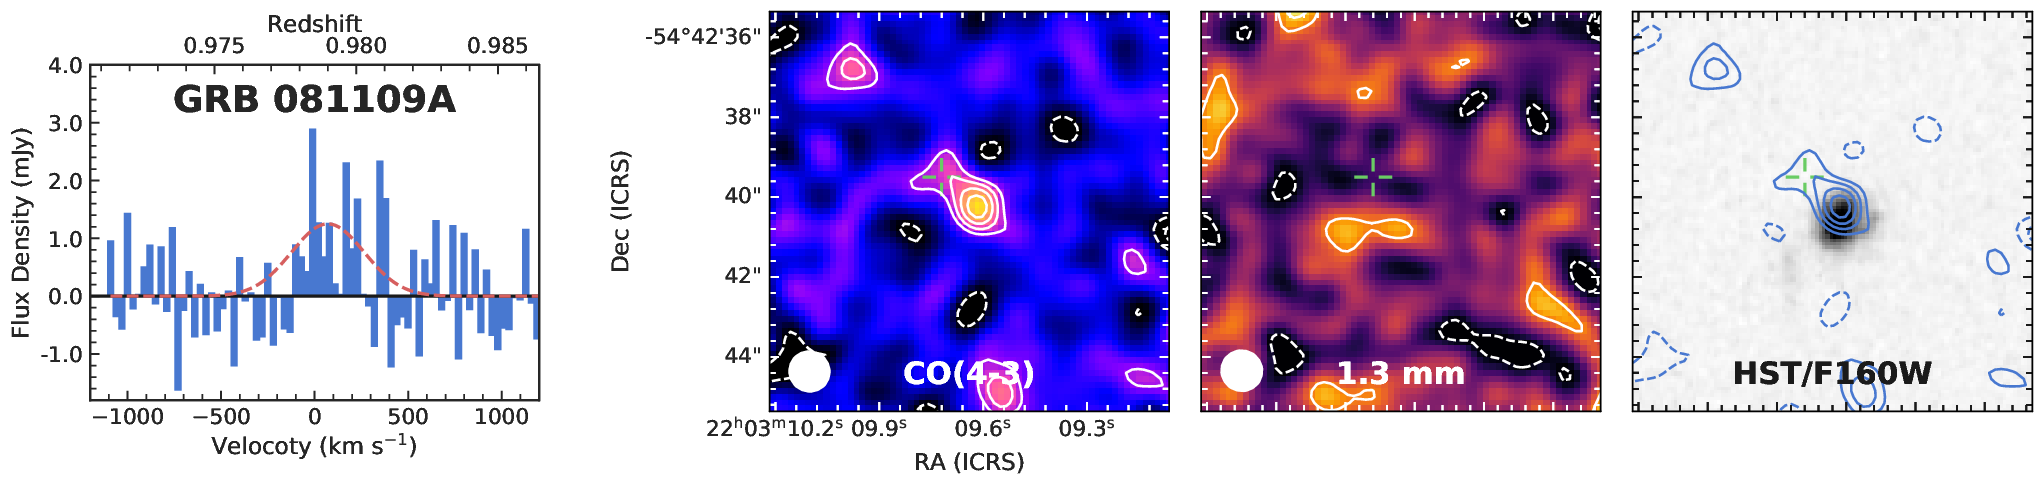
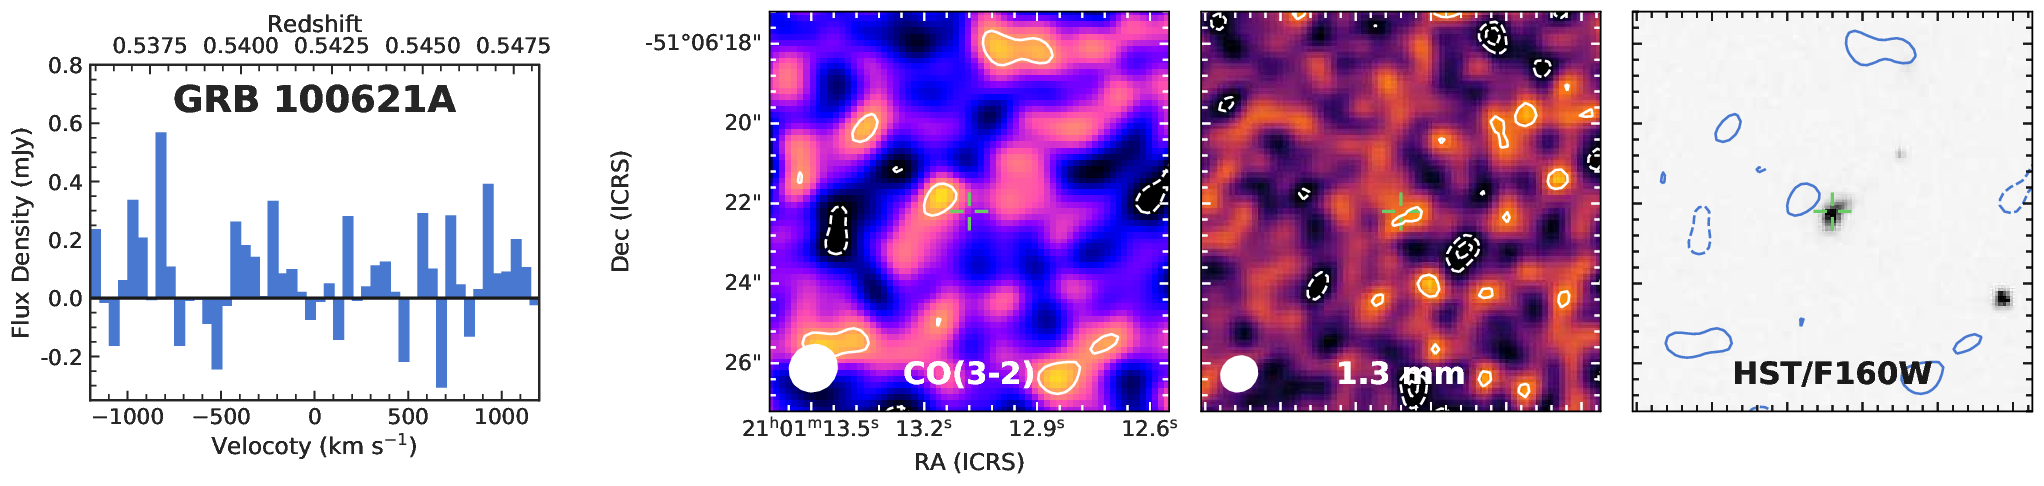
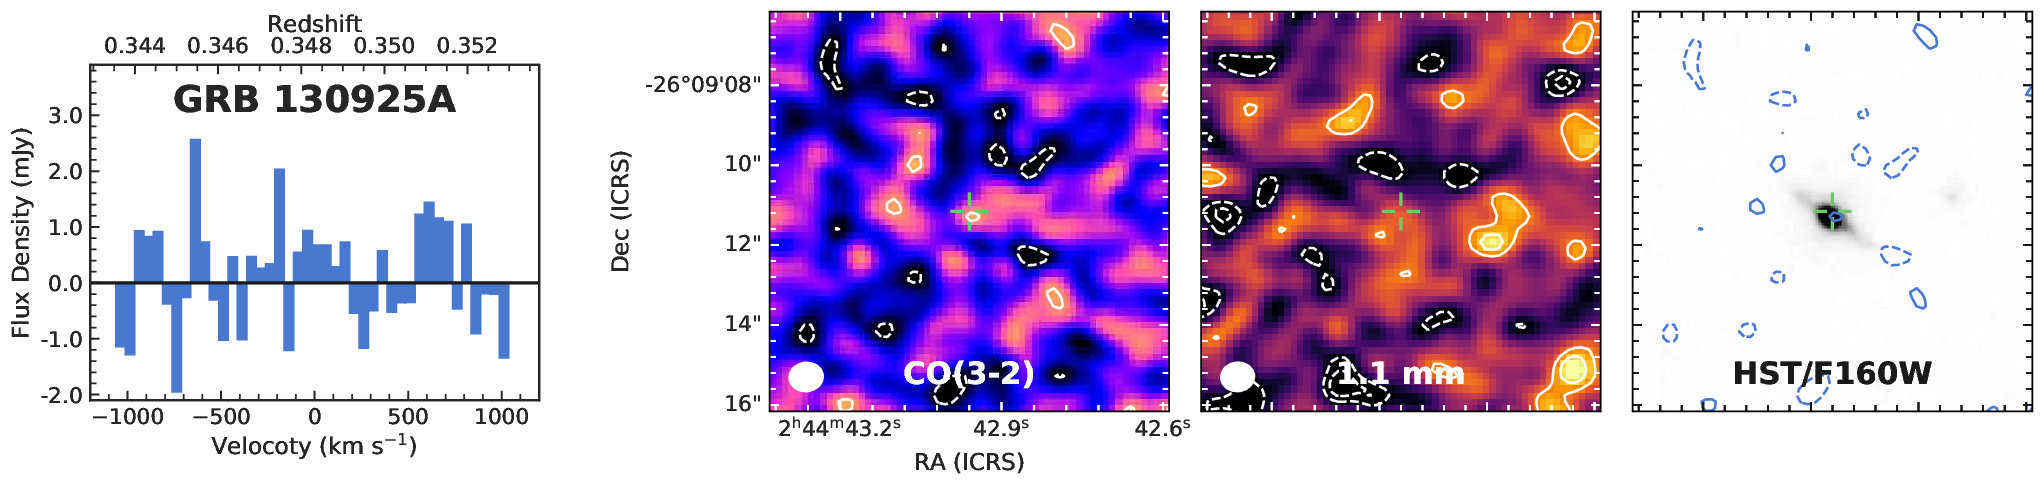
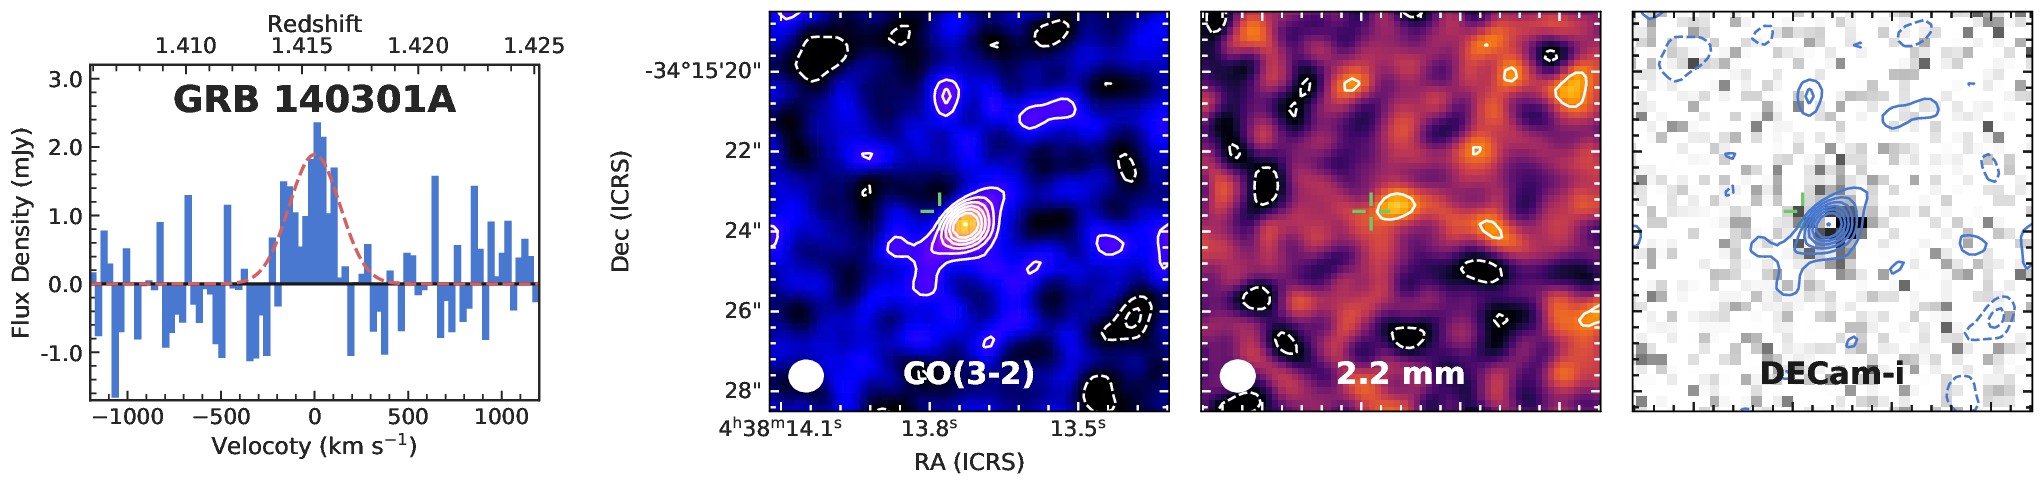
We detected CO emission in eight hosts at –2 (GRBs 050826, 051006, 051117B, 060814, 070306, 081109, 110918A, and 140301A). Because six GRB hosts were detected in CO emission so far, this study more than doubled the sample size of hosts with CO detection. The CO(3–2) and (4–3) line luminosities of the detected hosts were (3–2) – (K km s-1 pc2) and (4–3) – (K km s-1 pc2), respectively. The CO spectra, velocity-integrated CO maps, and continuum maps are shown in Figure 2 along with optical images taken from the Hubble Legacy Archive22 2 https://hla.stsci.edu/ and the public data of the Dark Energy Survey (Abbott et al. 2018; Morganson et al. 2018; Flaugher et al. 2015, DES;). Dust continuum emission is detected in only three hosts (GRB 051006, 051117B, and 110918A), whereas the upper limits for the nondetections were consistent with those expected from their SFRs (see Section IV.4).
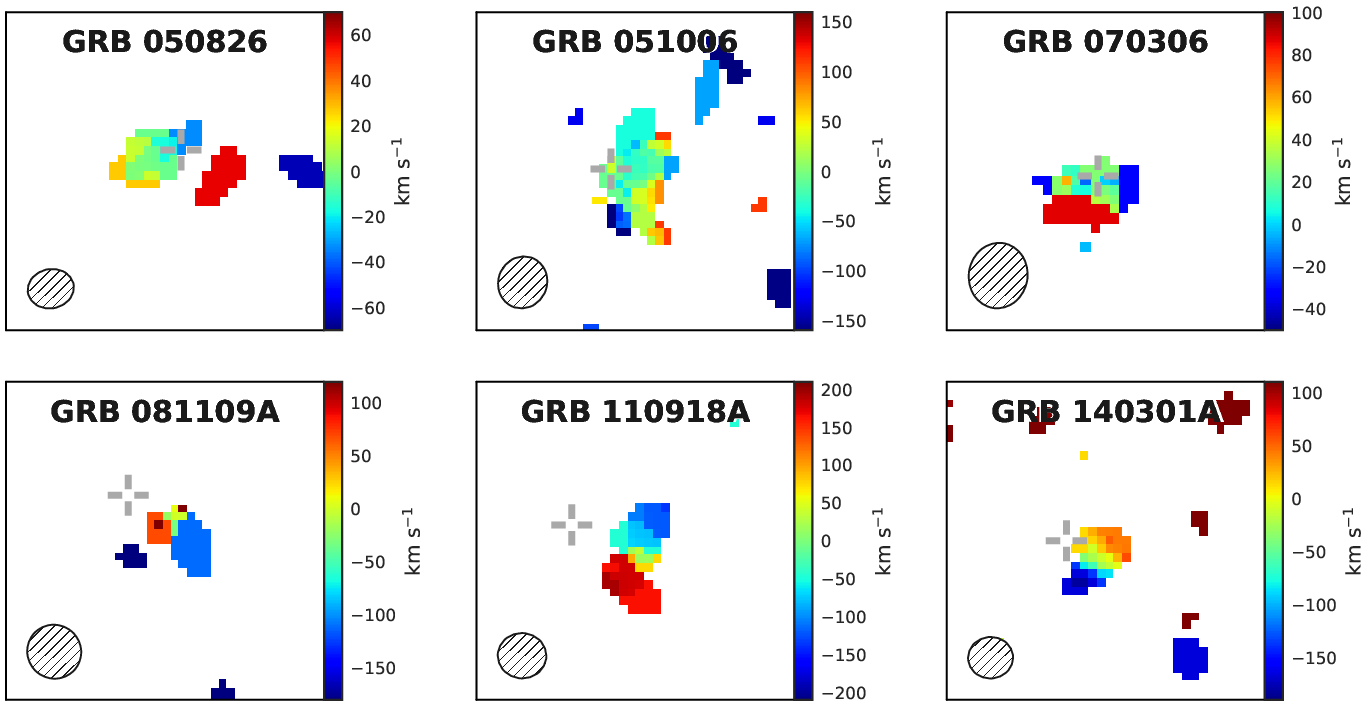
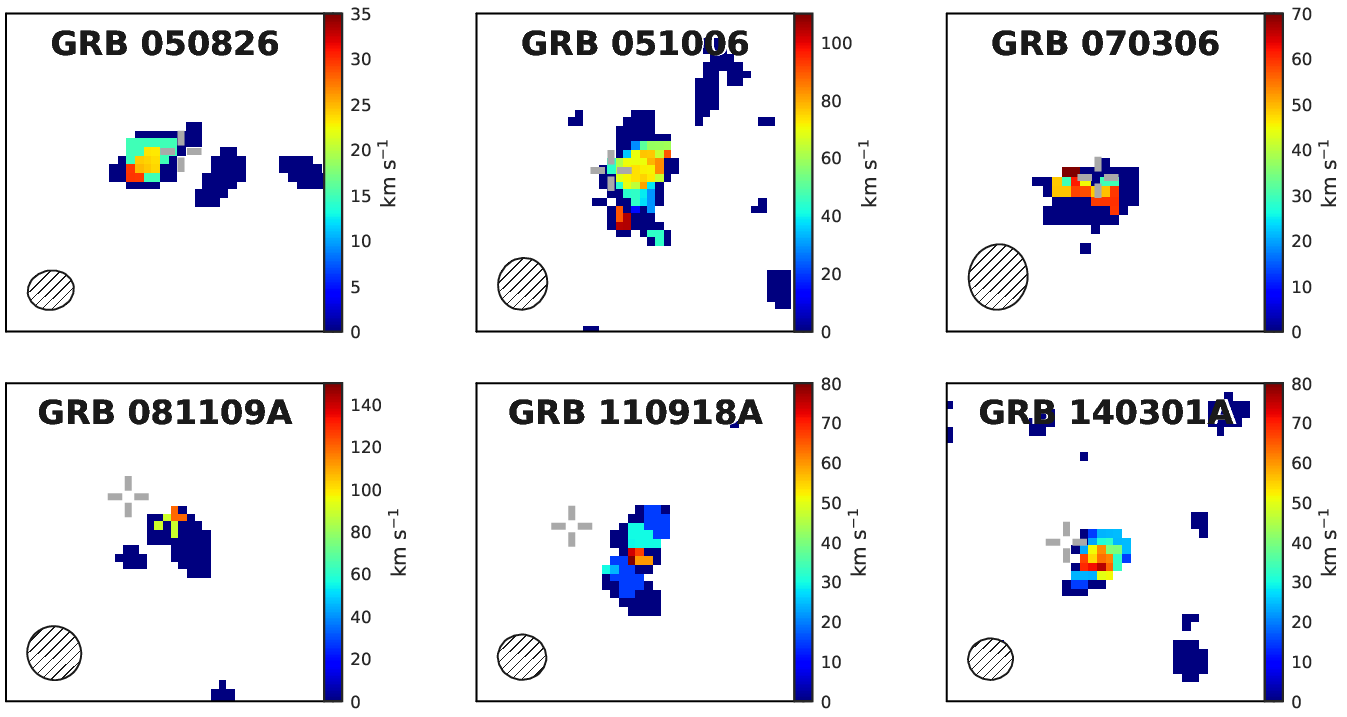
The CO line widths of the hosts ranged from 60 to 300 km s-1. We show the intensity-weighted velocity field maps and velocity dispersion maps for the CO-detected hosts with high significance (S/N 5.5) in Figures 3 and 4, respectively. Two GRB hosts (GRBs 110918A and 140301A) show velocity gradient consistent with rotation with a line full width at half maximum (FWHM) of 200–300 km s-1, whereas other hosts show a more disturbed velocity field.



III SED Fit
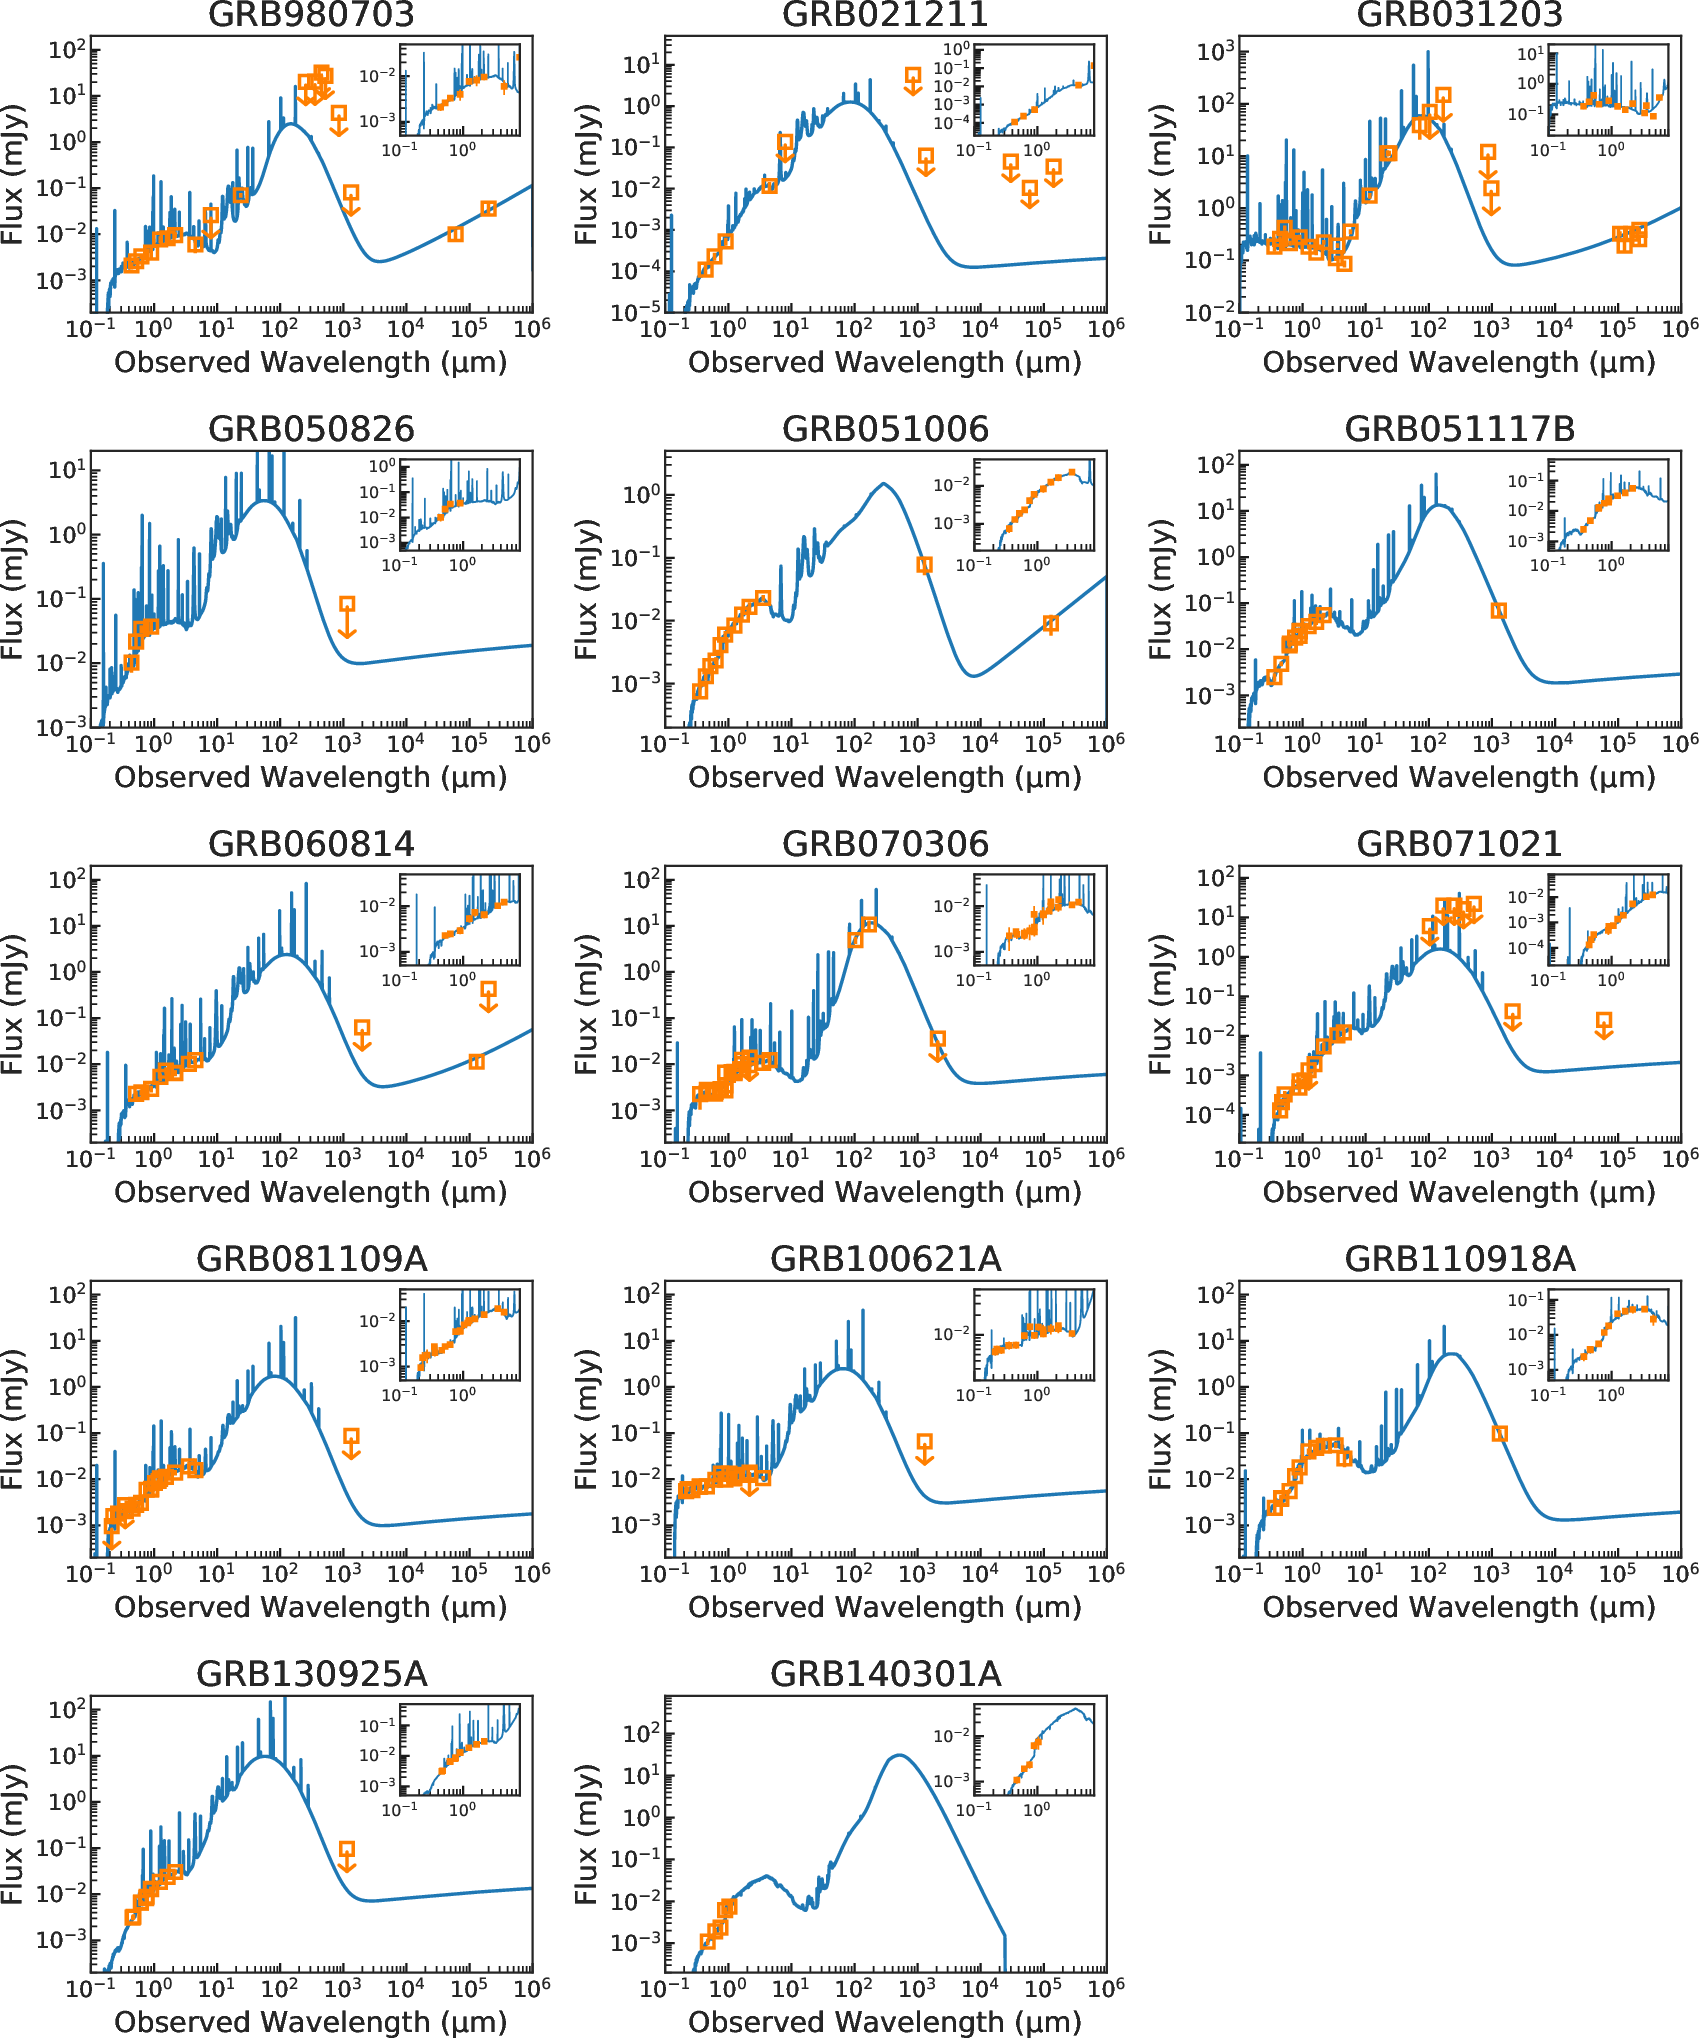
In order to estimate the SFR and stellar mass of the targets in a common way, we conduct SED analysis with available photometry from UV to radio including our ALMA photometry. We adopt a SED modeling code of Code Investigating GALaxy Emission (Burgarella et al. 2005; Noll et al. 2009; Boquien et al. 2019, CIGALE33 3 https://cigale.lam.fr/;). CIGALE is based on an energy balance principle, where the energy absorbed by dust in the UV–near-IR range is re-emitted self-consistently in the mid- and far-IR range. CIGALE builds spectral models by computing star formation histories (SFH), stellar spectrum from the SFH and single stellar population (SSP) models, nebular emission, attenuation of the stellar and nebular emission assuming an attenuation law, and dust emission in the mid- and far-IR. The models are fitted to the data and physical properties are estimated through the analysis of the likelihood distribution.
We adopt a SFH of the delayed SFH with an optional exponential burst (sfhdelayed) with a form of SFR , where is the time at which the SFR peaks. The SSP library of Bruzual, & Charlot 2003 (bc03) and the Chabrier 2003 IMF are adopted for computing the spectrum of composite stellar populations. The nebular emission is modeled based on Inoue 2011, where CLOUDY (Ferland et al. 1998; Ferland et al. 2013) is used. The attenuation by dust is calculated with the attenuation law of dustatt_modified_starburst, which is based on the Calzetti et al. 2000 starburst attenuation curve. The dust emission is computed with the module of dl2014, which is based on the model of Draine, & Li 2007 and Draine et al. 2014. The synchrotron radio emission is calculated for the GRB hosts with radio detection (GRBs 980703, 031203, 051006, and 060814) with the radio module, which relies on the radio-IR correlation of Helou et al. 1985.
The photometry data of our targets are taken from the GHostS database (www.grbhosts.org and references therein), Perley et al. 2016, and Perley et al. 2017a. The data for the GRB 140301A host is taken from the database of the Dark Energy Survey. We also use the photometry and upper limits obtained in our ALMA observations.
The results on SFR and stellar mass are presented in Table 3 and the SEDs are shown in Figure 5. The stellar masses are overall consistent with previous studies presented in Table 1. We adopt the SFRs and stellar masses for the GRB hosts derived in this study in subsequent discussions.
| GRB | SFR | |
|---|---|---|
| ( yr-1) | () | |
| 980703 | ||
| 021211 | ||
| 031203 | ||
| 050826 | ||
| 051006 | ||
| 051117B | ||
| 060814 | ||
| 070306 | ||
| 071021 | ||
| 081109A | ||
| 100621A | ||
| 110918A | ||
| 130925A | ||
| 140301A |
IV Properties of the GRB Host Galaxies
We derived molecular gas mass from the CO emission, dust mass, and far-infrared (FIR)-based SFR from the continuum emission.
| GRB | a | b | c | S/Nd | e | f | g | h | i |
|---|---|---|---|---|---|---|---|---|---|
| (km s-1) | (Jy km s-1) | (K km s-1 pc2) | () | (K km s-1 pc2)-1 | (Gyr) | ||||
| 980703 | – | – | 0.13 | – | 12 | 1.4 | 0.76 | ||
| 021211 | – | – | 0.08 | – | 9.6 | 2.0 | 0.66 | ||
| 031203 | – | – | 3.0 | – | 14 | 11 | 1.2 | ||
| 050826 | 0.296 | 6.5 | 6.2 | ||||||
| 051006 | 1.057 | 10 | 5.5 | ||||||
| 051117B | 0.480 | 3.5 | 3.9 | ||||||
| 060814 | 1.923 | 5.2 | 14 | ||||||
| 070306 | 1.496 | 5.7 | 11 | ||||||
| 071021 | – | – | 0.07 | – | 15 | 0.52 | 1.2 | ||
| 081109A | 0.979 | 5.8 | 5.8 | ||||||
| 100621A | – | – | 0.08 | – | 8.3 | 1.9 | 0.20 | ||
| 110918A | 0.983 | 6.9 | 4.4 | ||||||
| 130925A | – | – | 0.11 | – | 6.0 | 0.48 | 0.20 | ||
| 140301A | 1.416 | 9.1 | 4.7 |
Note. — Limits are 3. a Redshift derived from the CO line. b CO line width (FWHM). c Velocity-integrated CO flux. Assuming a velocity width of 180 km s-1 for non detection. d Peak signal-to-noise ratio in the velocity-integrated map. e Line luminosity of CO(3–2) or CO(4–3). f Molecular gas mass. g Metallicity-dependent CO-to-H2 conversion factor used in this study. h Molecular gas mass fraction (. i Molecular gas depletion timescale (.
IV.1 CO Line Luminosity Ratios
The CO luminosity of a ground rotational transition –0 is required for deriving the molecular gas mass by applying the conversion factor, and we need to assume a CO line ratio in the case of host galaxies with only higher CO lines. The ratios of CO line luminosities in GRB hosts have been unexplored because of the limited number of CO observations and the lack of detection of multiple CO transitions. Hatsukade et al. 2019 reported the line ratios for the GRB 080207 host with upper levels from 1 to 4. They found that the line ratios were close to unity up to , similar to those of local starburst M 82, local (U)LIRGs, and QSOs/radio galaxies, suggesting a high molecular gas excitation condition in the host.
Among the samples in this study, the hosts of GRB 031203 and GRB 060814 were observed in other CO transitions in previous studies. Michałowski et al. 2018a reported upper limits on the CO(2–1) line in the hosts of GRBs 031203 and 060814. We detected the CO(3–2) line in the GRB 060814 host, allowing us to constrain the line ratio. The obtained lower limit for the line luminosity ratio was CO(3–2)/CO(2–1) (3). This is consistent with the line ratio for the GRB 080207 host, although the constraint was weak. Because the CO line ratio for GRB hosts was obtained only in the GRB 080207 host, in this study we adopted the line ratios of CO(3–2)/CO(1–0) and CO(4–3)/CO(1–0) , which are the intermediate values between Milky Way and M 82 (Carilli & Walter 2013) and appropriate for –2 MS galaxies (Dannerbauer et al. 2009; Aravena et al. 2014; Daddi et al. 2015). We note that the derived molecular gas mass could vary by a factor of a few due to the uncertainty of CO line ratios.
IV.2 Molecular Gas Mass
The CO luminosity was calculated as follows (Solomon & Vanden Bout 2005)
| (1) |
where is in K km s-1 pc2, is the velocity-integrated intensity in Jy km s-1, is the observed line frequency in GHz, and is the luminosity distance in Mpc. The molecular gas mass is derived from
| (2) |
where is the CO-to-H2 conversion factor, including the contribution of helium mass. is calculated from the observed or devided by or (Section IV.1). The conversion factor is thought to be dependent on gas-phase metallicity, increasing with decreasing metallicity (Wilson 1995; Arimoto et al. 1996; Kennicutt, & Evans 2012; Bolatto et al. 2013, e.g.,). We adopted the relation between metallicity and of Genzel et al. 2015, where they took the geometric mean of the empirical relations of Genzel et al. 2012 and Bolatto et al. 2013 and derived a relation for the local and high-redshift sample. To apply the relation, we converted the metallicity to the calibration of Pettini & Pagel 2004 by using the metallicity conversion of Kewley, & Ellison 2008. We derived metallicity from the mass–metallicity conversion of Genzel et al. 2015 for the hosts where metallicity was not obtained from emission line diagnostics. The adopted metallicity-dependent conversion factor is 4–15 (K km s-1 pc2)-1 (Table 4). Because the approach of Genzel et al. 2015 is not applicable for significantly sub-solar metallicity galaxies (), where the relations of Genzel et al. 2012 and Bolatto et al. 2013 deviate from each other, we adopted the harmonic mean of the two relations by following Tacconi et al. 2018. If we had adopted a Galactic conversion factor of (K km s-1 pc2)-1 (Bolatto et al. 2013) regardless of metallicity, which is appropriate for –2 normal star-forming galaxies (Daddi et al. 2010; Tacconi et al. 2013), derived molecular gas mass would be smaller at most by a factor of 3 for hosts with a larger . Note that although (K km s-1 pc2)-1 is derived for ultra-luminous IR galaxies (ULIRGs) (galaxies with ) (Downes & Solomon 1998), our targets are not categorized as ULIRGs (Section IV.4).
For non-detection hosts, we derived 3 upper limits by assuming a line width of 180 km s-1, which is a median value for star-forming galaxies derived from CO observations (Tacconi et al. 2013) and is also comparable to the mean velocity width (200 km s-1) of the CO-detected GRB hosts in this study.
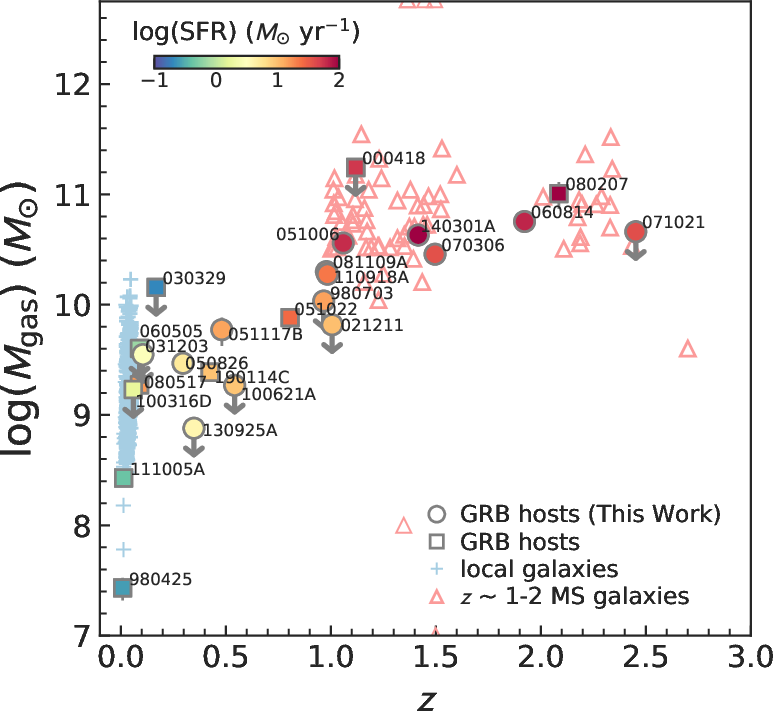
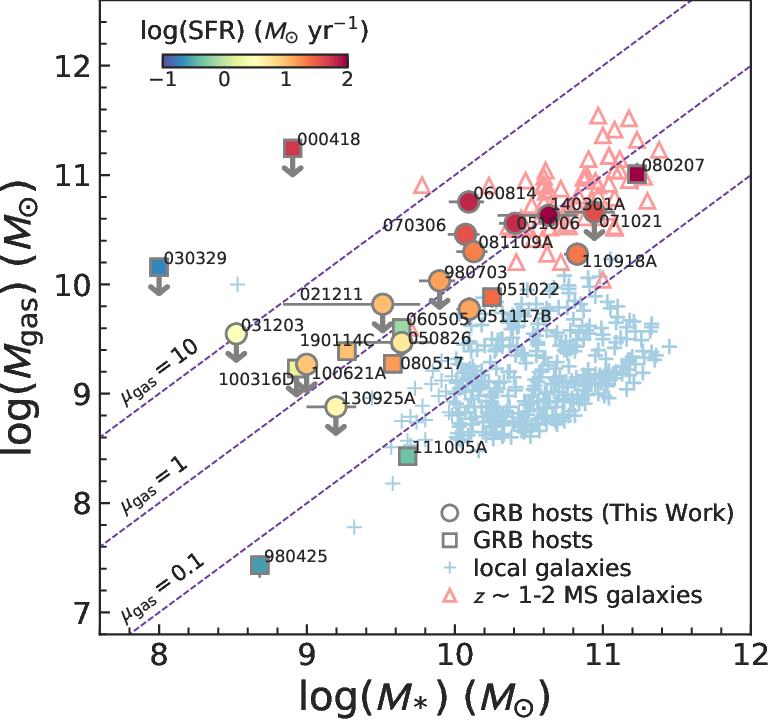
The derived molecular gas mass is (0.2– (Table 4), which is comparable to that of GRB hosts at similar redshifts reported in the literature (Hatsukade et al. 2014; Stanway et al. 2015b; Michałowski et al. 2018a; Arabsalmani et al. 2018; Hatsukade et al. 2019; de Ugarte Postigo et al. 2020). Figures 6 and 7 show the molecular gas mass as a function of redshift and stellar mass, respectively. We show the CO-detected GRB hosts in our sample and in the literature (Table 6), –2 MS galaxies (Daddi et al. 2010; Magnelli et al. 2012; Magdis et al. 2012; Tacconi et al. 2013), and local star-forming galaxies in Bothwell et al. 2014 (ALLSMOG sample at ) and Saintonge et al. 2017 (xCOLD GASS sample at ). Most of the CO-detected GRB hosts at show molecular gas fraction () comparable to those of –2 MS galaxies in Figure 7. On the other hand, some of the hosts with at lower redshifts have a higher gas fraction compared to local galaxies of similar stellar mass, which could indicate some excess of molecular gas.
IV.3 Dust Mass, FIR Luminosity, and SFR
The FIR luminosity and dust mass were derived as (De Breuck et al. 2003)
| (3) | |||
| (4) |
where is the dust mass absorption coefficient, is the rest-frame frequency, is the dust temperature, is the Planck function, and is the observed flux density. We assumed that the absorption coefficient varies as and that the emissivity index lies between 1 and 2 (Hildebrand 1983, e.g.,), and adopt m2 kg-1 (Dunne et al. 2003) and . SFRs were derived from SFR (Kennicutt 1998) and scaled to Chabrier 2003 IMF. Dust temperatures for GRB hosts have not been well constrained. Michałowski et al. 2008 studied four submillimeter-detected GRB hosts and derived the dust temperature of –51 K, with the average value of 47.5 K. Hunt et al. 2014 derived the dust temperature of 17 GRB hosts (including the hosts of GRBs 980703 and 070306) with Herschel observations by fitting their SEDs and the dust temperature ranged from 21 to 132 K, with an average temperature of 48 K. Hatsukade et al. 2019 and Hashimoto et al. 2019 estimated the dust temperature of 37–40 K for the GRB 080207 host. In this study, we adopted K and derived physical quantities (3 limits for nondetections). Note that dust temperature could increase with redshift, as has been found for star-forming galaxies (Magdis et al. 2012; Magnelli et al. 2013; Béthermin et al. 2015; Schreiber et al. 2018, e.g.,). If we adopt or 50 K, the dust mass would change by a factor of 1.5 and 0.8, and SFR would change by a factor of 0.3 and 2.6. The dust mass and SFR for continuum-detected hosts are and 10–80 yr-1, respectively. The derived quantities are presented in Table 5. No GRB hosts were found to be in the class of ULIRGs ( ).
The molecular gas-to-dust mass ratios for the GRB hosts with both CO and continuum detections are , , and for the hosts of GRBs 051006, 051117B, and 110918A, respectively. We also obtained lower limits for the hosts with CO detection only is –1000. It is shown that gas-to-dust ratio increase with decreasing metallicity for local and –3 star-forming galaxies (Leroy et al. 2011; Magdis et al. 2012; Saintonge et al. 2013; Rémy-Ruyer et al. 2014, e.g.,). It is also suggested that gas-to-dust ratios for –3 star-forming galaxies are higher than those of local galaxies (Saintonge et al. 2013; Seko et al. 2014). The gas-to-dust ratios obtained for MS galaxies are –1500 (Seko et al. 2016a; Seko et al. 2016b). By considering the dependence of gas-to-dust ratio on metallicity or redshift, the ratios for the GRB hosts are comparable to other star-forming galaxies.
| GRB | a | b | c | c | SFRc | d |
|---|---|---|---|---|---|---|
| (mm) | (Jy) | () | () | ( yr-1) | ||
| 980703 | 1.3 | 81 | 25 | – | ||
| 021211 | 1.4 | 63 | 21 | – | ||
| 031203 | 1.0 | 2410 | 19 | – | ||
| 050826 | 1.2 | 84 | 5.7 | 720 | ||
| 051006 | 1.3 | |||||
| 051117B | 1.3 | |||||
| 060814 | 2.0 | 63 | 74 | 1070 | ||
| 070306 | 2.1 | 36 | 68 | 600 | ||
| 071021 | 2.1 | 42 | 76 | – | ||
| 081109A | 1.3 | 87 | 28 | 1000 | ||
| 100621A | 1.3 | 66 | 16 | – | ||
| 110918A | 1.3 | |||||
| 130925A | 1.1 | 96 | 9.2 | – | ||
| 140301A | 2.2 | 39 | 66 | 920 |
Note. — Limits are 3. a Representative observed wavelength for continuum. b Continuum flux. c Dust mass, FIR luminosity, and SFR derived from the continuum flux by assuming K. d Molecular gas mass to dust mass ratio.
IV.4 Individual Hosts
IV.4.1 GRB 980703
The GRB 980703 host is an actively star-forming galaxy with a UV-based SFR derived from SED fitting of 10–40 yr-1 (Castro Cerón et al. 2010; Svensson et al. 2010; Perley et al. 2013). The host was detected in radio observations at 1.43, 4.86, and 8.46 GHz, and the radio-based SFR is yr-1 (Berger et al. 2001; Berger et al. 2003). Recent radio follow-up observations (14 years after the GRB) detected the host with fainter flux densities than those reporeted by Berger et al. 2001; Berger et al. 2003, providing updated radio-based SFRs of and yr-1 at 6 and 1.45 GHz, respectively (Perley et al. 2017a). They suggested an afterglow contribution to the radio fluxes in the previous studies based on long-term radio observations and light curve modeling.
The CO(4–3) line and continuum were not detected, although a marginal feature of CO emission can be seen. The upper limit on based on the continuum emission is , suggesting that the host does not have a ULIRG nature. The upper limit on SFR is 25 yr-1, which is lower than the results of early radio observations by Berger et al. 2003. Although the UV-to-radio SED fitting by Michałowski et al. 2008 and Hunt et al. 2014 showed a large SFR of 90–130 yr-1, this could be overestimated because they adopted the radio flux densities of Berger et al. 2003, and the estimated 1.3 mm flux density was larger than our ALMA upper limit on continuum emission.
IV.4.2 GRB 021211
The UV-based SFR from the SED fitting of the GRB 021211 host showed an SFR of 0.4–8 yr-1 (Savaglio et al. 2009; Castro Cerón et al. 2010; Svensson et al. 2010; Perley et al. 2013). Michałowski et al. 2012 detected 1.43 GHz radio emission from the host with VLA. The radio-based SFR is 500 yr-1, placing it in the category of ULIRGs. However, the Australia Telescope Compact Array (ATCA) 2 GHz observations by Hatsukade et al. 2012 did not detect emission, and the authors placed an upper limit on SFR yr-1. Re-observations with VLA by Perley et al. 2017a also failed to detect emission at 1.4 and 2.1 GHz. They re-analyzed the original data taken by Michałowski et al. 2012 and found that no source is detected at the afterglow position, concluding that the previously reported detection was likely a processing artifact.
Our ALMA observations did not detect the CO(4–3) line and continuum emission. The derived upper limits on IR luminosity and SFR ( and SFR yr-1) are consistent with the radio non-detection (Hatsukade et al. 2012; Perley et al. 2017a).
IV.4.3 GRB 031203
GRB 031203 at is one of the closest long-duration GRBs, allowing us to study the environment of a GRB in detail. The host is a dwarf galaxy with a stellar mass of (Guseva et al. 2011; Perley et al. 2013). The UV-based SFR from SED fitting is 0.3–14 yr-1 (Castro Cerón et al. 2010; Svensson et al. 2010; Perley et al. 2013), and the H-based SFR is 3–16 yr-1 (Prochaska et al. 2004; Margutti et al. 2007; Savaglio et al. 2009; Levesque et al. 2010a; Guseva et al. 2011). Herschel/PACS observations by Symeonidis et al. 2014 tentatively detected the host at 70 m () and derived , , and SFR yr-1 from the IR SED. Radio observations with ATCA detected the host at 1.39, 2.37, and 5.5 GHz (Stanway et al. 2010; Michałowski et al. 2010) and a radio-based SFR of 2–3 yr-1 was derived, which is consistent with previous studies.
Our ALMA observations did not detect the CO(3–2) line and continuum emission. The upper limit on molecular gas mass is , which is consistent with the upper limit of reported by Michałowski et al. 2018a derived from the CO(2–1) line observations. Wiersema et al. 2018 derived an H2 gas mass (including He and heavy elements) of based on the tentative detection of the rotation-vibrational H2 0–0 S(7) line. They assumed that the column density of H2 molecules is distributed as a power-law function with respect to temperature, with an upper temperature of 2000 K, a lower temperature of 50 K, and a power-law index of . The derived H2 mass is consistent with our upper limit.
The dust continuum emission was not detected, placing upper limits of , , and SFR yr-1, which are consistent with the results of previous studies.
IV.4.4 GRB 050826
The GRB 050826 host has an SFR of 1–2 yr-1 derived from UV-SED and H emission (Svensson et al. 2010; Levesque et al. 2010a).
The CO(3–2) line was significantly detected and the derived molecular gas mass is . The velocity-integrated intensity map shows a possible companion (S/N ) west of the host with a velocity offset of 100 km s-1. The two components appeared to be connected with weak CO emission, which might indicate an interaction.
The dust continuum was not detected, placing upper limits of , , and SFR yr-1. The SFR upper limit is consistent with previous studies.
IV.4.5 GRB 051006
Because of the limited early optical observations, it is not known whether GRB 051006 is a dark GRB or not (Perley et al. 2015). The host was detected in VLA 3 GHz observations and the radio-based SFR is yr-1 (Perley et al. 2015). The SED fitting also shows a high SFR of yr-1 (Perley et al. 2015).
The CO(4–3) line was significantly detected, and the derived molecular gas mass is ( . The dust continuum was detected with S/N and the estimated SFR is yr-1. The FIR-based SFR is lower than the results of our SED analysis or Perley et al. 2015. This might be because the dust temperature is higher than that we assumed (40 K).
IV.4.6 GRB 051117B
The GRB 051117B host is known to be one of the highest-metallicity GRB hosts, with a super-solar metallicity with (Krühler et al. 2015), which was derived with and diagnostics based on the calibrators of Nagao et al. 2006 and Maiolino et al. 2008. The UV-based SFR derived from SED fitting is 3.4 yr-1 (Krühler & Schady 2017) and the H-based SFR is yr-1 (Krühler et al. 2015). The radio observations at 3, 5.5, and 9 GHz did not detect emission (Michałowski et al. 2012; Perley et al. 2015), giving an upper limit of SFR yr-1 (Michałowski et al. 2012).
The CO(3–2) line was detected and the molecular gas mass is ( . The dust continuum was detected (S/N ). The estimated SFR is yr-1, which is consistent with the H-derived SFR and the upper limits obtained in the radio observations.
IV.4.7 GRB 060814
GRB 060814 is a dark GRB (Krühler et al. 2012). The host complex consists of components A and B (spectroscopic redshifts of and 1.920, respectively) with a separation of and the GRB occurs at component A (Jakobsson et al. 2012; Krühler et al. 2012). The host shows active star formation, with SFR of 50 yr-1 (Krühler et al. 2015; Palmerio et al. 2019) derived from H line, 210–240 yr-1 derived from SED modeling (Perley et al. 2013; Perley et al. 2015), and 260 yr-1 derived from 3 GHz radio observations (Perley et al. 2015).
We detected the CO(3–2) line at , which is consistent with the redshift of the component A. The molecular gas mass is , which is one of the most massive GRB hosts (Hatsukade et al. 2019). In spite of the large SFR, the dust continuum was not detected in our observations, giving an upper limit of SFR yr-1.
IV.4.8 GRB 070306
The afterglow of GRB 070306 is highly extinguished, with a visual extinction of mag, and the GRB is classified as a dark burst (Jaunsen et al. 2008). SED modeling of the host by Perley et al. 2013 showed a relatively blue SED with a low mean extinction (), suggesting a complex dust geometry in the host. The UV-based SFR derived from SED fitting is 10–20 yr-1 (Krühler et al. 2011; Perley et al. 2013; Perley et al. 2015), whereas the SFR derived from the IR SED with Herschel/PACS photometry is 100–140 yr-1 (Hunt et al. 2014; Schady et al. 2014). The SFR derived from 3 GHz radio observations is yr-1 (Perley et al. 2015), which is consistent with the IR SFR and higher than the UV-based SFR, suggesting dust obscured star formation in the host.
We detected the CO(3–2) line and derived a molecular gas mass of . The dust continuum was not detected, providing an upper limit of SFR yr-1.
IV.4.9 GRB 071021
GRB 071021 is a dark GRB (Krühler et al. 2012). The host at exhibits the highest redshift in our sample. The host is an actively star-forming galaxy with SFR yr-1 derived from H line (Krühler et al. 2015) and yr-1 derived from SED modeling (Perley et al. 2013).
In spite of the large SFR, neither the CO(4–3) line nor the dust continuum emission were detected. Note that the bright continuum source southeast of the GRB is an unrelated object. The derived upper limits are and SFR yr-1.
IV.4.10 GRB 081109A
GRB 081109A is a dark GRB, and the afterglow spectrum shows a high visual extinction (Krühler et al. 2011, mag;). The host galaxy shows active star-forming properties, with SFR –50 yr-1 based on the SED modeling and emission lines of H and [OII] (Krühler et al. 2011; Perley et al. 2013; Krühler et al. 2015).
We detected the CO(4–3) line and obtained a molecular gas mass of . The CO velocity field shows a rotation feature in the southwest-northeast direction. The dust continuum was not detected, and the derived upper limit is SFR yr-1.
IV.4.11 GRB 100621A
GRB 100621A is another dark GRB, and the afterglow shows high visual extinction (Krühler et al. 2011, mag;). However, the host shows blue SED (Krühler et al. 2011). The red afterglow and blue host suggest a complex dust geometry in the host, as in the case of GRB 070306 (Krühler et al. 2011; Perley et al. 2013). The SFR based on SED modeling or the H line is 10 yr-1 (Krühler et al. 2011; Krühler et al. 2015; Japelj et al. 2016). Although Stanway et al. 2014 reported radio detection at 5.5 and 9.0 GHz 0.8 year after the explosion and a derived SFR of 60 yr-1, the follow-up observations at 2.1 GHz by Greiner et al. 2016 2.7 years after the explosion did not confirm the detection. The obtained upper limit is SFR yr-1. In combination with earlier radio flux measurements of the afterglow, Greiner et al. 2016 suggested that the radio emission reported in Stanway et al. 2014 was due to the afterglow.
The host was not detected in either the CO(3–2) line or the dust continuum in our observations. The upper limits are and SFR yr-1.
IV.4.12 GRB 110918A
The afterglow of GRB 110918A shows low extinction ( mag), whereas the host is massive and metal-rich (Elliott et al. 2013). The host has a solar metallicity with (Krühler et al. 2015). The SFR is 20–40 yr-1 based on the H line (Elliott et al. 2013; Krühler et al. 2015) and 66 yr-1 based on SED fitting (Elliott et al. 2013). Radio 2.1 GHz observations by Greiner et al. 2016 put an upper limit of SFR yr-1.
The CO(3–2) line and dust continuum were detected at the host center, but they were not detected at the GRB position 12 kpc away from the host center (Elliott et al. 2013). The CO velocity field shows a gradient consistent with rotation. The derived molecular gas mass is . The FIR-based SFR is yr-1, which consistent with the previous results.
IV.4.13 GRB 130925A
GRB 130925A is an ultra-long GRB with a duration of prompt gamma-ray emission of ks (Bellm et al. 2014; Evans et al. 2014; Piro et al. 2014). The afterglow spectrum shows a high visual extinction (Greiner et al. 2014, mag;) that is one of the largest extinction among GRB afterglows. The host also shows a high extinction of mag based on SED fitting (Schady et al. 2015). Optical spectroscopy of the host shows two star-forming regions corresponding to the galaxy nucleus and an Hii region located 02 (6 kpc in projection) southwest of the nucleus (Schady et al. 2015). The GRB site is close to the nucleus, which has a super-solar metallicity (Schady et al. 2015; Krühler et al. 2015). The SFR in the host is 2–3 yr-1 based on the H line and SED fitting (Schady et al. 2015; Krühler et al. 2015).
Our observations did not detect either the CO(3–2) line or the dust continuum, placing upper limits of and SFR yr-1.
IV.4.14 GRB 140301A
The host has a high SFR of yr-1 based on the H line (Krühler et al. 2015). The host is one of the highest metallicity GRB hosts, with (Krühler et al. 2015).
The CO(3–2) line was significantly detected, whereas the dust continuum was only tentatively detected (S/N ). The CO velocity field shows a gradient consistent with rotation. The derived molecular gas mass is . The upper limit on SFR is yr-1, which is lower than the results of the H observations and our SED analysis. A possible cause of the difference may be the assumed dust temperature, where a larger SFR would be derived for a higher dust temperature.
V Discussion
V.1 Line Width
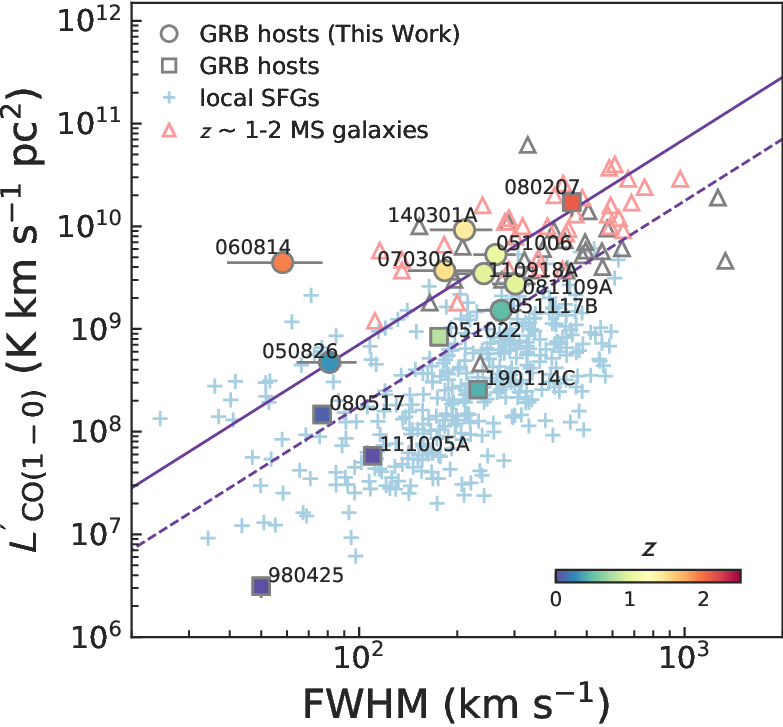
The CO line luminosity and the line FWHM are indicators of the molecular gas mass and the dynamical mass, respectively. In Figure 8 we compare and FWHM for CO-detected GRB hosts in our sample and in the literature. We also show the sample of –2 MS galaxies (Daddi et al. 2010; Magnelli et al. 2012; Magdis et al. 2012; Tacconi et al. 2013) and –0.05 star-forming galaxies (Bothwell et al. 2014; Saintonge et al. 2017). The comparison sample is limited to have the same selection criteria on SFR as the tergets (Section II.1). The GRB hosts at low redshifts share a similar region to local star-forming galaxies. The GRB hosts at –2 overlap the MS galaxies at similar redshifts except for the GRB 060814 host. It might be possible that the line width would be broader if we take the emission from to 180 km s-1 as seen in Figure 2, although the emission is not significant. Another possibility is that a small inclination angle make the line width narrower.
We presents a relation between and FWHM following Bothwell et al. 2013:
| (5) |
where is a constant that depends on the mass distribution and kinematics of the galaxy (Erb et al. 2006), is the radius of the CO-emitting region in kpc, is the gravitational constant, and is the line width in km s-1. We take for a disk galaxy following previous studies on star-forming galaxies and submillimeter galaxies (SMGs) (Bothwell et al. 2013; Aravena et al. 2016). We note that there are many possible uncertainties both from the assumed parameters and observational measurements. Nevertheless, as shown in Figure 8, the GRB hosts appear to follow the model relation, which is also applied to –2 MS galaxies, suggesting a similarity between the two populations in terms of geometry and kinematics.
V.2 Molecular Gas Mass–SFR
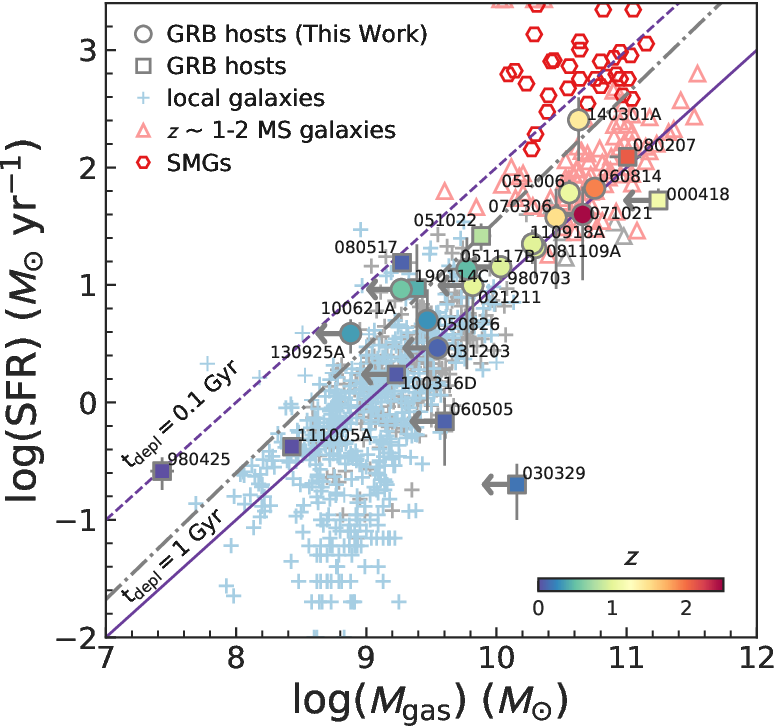
There is a correlation between gas surface density and SFR surface density known as the Kennicutt–Schmidt relation (Kennicutt 1998; Schmidt 1959). It is also known that their integrations over the galaxy show a correlation (–SFR). Figure 9 compares the molecular gas masses and SFRs of the targets. The SFRs are derived by the SED fitting (Section III). We also plot the GRB hosts with CO observations in the literature by using the same CO line ratios and metallicity-dependent conversion factors adopted for our sample. For comparison, local galaxies (Saintonge et al. 2011; Saintonge et al. 2017; Bothwell et al. 2014), –2 MS galaxies (Tacconi et al. 2013; Seko et al. 2016a), and SMGs (Bothwell et al. 2013) are also plotted. Since the location in the –SFR plot might be biased for a galaxy above the MS line, we limit the comparison sample with the same selection criteria on SFR as our targets (Section II.1).
The majority of the GRB hosts at are located in the region similar to those of –2 MS galaxies with a molecular gas depletion timescale () of 1 Gyr, while some hosts at lower redshifts have a shorter gas depletion timescale. The upper limit on molecular gas mass on the GRB 100621 and 130925A hosts places them in the sequence of starburst galaxies, where the hosts of GRBs 980425 and 080517 are also located (Stanway et al. 2015b; Michałowski et al. 2016). It is possible that these hosts are in the burst phase of star-formation with an enhanced star-formation efficiency (SFR/). Although Michałowski et al. 2018a reported that the hosts of GRBs 060814 and 100316D are deficient in molecular gas, we do not find the deficiency in Figure 9. This is because they adopted a fixed value of conversion factor (K km s-1 pc2)-1, whereas we adopt a metallicity-dependent , which is larger than 5 (K km s-1 pc2)-1 (Table 6).


V.3 Gas Fraction, Depletion Timescale, and Scaling Relation
Previous studies on GRB hosts suggest a deficiency of molecular gas in the host galaxies compared to their star formation rate (SFR) or stellar mass (Hatsukade et al. 2014; Stanway et al. 2015b; Michałowski et al. 2016). Stanway et al. 2015b claimed that the CO emission of GRB hosts to be weak compared with their SFRs, suggesting that a short gas consumption timescale is characteristic of GRB hosts. However, recent CO observations by Arabsalmani et al. 2018 and Michałowski et al. 2018a found no molecular gas deficiency, and the reported deficiency can be due to the small statistics and/or the adopted CO-to-H2 conversion factor. CO(1–0) observations of the GRB 080207 host by Hatsukade et al. 2019 support the claim that GRBs hosts can be representative star-forming galaxies.
We examine this issue with the largest sample of GRB hosts by comparing them with other star-forming galaxies. Figure 10 shows the molecular gas fraction and molecular gas depletion timescale as a function of redshift. GRB hosts in the literature are also plotted by using the same CO line ratios and metallicity-dependent adopted in this study. For comparison, the distribution of star-forming galaxies compiled by Tacconi et al. 2018 is shown as a color distribution. They selected a representative and statistically significant sample of star-forming galaxies, covering a wide range in basic galaxy parameters and SFRs relative to that on the MS, and expanded the study of Genzel et al. 2015 with a large sample of 1444 star-forming galaxies between and 4. The dashed line in Figure 10 represents the best-fitting line for MS galaxies derived by Tacconi et al. 2018. The GRB hosts tend to have a higher and a shorter as compared with other star-forming galaxies at similar redshifts, especially at , although many of the data points for the GRB hosts are upper limits. This could be a common property of GRB hosts or an effect introduced by the selection of targets which are typically above the MS line.
Genzel et al. 2015 and Tacconi et al. 2018 argue the scaling relations for and can be written as functions depending on redshift, stellar mass, and offset from the MS line, MS sSFR/sSFR(MS, ). Tacconi et al. 2018 found that their large data sets follow the same scaling trends, where scales as and scales as over a range of from to 2. The trend of the dependence on the distance from the MS line discussed in Tacconi et al. 2018 is consistent with previous studies (Saintonge et al. 2012; Magdis et al. 2012; Scoville et al. 2017, e.g.,). Figure 11 shows and of the GRB hosts as a function of MS. The GRB hosts follow the same scaling trends as other star-forming galaxies, where increases and decreases with increasing . The Pearson’s correlation coefficients estimated for the CO-detected hosts are and for the distribution of and , respectively, indicating a correlation. Tacconi et al. 2018 found a dependence on stellar mass for , and the trend of smaller for larger stellar mass also appears in the left panel of Figure 11 for the GRB hosts. This trend is presented in the plot of as a function of in Figure 12. These suggest that GRB hosts have no molecular gas deficit when compared to other star-forming galaxies of similar SFR and stellar mass.
The GRB 980425 host is significantly offset from the trend in the –MS plot. The host is known to have a low CO-derived molecular gas mass for its SFR (Michałowski et al. 2016). There are also several possible reasons due to the uncertainties on the measured properties (stellar mass and SFR) in the literature, in addition to the assumed quantities ( and line ratios) in this study.
As discussed in Section V.1, the GRB hosts share dynamical properties with other star-forming galaxies. Hatsukade et al. 2019 found that a host of GRB 080207 shares common properties such as gas-to-dust ratio, location in the Kennicutt–Schmidt relation, and kinematics, in addition to and with normal star-forming galaxies at similar redshifts. The overall trend for the GRB hosts found in this study suggests that the star-forming environment producing GRBs is similar to that of other star-forming galaxies in terms of molecular gas. These suggest that the same star-formation mechanism is expected in GRB hosts as in other star-forming galaxies.


VI Conclusions
We report the results of ALMA CO observations of 14 host galaxies of long-duration GRBs at –2.5. Eight hosts (GRBs 050826, 051006, 051117B, 060814, 070306, 081109, 110918A, and 140301A) at –2 were detected in CO [five with the CO(3–2) line and three with the CO(4–3) line], whereas only three hosts were detected in the dust continuum. Two hosts (GRBs 110918A and 140301A) show velocity gradient consistent with rotation with a line FWHM of 200–300 km s-1. Molecular gas mass is estimated to be – by assuming metallicity-dependent CO-to-H2 conversion factors and CO line ratios appropriate for normal star-forming galaxies.
To estimate the SFR and stellar mass in a common way, we conducted SED analysis with available photometry from UV to radio including our ALMA photometry.
We combined the results of CO observations with those reported in the literature (11 GRB hosts) and discuss the CO and molecular gas properties with the largest sample of GRB hosts (25 in total, of which 14 are detected in CO). The key findings are as follows:
- •
The CO-detected hosts share a similar region to local and –2 star-forming galaxies in the CO line FWHM– plot, suggesting a similarity between the two populations in terms of geometry and kinematics.
- •
The majority of the GRB hosts at are located at regions similar to those of –2 MS galaxies in the planes of – and –SFR.
- •
The GRB hosts tend to have a higher and a shorter as compared with other star-forming galaxies at similar redshifts, especially at . This could be a common property of GRB hosts or an effect introduced by the selection of targets which are typically above the MS line.
- •
In oder to eliminate the effect of selection bias toward higher-SFR hosts, we analyzed and as a function of the distance from the MS line (MS). The GRB hosts were found to follow the same scaling relations as other star-forming galaxies derived by Tacconi et al. 2018, where increases and decreases with increasing .
- •
When compared to other star-forming galaxies of similar SFR and stellar mass, no deficit of molecular gas is observed for the GRB hosts.
These findings suggest that the star-forming environment producing GRBs is similar to that of other star-forming galaxies in terms of molecular gas, especially molecular gas fraction and depletion timescale. This could indicate that the same star-formation mechanism is expected in GRB hosts as in other star-forming galaxies.
Because our targets for CO observations in this study were biased toward higher SFRs, it is important to construct an “unbiased” sample for studying the general properties of GRB hosts in future observations.
A. GRB Hosts with CO Observations in the Literature
References
- Abbott et al. (2018) Abbott, T. M. C., Abdalla, F. B., Allam, S., et al. 2018, ApJS, 239, 18
- Arabsalmani et al. (2018) Arabsalmani, M., Le Floc’h, E., Dannerbauer, H., et al. 2018, MNRAS, 476, 2332
- Arabsalmani et al. (2019) Arabsalmani, M., Roychowdhury, S., Starkenburg, T. K., et al. 2019, MNRAS, 485, 5411
- Arabsalmani et al. (2015) Arabsalmani, M., Roychowdhury, S., Zwaan, M. A., Kanekar, N., & Michałowski, M. J. 2015, MNRAS, 454, L51
- Aravena et al. (2014) Aravena, M., Hodge, J. A., Wagg, J., et al. 2014, MNRAS, 442, 558
- Aravena et al. (2016) Aravena, M., Spilker, J. S., Bethermin, M., et al. 2016, MNRAS, 457, 4406
- Arimoto et al. (1996) Arimoto, N., Sofue, Y., & Tsujimoto, T. 1996, PASJ, 48, 275
- Bellm et al. (2014) Bellm, E. C., Barrière, N. M., Bhalerao, V., et al. 2014, ApJ, 784, L19
- Berger et al. (2001) Berger, E., Kulkarni, S. R., & Frail, D. A. 2001, ApJ, 560, 652
- Berger et al. (2003) Berger, E., Cowie, L. L., Kulkarni, S. R., Frail, D. A., Aussel, H., & Barger, A. J. 2003, ApJ, 588, 99
- Béthermin et al. (2015) Béthermin, M., Daddi, E., Magdis, G., et al. 2015, A&A, 573, A113
- Bolatto et al. (2013) Bolatto, A. D., Wolfire, M., & Leroy, A. K. 2013, ARA&A, 51, 207
- Bolmer et al. (2019) Bolmer, J., Ledoux, C., Wiseman, P., et al. 2019, A&A, 623, A43
- Boquien et al. (2019) Boquien, M., Burgarella, D., Roehlly, Y., et al. 2019, A&A, 622, A103
- Bothwell et al. (2013) Bothwell, M. S., Smail, I., Chapman, S. C., et al. 2013, MNRAS, 429, 3047
- Bothwell et al. (2014) Bothwell, M. S., Wagg, J., Cicone, C., et al. 2014, MNRAS, 445, 2599
- Bruzual, & Charlot (2003) Bruzual, G., & Charlot, S. 2003, MNRAS, 344, 1000
- Burgarella et al. (2005) Burgarella, D., Buat, V., & Iglesias-Páramo, J. 2005, MNRAS, 360, 1413
- Calzetti et al. (2000) Calzetti, D., Armus, L., Bohlin, R. C., et al. 2000, ApJ, 533, 682
- Carilli & Walter (2013) Carilli, C. L., & Walter, F. 2013, ARA&A, 51, 105
- Castro Cerón et al. (2010) Castro Cerón, J. M., Michałowski, M. J., Hjorth, J., et al. 2010, ApJ, 721, 1919
- Chabrier (2003) Chabrier, G. 2003, PASP, 115, 763
- Daddi et al. (2010) Daddi, E., Bournaud, F., Walter, F., et al. 2010, ApJ, 713, 686
- Daddi et al. (2015) Daddi, E., Dannerbauer, H., Liu, D., et al. 2015, A&A, 577, A46
- Dannerbauer et al. (2009) Dannerbauer, H., Daddi, E., Riechers, D. A., et al. 2009, ApJ, 698, L178
- De Breuck et al. (2003) De Breuck, C., Neri, R., Morganti, R., et al. 2003, A&A, 401, 911
- D’Elia et al. (2014) D’Elia, V., Fynbo, J. P. U., Goldoni, P., et al. 2014, A&A, 564, A38
- de Ugarte Postigo et al. (2020) de Ugarte Postigo, A., Thöne, C. C., Martín, S., et al. 2020, A&A, 633, A68
- Djorgovski et al. (1998) Djorgovski, S. G., Kulkarni, S. R., Bloom, J. S., et al. 1998, The Astrophysical Journal, 508, L17
- Downes & Solomon (1998) Downes, D., & Solomon, P. M. 1998, ApJ, 507, 615
- Draine, & Li (2007) Draine, B. T., & Li, A. 2007, ApJ, 657, 810
- Draine et al. (2014) Draine, B. T., Aniano, G., Krause, O., et al. 2014, ApJ, 780, 172
- Dunne et al. (2003) Dunne, L., Eales, S. A., & Edmunds, M. G. 2003, MNRAS, 341, 589
- Elliott et al. (2013) Elliott, J., Krühler, T., Greiner, J., et al. 2013, A&A, 556, A23
- Endo et al. (2007) Endo, A., et al. 2007, ApJ, 659, 1431
- Erb et al. (2006) Erb, D. K., Steidel, C. C., Shapley, A. E., et al. 2006, ApJ, 646, 107
- Evans et al. (2014) Evans, P. A., Willingale, R., Osborne, J. P., et al. 2014, MNRAS, 444, 250
- Ferland et al. (1998) Ferland, G. J., Korista, K. T., Verner, D. A., et al. 1998, PASP, 110, 761
- Ferland et al. (2013) Ferland, G. J., Porter, R. L., van Hoof, P. A. M., et al. 2013, Rev. Mexicana Astron. Astrofis., 49, 137
- Flaugher et al. (2015) Flaugher, B., Diehl, H. T., Honscheid, K., et al. 2015, AJ, 150, 150
- Genzel et al. (2012) Genzel, R., Tacconi, L. J., Combes, F., et al. 2012, ApJ, 746, 69
- Genzel et al. (2015) Genzel, R., Tacconi, L. J., Lutz, D., et al. 2015, ApJ, 800, 20
- Graham, & Fruchter (2013) Graham, J. F., & Fruchter, A. S. 2013, ApJ, 774, 119
- Graham et al. (2019) Graham, J. F., Schady, P., & Fruchter, A. S. 2019, arXiv e-prints , arXiv:1904.02673.
- Greiner et al. (2016) Greiner, J., Michałowski, M. J., Klose, S., et al. 2016, A&A, 593, A17
- Greiner et al. (2014) Greiner, J., Yu, H.-F., Krühler, T., et al. 2014, A&A, 568, A75
- Guseva et al. (2011) Guseva, N. G., Izotov, Y. I., Fricke, K. J., et al. 2011, A&A, 534, A84
- Hainline et al. (2004) Hainline, L. J., Scoville, N. Z., Yun, M. S., et al. 2004, ApJ, 609, 61
- Hashimoto et al. (2019) Hashimoto, T., Hatsukade, B., Goto, T., et al. 2019, MNRAS, 488, 5029
- Hatsukade et al. (2007) Hatsukade, B., et al. 2007, PASJ, 59, 67
- Hatsukade et al. (2012) Hatsukade, B., Hashimoto, T., Ohta, K., et al. 2012, ApJ, 748, 108
- Hatsukade et al. (2011) Hatsukade, B., Kohno, K., Endo, A., Nakanishi, K., & Ohta, K. 2011, ApJ, 738, 33
- Hatsukade et al. (2014) Hatsukade, B., Ohta, K., Endo, A., et al. 2014, Nature, 510, 247
- Hatsukade et al. (2019) Hatsukade, B., Hashimoto, T., Kohno, K., et al. 2019, ApJ, 876, 91
- Helou et al. (1985) Helou, G., Soifer, B. T., & Rowan-Robinson, M. 1985, ApJ, 298, L7
- Hildebrand (1983) Hildebrand, R. H. 1983, QJRAS, 24, 267
- Hjorth et al. (2003) Hjorth, J., et al. 2003, Nature, 423, 847
- Hunt et al. (2014) Hunt, L. K., Palazzi, E., Michałowski, M. J., et al. 2014, A&A, 565, A112
- Inoue (2011) Inoue, A. K. 2011, MNRAS, 415, 2920
- Iono et al. (2009) Iono, D., Wilson, C. D., Yun, M. S., et al. 2009, ApJ, 695, 1537
- Jakobsson et al. (2004) Jakobsson, P., Hjorth, J., Fynbo, J. P. U., Watson, D., Pedersen, K., Björnsson, G., & Gorosabel, J. 2004, ApJ, 617, L21
- Jakobsson et al. (2012) Jakobsson, P., Hjorth, J., Malesani, D., et al. 2012, ApJ, 752, 62
- Jaunsen et al. (2008) Jaunsen, A. O., Rol, E., Watson, D. J., et al. 2008, ApJ, 681, 453
- Japelj et al. (2016) Japelj, J., Vergani, S. D., Salvaterra, R., et al. 2016, A&A, 590, A129
- Kennicutt (1998) Kennicutt, R. C. 1998, Annual Review of Astronomy and Astrophysics, 36, 189
- Kennicutt, & Evans (2012) Kennicutt, R. C., & Evans, N. J. 2012, Annual Review of Astronomy and Astrophysics, 50, 531
- Kewley, & Ellison (2008) Kewley, L. J., & Ellison, S. L. 2008, ApJ, 681, 1183
- Kistler et al. (2009) Kistler, M. D., Yüksel, H., Beacom, J. F., Hopkins, A. M., & Wyithe, J. S. B. 2009, ApJ, 705, L104
- Kohno et al. (2005) Kohno, K., et al. 2005, PASJ, 57, 147
- Kobulnicky & Kewley (2004) Kobulnicky, H. A., & Kewley, L. J. 2004, ApJ, 617, 240
- Kroupa (2001) Kroupa, P. 2001, MNRAS, 322, 231
- Krühler et al. (2011) Krühler, T., Greiner, J., Schady, P., et al. 2011, A&A, 534, A108
- Krühler et al. (2013) Krühler, T., Ledoux, C., Fynbo, J. P. U., et al. 2013, A&A, 557, A18
- Krühler et al. (2015) Krühler, T., Malesani, D., Fynbo, J. P. U., et al. 2015, A&A, 581, A125
- Krühler et al. (2012) Krühler, T., Malesani, D., Milvang-Jensen, B., et al. 2012, ApJ, 758, 46
- Krühler et al. (2014) Krühler, T., Tanvir, N. R., Malesani, D., et al. 2014, GRB Coordinates Network 15900, 1
- Krühler & Schady (2017) Krühler, T., & Schady, P. 2017, Figshare, https://doi.org/10.6084/m9.figshare.4776886.v2
- Langer, & Norman (2006) Langer, N., & Norman, C. A. 2006, ApJ, 638, L63
- Le Floc’h et al. (2006) Le Floc’h, E., Charmandaris, V., Forrest, W. J., Mirabel, I. F., Armus, L., & Devost, D. 2006, ApJ, 642, 636
- Leroy et al. (2011) Leroy, A. K., Bolatto, A., Gordon, K., et al. 2011, ApJ, 737, 12
- Levesque et al. (2010a) Levesque, E. M., Berger, E., Kewley, L. J., & Bagley, M. M. 2010a, AJ, 139, 694
- Levesque et al. (2011) Levesque, E. M., Berger, E., Soderberg, A. M., et al. 2011, ApJ, 739, 23
- Levesque et al. (2010b) Levesque, E. M., Kewley, L. J., Berger, E., & Zahid, H. J. 2010b, AJ, 140, 1557
- Magdis et al. (2012) Magdis, G. E., Daddi, E., Béthermin, M., et al. 2012, ApJ, 760, 6
- Magnelli et al. (2013) Magnelli, B., Popesso, P., Berta, S., et al. 2013, A&A, 553, A132
- Magnelli et al. (2012) Magnelli, B., Saintonge, A., Lutz, D., et al. 2012, A&A, 548, A22
- Maiolino et al. (2008) Maiolino, R., Nagao, T., Grazian, A., et al. 2008, A&A, 488, 463
- Margutti et al. (2007) Margutti, R., Chincarini, G., Covino, S., et al. 2007, A&A, 474, 815
- McMullin et al. (2007) McMullin, J. P., Waters, B., Schiebel, D., Young, W., & Golap, K. 2007, Astronomical Data Analysis Software and Systems XVI, 376, 127
- Michałowski et al. (2016) Michałowski, M. J., Castro Cerón, J. M., Wardlow, J. L., et al. 2016, A&A, 595, A72
- Michałowski et al. (2015) Michałowski, M. J., Gentile, G., Hjorth, J., et al. 2015, A&A, 582, A78
- Michałowski et al. (2008) Michałowski, M. J., Hjorth, J., Castro Cerón, J. M., & Watson, D. 2008, ApJ, 672, 817
- Michałowski et al. (2010) Michałowski, M. J., Hjorth, J., & Watson, D. 2010, A&A, 514, A67
- Michałowski et al. (2014) Michałowski, M. J., Hunt, L. K., Palazzi, E., et al. 2014, A&A, 562, A70
- Michałowski et al. (2012) Michałowski, M. J., Kamble, A., Hjorth, J., et al. 2012, ApJ, 755, 85
- Michałowski et al. (2018a) Michałowski, M. J., Karska, A., Rizzo, J. R., et al. 2018a, A&A, 617, A143
- Michałowski et al. (2018b) MichałowskI, M. J., Xu, D., Stevens, J., et al. 2018b, A&A, 616, A169
- Milvang-Jensen et al. (2010) Milvang-Jensen, B., Goldoni, P., Tanvir, N. R., et al. 2010, GRB Coordinates Network 10876, 1
- Mirabal et al. (2007) Mirabal, N., Halpern, J. P., & O’Brien, P. T. 2007, The Astrophysical Journal, 661, L127
- Morganson et al. (2018) Morganson, E., Gruendl, R. A., Menanteau, F., et al. 2018, PASP, 130, 074501
- Nagao et al. (2006) Nagao, T., Maiolino, R., & Marconi, A. 2006, A&A, 459, 85
- Niino et al. (2017) Niino, Y., Aoki, K., Hashimoto, T., et al. 2017, PASJ, 69, 27
- Noll et al. (2009) Noll, S., Burgarella, D., Giovannoli, E., et al. 2009, A&A, 507, 1793
- Palmerio et al. (2019) Palmerio, J. T., Vergani, S. D., Salvaterra, R., et al. 2019, A&A, 623, A26
- Perley & Perley (2013) Perley, D. A., & Perley, R. A. 2013, ApJ, 778, 172
- Perley et al. (2009) Perley, D. A., et al. 2009, AJ, 138, 1690
- Perley et al. (2017a) Perley, D. A., Hjorth, J., Tanvir, N. R., & Perley, R. A. 2017a, MNRAS, 465, 970
- Perley et al. (2017b) Perley, D. A., Krühler, T., Schady, P., et al. 2017b, MNRAS, 465, L89
- Perley et al. (2013) Perley, D. A., Levan, A. J., Tanvir, N. R., et al. 2013, ApJ, 778, 128
- Perley et al. (2015) Perley, D. A., Perley, R. A., Hjorth, J., et al. 2015, ApJ, 801, 102
- Perley et al. (2016) Perley, D. A., Tanvir, N. R., Hjorth, J., et al. 2016, ApJ, 817, 8
- Pettini & Pagel (2004) Pettini, M. & Pagel, B. E. J. 2004, MNRAS, 348, L59
- Piranomonte et al. (2015) Piranomonte, S., Japelj, J., Vergani, S. D., et al. 2015, MNRAS, 452, 3293
- Piro et al. (2014) Piro, L., Troja, E., Gendre, B., et al. 2014, ApJ, 790, L15
- Prochaska et al. (2004) Prochaska, J. X., Bloom, J. S., Chen, H.-W., et al. 2004, ApJ, 611, 200
- Prochaska et al. (2009) Prochaska, J. X., Sheffer, Y., Perley, D. A., et al. 2009, ApJ, 691, L27
- Rémy-Ruyer et al. (2014) Rémy-Ruyer, A., Madden, S. C., Galliano, F., et al. 2014, A&A, 563, A31
- Salpeter (1955) Salpeter, E. E. 1955, ApJ, 121, 161
- Salvaterra et al. (2009) Salvaterra, R., et al. 2009, Nature, 461, 1258
- Saintonge et al. (2017) Saintonge, A., Catinella, B., Tacconi, L. J., et al. 2017, ApJS, 233, 22
- Saintonge et al. (2011) Saintonge, A., Kauffmann, G., Kramer, C., et al. 2011, MNRAS, 415, 32
- Saintonge et al. (2013) Saintonge, A., Lutz, D., Genzel, R., et al. 2013, ApJ, 778, 2
- Saintonge et al. (2012) Saintonge, A., Tacconi, L. J., Fabello, S., et al. 2012, ApJ, 758, 73
- Savaglio et al. (2006) Savaglio, S., Glazebrook, K., & Le Borgne, D. 2006, Gamma-ray Bursts in the Swift Era, 540
- Savaglio et al. (2009) Savaglio, S., Glazebrook, K., & Le Borgne, D. 2009, ApJ, 691, 182
- Schady et al. (2014) Schady, P., Savaglio, S., Müller, T., et al. 2014, A&A, 570, A52
- Schady et al. (2015) Schady, P., Krühler, T., Greiner, J., et al. 2015, A&A, 579, A126
- Schmidt (1959) Schmidt, M. 1959, ApJ, 129, 243
- Schreiber et al. (2018) Schreiber, C., Elbaz, D., Pannella, M., et al. 2018, A&A, 609, A30
- Scoville et al. (2017) Scoville, N., Lee, N., Vanden Bout, P., et al. 2017, ApJ, 837, 150
- Seko et al. (2014) Seko, A., Ohta, K., Hatsukade, B., et al. 2014, PASJ, 66, 81
- Seko et al. (2016a) Seko, A., Ohta, K., Yabe, K., et al. 2016a, ApJ, 819, 82
- Seko et al. (2016b) Seko, A., Ohta, K., Yabe, K., et al. 2016b, Publications of the Astronomical Society of Japan, 68, 62
- Solomon & Vanden Bout (2005) Solomon, P. M., & Vanden Bout, P. A. 2005, ARA&A, 43, 677
- Speagle et al. (2014) Speagle, J. S., Steinhardt, C. L., Capak, P. L., & Silverman, J. D. 2014, ApJS, 214, 15
- Stanek et al. (2003) Stanek, K. Z., et al. 2003, ApJ, 591, L17
- Stanek et al. (2006) Stanek, K. Z., et al. 2006, Acta Astron., 56, 333
- Stanway et al. (2011) Stanway, E. R., Bremer, M. N., Tanvir, N. R., Levan, A. J., & Davies, L. J. M. 2011, MNRAS, 410, 1496
- Stanway et al. (2010) Stanway, E. R., Davies, L. J. M., & Levan, A. J. 2010, MNRAS, 409, L74
- Stanway et al. (2014) Stanway, E. R., Levan, A. J., & Davies, L. J. M. 2014, MNRAS, 444, 2133
- Stanway et al. (2015a) Stanway, E. R., Levan, A. J., Tanvir, N., et al. 2015a, MNRAS, 446, 3911
- Stanway et al. (2015b) Stanway, E. R., Levan, A. J., Tanvir, N. R., Wiersema, K., & van der Laan, T. P. R. 2015b, ApJ, 798, L7
- Svensson et al. (2010) Svensson, K. M., Levan, A. J., Tanvir, N. R., Fruchter, A. S., & Strolger, L.-G. 2010, MNRAS, 405, 57
- Symeonidis et al. (2014) Symeonidis, M., Oates, S. R., de Pasquale, M., et al. 2014, MNRAS, 443, L124
- Tacconi et al. (2010) Tacconi, L. J., Genzel, R., Neri, R., et al. 2010, Nature, 463, 781
- Tacconi et al. (2018) Tacconi, L. J., Genzel, R., Saintonge, A., et al. 2018, ApJ, 853, 179
- Tacconi et al. (2013) Tacconi, L. J., Neri, R., Genzel, R., et al. 2013, ApJ, 768, 74
- Tanga et al. (2018) Tanga, M., Krühler, T., Schady, P., et al. 2018, A&A, 615, A136
- Tanvir et al. (2009) Tanvir, N. R., et al. 2009, Nature, 461, 1254
- Thöne et al. (2019) Thöne, C. C., Izzo, L., Flores, H., et al. 2019, arXiv e-prints , arXiv:1904.05935
- Thöne et al. (2014) Thöne, C. C., Christensen, L., Prochaska, J. X., et al. 2014, MNRAS, 441, 2034
- Totani (1997) Totani, T. 1997, ApJ, 486, L71
- van der Horst et al. (2009) van der Horst, A. J., Kouveliotou, C., Gehrels, N., Rol, E., Wijers, R. A. M. J., Cannizzo, J. K., Racusin, J., & Burrows, D. N. 2009, ApJ, 699, 1087
- Vergani et al. (2015) Vergani, S. D., Salvaterra, R., Japelj, J., et al. 2015, A&A, 581, A102
- Vergani et al. (2017) Vergani, S. D., Palmerio, J., Salvaterra, R., et al. 2017, A&A, 599, A120
- Vreeswijk et al. (2003) Vreeswijk, P., Fruchter, A., Hjorth, J., & Kouveliotou, C. 2003, GRB Coordinates Network, 1785, 1
- Vreeswijk et al. (2013) Vreeswijk, P. M., Malesani, D., Fynbo, J. P. U., et al. 2013, GRB Coordinates Network 15249, 1
- Whitaker et al. (2014) Whitaker, K. E., Franx, M., Leja, J., et al. 2014, ApJ, 795, 104
- Wiersema et al. (2018) Wiersema, K., Togi, A., Watson, D., et al. 2018, MNRAS, 481, 1126
- Wijers et al. (1998) Wijers, R. A. M. J., Bloom, J. S., Bagla, J. S., & Natarajan, P. 1998, MNRAS, 294, L13
- Wilson (1995) Wilson, C. D. 1995, ApJ, 448, L97
- Woosley & Heger (2006) Woosley, S. E., & Heger, A. 2006, ApJ, 637, 914
- Yoon et al. (2006) Yoon, S.-C., Langer, N., & Norman, C. 2006, A&A, 460, 199
| GRB | SFR | Ref. | a | Ref. | CO | b | Ref. | c | d | ||
|---|---|---|---|---|---|---|---|---|---|---|---|
| ( yr-1) | () | (K km s-1 pc2) | () | (K km s-1 pc2)-1 | |||||||
| 980425 | 0.0085 | 1 | 8.31 | 8 | 2–1 | 16 | 8.7 | ||||
| 000418 | 1.1183 | 2 | 8.16 | 9 | 2–1 | 17 | 12.7 | ||||
| 030329 | 0.1685 | 2 | 8.00 | 10 | 1–0 | 18 | 20.8 | ||||
| 051022 | 0.806 | 2 | 8.33 | 11 | 4–3 | 19 | 7.3 | ||||
| 060505 | 0.0889 | 4.3 | 3 | 8.41 | 12 | 2–1 | 16 | 7.2 | |||
| 060814 | 1.9229 | 2 | 8.38 | 11 | 2–1 | 16 | 7.5 | ||||
| 080207 | 2.0858 | 4 | 8.50 | 11 | 1–0 | 20 | 5.9 | ||||
| 080517 | 0.089 | 5 | 8.33 | 13 | 1–0 | 21 | 12.8 | ||||
| 100316D | 0.0591 | 0.85 | 3 | 8.30 | 14 | 2–1 | 16 | 8.9 | |||
| 111005A | 0.01326 | 6 | 8.63 | 15 | 2–1 | 16 | 4.6 | ||||
| 190114C | 0.425 | 7 | 8.27 | 7 | 3–2 | 7 | 9.5 |
Note. — a Metallicity converted to the calibration of Pettini & Pagel 2004 by using the metallicity conversion of Kewley, & Ellison 2008. b CO line luminosity. c Molecular gas mass with metallicity-dependent CO-to-H2 conversion factor. d Metallicity-dependent CO-to-H2 conversion factor.
(1) Michałowski et al. 2014; (2) Perley et al. 2013; (3) Michałowski et al. 2015; (4) Hashimoto et al. 2019; (5) Stanway et al. 2015a; (6) Michałowski et al. 2018b; (7) de Ugarte Postigo et al. 2020; (8) Krühler & Schady 2017; (9) Piranomonte et al. 2015: (10) Levesque et al. 2010b; (11) Krühler et al. 2015; (12) Thöne et al. 2014; (13) Niino et al. 2017; (14) Levesque et al. 2011; (15) Tanga et al. 2018; (16) Michałowski et al. 2018a; (17) Hatsukade et al. 2011: (18) Endo et al. 2007: (19) Hatsukade et al. 2014: (20) Hatsukade et al. 2019; (21) Stanway et al. 2015b.