∎
Stellar masks and bisector’s shape for M-type stars observed in the GAPS Programme with HARPS-N at TNG Journal: Experimental AstronomyThanks: Based on observations made with the Italian Telescopio Nazionale Galileo (TNG) operated on the island of La Palma by the Fundacion Galileo Galilei of the INAF at the Spanish Observatorio Roque de los Muchachos of the IAC in the frame of the program Global Architecture of the Planetary Systems (GAPS).
Abstract
The HARPS/HARPS-N Data Reduction Software (DRS) relies on the cross-correlation between the observed spectra and a suitable stellar mask to compute a cross-correlation function (CCF) to be used both for the radial velocity (RV) computation and as an indicator of stellar lines asymmetry, induced for example by the stellar activity. Unfortunately the M2 mask currently used by the HARPS/HARPS-N DRS for M-type stars results in heavily distorted CCFs.
We created several new stellar masks in order to decrease the errors in the RVs and to improve the reliability of the activity indicators as the bisector’s span.
We obtained very good results with a stellar mask created from the theoretical line list provided by the VALD3 database for an early M-type star (Teff=3500 K and ). The CCF’s shape and relative activity indicators improved and the RV time-series allowed us to recover known exoplanets with periods and amplitudes compatible with the results obtained with HARPS-TERRA.
Keywords:
Echelle spectroscopy Cross-correlation function M-type stars Stellar activity indicators1 Introduction
Even after the advent of ESPRESSO (Pepe et al. 2010), the twin high-resolution echelle spectrographs HARPS (Mayor et al. 2003) and HARPS-N (Cosentino et al. 2012), installed at the 3.6m telescope at the ESO-LaSilla Observatory and at the Telescopio Nazionale Galileo (TNG) at the Roque de los Muchachos Observatory respectively, remain two of the most important instruments for radial velocity (RV) measurements. They are mainly used for exoplanets search and characterization, an ever evolving field that has recently focused on the M-type stars (Bonfils et al. 2013; Affer et al. 2016, e.g.). These cool stars are very interesting targets for exoplanetary studies, due to their long lives, low masses and close-in habitable zone (Delfosse et al. 2013; Bonfils et al. 2013; Tuomi et al. 2014; Dressing and Charbonneau 2015, e.g.) but they present the strong drawback of showing usually very high activity levels, which results in large quasi-periodic variations in the RV time-series (Robertson et al. 2014; Anglada-Escudé et al. 2016). As such, it is very important to have reliable stellar activity indicators when looking for planets orbiting M-type stars, in order to discriminate between the planetary Keplerian signals and the activity signals.
Both HARPS and HARPS-N data are processed by a Data Reduction Software (DRS) optimized for exoplanet search (Baranne et al. 1996; Pepe et al. 2002), that computes the RVs by cross-correlating the spectra with a suitable mask chosen from a template library. The mask consists in a list of wavelength ranges (identifying the spectral lines) and weights used to define the contribution of each single spectral line to the cross-correlation. The resulting cross-correlation function (CCF from here on) is used not only to compute the RV, but also to build some activity indicators, as the bisector’s span (an indicator of the asymmetry of the CCF, denoting the curvature of the line that bisects the CCF), the CCF contrast (i.e. the depth of the CCF at its central point) and full-width at half-maximum (FWHM) of the CCF.
Unfortunately the online pipeline running at the telescope uses a very limited mask library, consisting of only three masks, optimized for G2, K5 and M2-type stars. In the case of M-type stars using the M2 mask, i.e. the most suitable mask for those stars, gives less satisfactory results than those obtained when processing solar-like stars with the G2 mask, in terms of both the shape of the CCF and the resulting RVs, which are computed using a Gaussian fit (see Fig. 1).


The resulting CCFs deviate from a Gaussian profile and show notable bumps on the wings (see Sect. 3), while the bisector’s shape does not seem to map the stars’ velocity fields (see Sect. 4). Many studies avoid this issue by using the RVs derived by the HARPS-TERRA software (Anglada-Escudé and Butler 2012; Perger et al. 2017a), that performs a least-squares matching of each observed spectrum in a time-series to a high signal-to-noise ratio template derived from the same dataset. Still, in order to recover some activity indicators, many scientists still use the DRS bisector’s span (Anglada-Escudé et al. 2014; Wittenmyer et al. 2014), or they compute their own bisector’s span on the DRS CCF (Robertson et al. 2015; Bourrier et al. 2018).
The aim of this paper is to show how the use of different custom-made stellar masks for M-type stars gives very different results in terms of the shape of the CCFs, the RV precision and scatter, and the bisector’s shape. We will illustrate how both the RV measurements and the use of the bisector’s span as an activity indicator may be improved by using a better defined mask for early M-type stars.
2 Spectroscopic data
For our work we focused on the HARPS-N data, because we were able to re-reduce them many times with different ad-hoc masks using the YABI platform (Hunter et al. 2012) hosted at IA2 Data Center11 1 https://www.ia2.inaf.it in the mainframe of the italian GAPS (Global Architecture of Planetary Systems) program (Covino et al. 2013; Poretti et al. 2016), but we assume the same results are valid for the HARPS data, given that both the instruments and the reduction pipelines are twins. We already used this method in the past in order to use personalized stellar mask for particular targets, as in the case of the F6V star Bootis (Borsa et al. 2015), where the standard G2 mask used by the DRS under-performed due to the mis-matched stellar type.
In this work, we studied the effect of different masks on the CCF’s shape, RV determination and bisector’s shape of early M-type stars using several datasets of HARPS-N spectra. We used the time-series of the exoplanet host stars GJ 3998 (Affer et al. 2016) and GJ 625 (Suárez Mascareño et al. 2017) to create new stellar masks, and then we tested their results in term of RVs and bisector’s span against the results obtained using the standard M2 and K5 masks. We also compared the RVs those obtained using the HARPS-TERRA software on both these targets and two other additional exoplanet host stars, GJ 686 (Affer et al. 2019) and GJ 3942 (Perger et al. 2017b).
The data used in this work are:
- •
195 spectra of GJ 3998 (M1V, V=10.83 mag) observed from 26 May 2013 to 28 August 2018;
- •
164 spectra of GJ 625 (M1.5V, V=10.17 mag) observed from 25 May 2013 to 12 September 2017;
- •
64 spectra of GJ 686 (M1.5Ve, V=9.577 mag) observed from 11 February 2014 to 20 October 2017;
- •
146 spectra of GJ 3942 (M0.5Ve, V=10.25 mag) observed from 25 May 2013 to 27 February 2017.
The stars were observed as part of the HADES (HArps-n red Dwarf Exoplanet Survey) program, a collaboration between the GAPS consortium, the Institut de Ciències de l’Espai de Catalunya (ICE), and the Instituto de Astrofísica de Canarias (IAC).
3 Cross-correlation function and stellar masks: first approach

The HARPS-N CCF for the early M-type GJ 3998 star obtained using the M2 mask shows an immediate drawback: the line profile does not resemble a Gaussian (as it is expected in the case of slow-rotating stars), but it presents two bumps on the wings (see Fig. 2, upper left panel). These bumps are present in the CCFs of any M-type star that is reduced using the M2 mask, so they are not a feature of this particular object. This effect is particularly troubling considering that the HARPS-N pipeline uses a Gaussian fit of the CCF to compute the radial velocity of the star. The bumps disappear using the K5 mask (see Fig. 2, upper middle panel), but the mean RV error doubles (see Tab. 1). We note here that the rms in both the RV and the bisector’s span increases using the K5 mask.
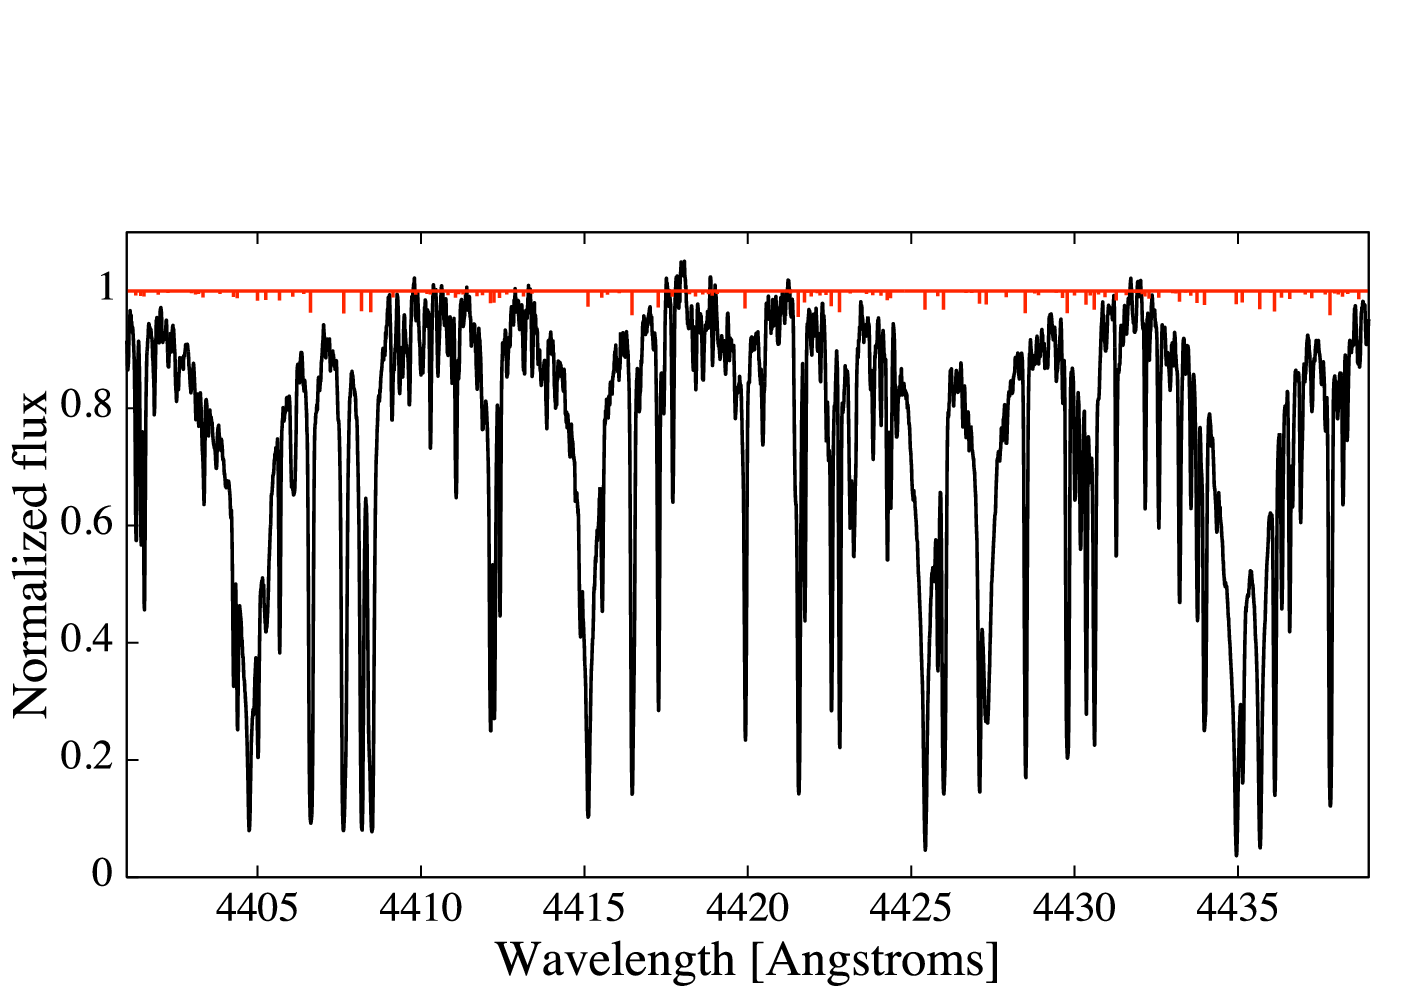
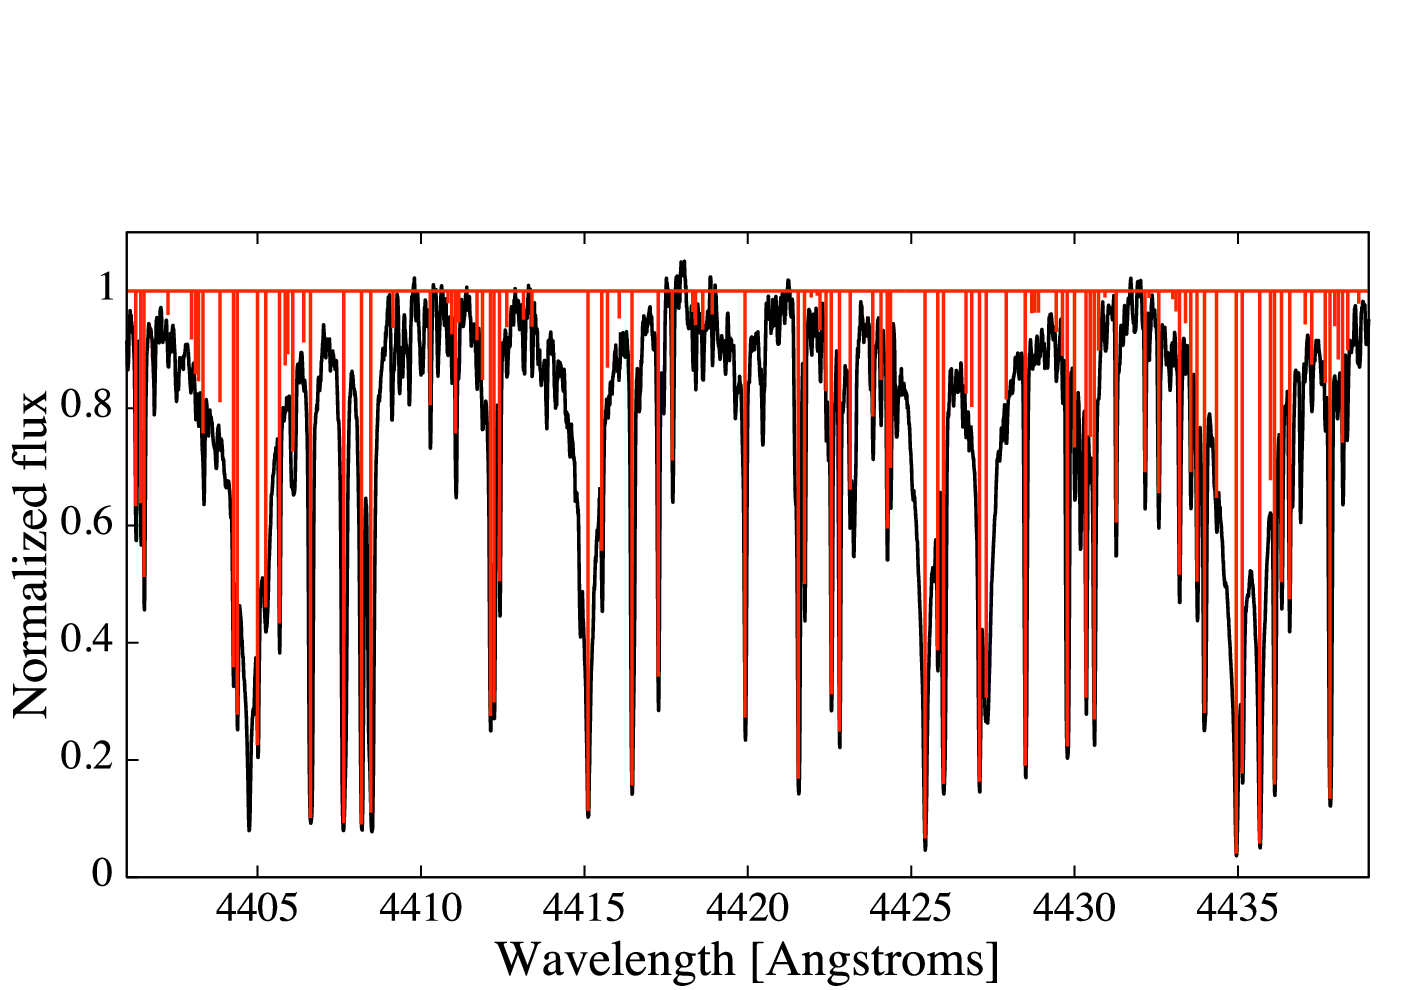
As a first approach, we looked at the M2 mask by overplotting it over an observed early M-type star (see Fig. 3, left panel). We found a first obvious issue: all the lines in the mask have mostly the same very shallow depths, which are used by the pipeline to weigh their contribution to the CCF. This means that all the 9196 lines of the mask contribute roughly in the same way to the CCF, regardless of their intensity.
We decided to modify the M2 mask by adjusting the line depths to the values of our observed spectrum and by eliminating the most shallow lines (see Fig. 3, right panel), i.e. lines with depths less than 2.5% of the continuum. This threshold value was chosen in order to get rid of lines that would only contribute to the noise of the CCF (particularly considering the difficulty in defining the continuum in M-type stars) while maintaining a large enough number of lines in the stellar mask to obtain a reasonable CCF. We ended up with a number of 5586 usable lines, much less than the original one, but comparable to those of the other DRS masks (e.g., the K5 mask consists of 4828 lines).
The use of this new mask partially improved our qualitative results: the CCF’s shape lost the bumps and more closely resembled a Gaussian (see Fig. 2, upper right panel), but the RV mean error remained more or less the same as the one obtained with the M2 mask, as did the rms of both the RV and the bisector span (see Tab. 1).
We tested the new mask also on the M-type star GJ 625, obtaining the same qualitative results.
| Mask | RV mean error | RV rms | Bis. span rms |
| (m s-1) | (m s-1) | (m s-1) | |
| GJ 3998 | |||
| M2 | 1.88 | 4.89 | 3.75 |
| K5 | 3.59 | 6.46 | 9.75 |
| Adj. M2 | 2.00 | 4.78 | 4.51 |
| MVALD | 1.98 | 4.81 | 4.46 |
| Adjusted MVALD | 2.06 | 4.89 | 4.93 |
| Deblended MVALD | 3.89 | 6.82 | 6.95 |
| GJ 625 | |||
| M2 | 1.13 | 2.78 | 2.29 |
| K5 | 3.13 | 6.82 | 13.82 |
| Adj. M2 | 1.30 | 3.21 | 3.34 |
| MVALD | 1.22 | 3.51 | 3.22 |
| Adjusted MVALD | 1.29 | 3.67 | 3.60 |
| Deblended MVALD | 2.31 | 4.65 | 3.69 |
4 Bisector’s shape
Searching for exoplanets around M-type stars requires reliable activity indicators, due to the stars’ high activity levels. Many M-type stars are faint objects, and as such the information that can be derived from the CCF are important: the CCF is obtained by combining a large number of spectral lines, allowing us to reach a high signal-to-noise ratio even for faint objects.
The CCF’s bisector is an useful indicator for the presence of different velocity fields in the star. Convection in solar-like stars results in a net convective blueshift, arising from the different contributions of the ascending granules and the descending intergranular lanes. The two components combine in a slightly asymmetric line profile, that translates to a C-shaped bisector in quiet stars (Gray 2005). The magnetic activity will change and modulate the bisector’s shape (Dravins 1999), as phenomena such as faculae and plage suppress part of the convective blueshift. As such, the bisector’s time-series may show the activity cycles’ progression.
The effects of the activity on the shape of the spectral lines of M-type stars are still not very well known, even if the RVs variations of active M dwarfs have been studied (Tal-Or et al. 2018). In principle, a similar behaviour is expected in the bisector’s shape and its variations.
We note here that usually the bisector’s shape is not used directly as an activity indicator: the bisector’s span stands as its proxy and it is defined as the difference between the mean values of the bisector in the upper and lower part of the CCF, giving an immediate insight in the asymmetry of the stellar lines. Comparing the radial velocity time-series with the bisector’s span time-series allows to discriminate between Keplerian and stellar variations.
We compared the shapes of the bisectors of the CCFs obtained using the original M2 mask and the K5 mask (see Fig. 2 and Fig. 2, lower left and middle panel respectively): while the K5 bisector shows the expected C-shape, the M2 bisector seems to tilt in the opposite direction and it is afflicted by some non-trivial deformities, which can hardly be explained in some physical way. The adjusted M2 mask smoothes the bisector, but the shape is still quite different from the K5 bisector and some of the segmentation from the original M2 mask remains (see Fig. 2, lower right panel).
The bisectors obtained using either the original or the modified M2 mask seem to have little physical meaning and they should not be used for any kind of activity study.
We decided to follow a different strategy and to build a new mask from scratch.
5 Cross-correlation function and stellar masks: second approach
Instead of modifying an already existing stellar mask or building a stellar mask from an observed spectrum (which in the case of M-type stars would be a long and difficult project due to their numerous and heavily blended lines), we decided to use as a starting point a single theoretical line list. In order to do so, we queried the VALD3 database22 2 http://vald.astro.univie.ac.at/vald3/php/vald.php (Piskunov et al. 1995) and downloaded the line list for a star with Teff=3500 K (the lowest available temperature in the VALD3 database) and in the wavelength region 3900-7000Å.
We transformed the line list in the right format required by the HARPS-N pipeline, then we cut the Balmer lines’ regions and the regions where most of the telluric lines are found, because the former may influence the CCF’s width and the latter may introduce spurious RV modulations (Pepe et al. 2002). Then we removed the most shallow lines, that mostly introduce noise, and we obtained finally the MVALD mask. It contains 17547 lines, almost double than the number of the lines of the original M2 mask (9196), spanning over the wavelength regions 4400-5027 Å, 5105-5303 Å, 5337-5405 Å, 5504-5574 Å, 5580-5675 Å, 5770-5858 Å, 6018-6267 Å, 6374-6432 Å, 6618-6862 Å. We then adjusted the depths of the lines using an observed spectrum of GJ 3998 to create an adjusted MVALD mask.
Both masks give similar results in term of CCF and bisector’s shape (see Fig. 4), and RV precision, with the MVALD mask performing slightly better (see Tab. 1).
As an additional test, we eliminated from the MVALD mask all the lines that fall in the same resolution step with each other (i.e., the lines where ), creating an almost deblended mask. The results are definitely worse: the larger rms (see Tab. 1) may be due to the lower number of lines in the deblended mask (6501 against the original 17547), while we found no explanation on the appearance of both the CCF’s bumps and the bisector’s segmentation (see Fig. 4).

We selected the MVALD mask as our new working mask for M-type stars, and compared the RVs computed by the DRS using the MVALD mask with the results from both the M2 mask and HARPS-TERRA: we found them to be in good agreement (see Fig. 5), but the MVALD RVs correlate better with the HARPS-TERRA results. The RV errors found with HARPS-TERRA are however quite smaller (in the case of GJ 3998 the mean error from HARPS-TERRA is about 1.15 m s-1, while the mean error using the MVALD mask is about 1.92 m s-1).


6 Search for exoplanets
We tested the RV time-series obtained with the MVALD mask against those obtained with the M2 mask and with HARPS-TERRA by searching for already known exoplanets.
The first step of the RV data analysis consists in identifying significant periodic signals in the data. Pre-whitening is a commonly used tool for finding multi-periodic signals in time-series data. With this method we find sequentially the dominant Fourier components in the time-series and remove them. The pre-whitening procedure was applied using the Generalized Lomb-Scargle (GLS) periodogram algorithm (Zechmeister and Kürster 2009) to the RV data obtained with the M2 and MVALD masks. We performed the same analysis also on the detrended RV data, obtained removing the correlation between RV and the bisector’s span. We analyzed with the same method the time-series of bisector’s span, CCF contrast and FWHM, as well, to discriminate also signals possibly due to activity.
We show the results of our work in Tab. 2: we analysed the exoplanet host stars GJ 3998 (confirmed planet with period ), GJ 625 (confirmed planet with ), GJ 686 (confirmed planet with ), and GJ 3942 (confirmed planet with ).
All three methods find the signals due to the planetary orbits with compatible periods.
| Mask | Period | Amplitude | FAP |
| (days) | (m s-1) | ||
| GJ 3998, confirmed planet with | |||
| M2 | 13.718 0.009 | 2.68 0.36 | |
| MVALD | 13.736 0.008 | 2.8 0.35 | |
| HARPS-TERRA | 13.729 0.008 | 2.5 0.3 | |
| GJ 625, confirmed planet with | |||
| M2 | 14.627 0.01 | 1.51 0.25 | |
| MVALD | 14.612 0.009 | 2.2 0.33 | |
| HARPS-TERRA | 14.612 0.0075 | 1.8 0.2 | |
| GJ 686, confirmed planet with | |||
| M2 | 15.57 0.02 | 2.8 0.5 | |
| MVALD | 15.501 0.016 | 3.2 0.5 | |
| HARPS-TERRA | 15.519 0.014 | 2.8 0.4 | |
| GJ 3942, confirmed planet with | |||
| M2 | 6.906 0.003 | 3.4 0.6 | |
| MVALD | 6.905 0.003 | 3.1 0.5 | |
| HARPS-TERRA | 6.905 0.003 | 3.3 0.5 | |
If we investigate the significance of the signal, e.g. by comparing the false alarm probabilities with the different methods (FAP, Zechmeister and Kürster 2009), we can split our targets in two groups, taking into account whether activity signals are found in the time-series or not:
- •
GJ 625 and GJ 686: no activity signal is found in any of the time-series. The FAP of the planetary signal with the MVALD mask falls between the results from HARPS-TERRA and the M2 mask;
- •
GJ 3998 and GJ 3942: the activity signal is found in all the RV time-series. In both cases the FAP of the activity signal is highest in the MVALD data, and the value increases when detrending the RV time-series using the bisector’s span time-series. The situation regarding the planetary signal is less clear: while in the case of GJ 3998 the MVALD mask (both original and detrended) gives the lowest FAP value, in the case of GJ 3942 the MVALD mask performs worse.
There is still not enough statistics to confirm the usefulness of the bisector’s span as computed with the MVALD mask in the modeling and/or removing of the activity signal from the RV time-series, but the MVALD mask do perform better than the standard M2 mask on recovering the planetary signal in our sample of data. The MVALD bisector’s shape (see Fig. 4) is very similar to the K5 one (see Fig. 2) and it does not show any obvious anomaly.
7 Conclusions
HARPS and HARPS-N are still among the leading instruments in the RV exoplanet search, and their pipelines usually give very accurate results regarding both the radial velocity and the activity indicators derived from the CCF. Unfortunately, this is not the case for M-type stars: the default M2 mask gives a strangely shaped CCF, and the K5 mask results in large errors bars on the extracted RVs. By manipulating the M2 mask we could obtain better results in the RV computation, but with some underlying problems still remaining: in particular, the shape of the CCF’s bisector seems to have little physical meaning.
M-type stars are very interesting targets for exoplanet studies, but their high levels of activity have to be taken into account. Spectroscopic studies rely on several activity indicators, but the faintness of these objects favors the use of indicators derived from the CCF. The chief amongst those is the bisector’s span, that is directly derived from the bisector of the CCF. Given that both the original and the modified M2 mask yielded bisectors with shapes devoid of an apparent physical meaning, we created new stellar masks using the line list provided by the VALD3 database. We called the new masks MVALD, adjusted MVALD (where the line depths were adjusted using an observed spectrum), and deblended MVALD (without the line blends).
Working with the spectroscopic time-series of two early M-type exoplanet hosting stars (GJ 3998 and GJ 625), we found that the best results concerning both the RVs precision and the bisector’s shape are obtained using the original MVALD mask, while the deblended MVALD mask shows the beginning of the segmentation behaviour of the bisector. We found good agreement between the RVs found with the MVALD mask and those from HARPS-TERRA, even if the latter have smaller errors. However HARPS-TERRA does not produce a CCF, which is the main limitation of the software, in particular when observing active stars. With the MVALD mask we recovered the signals of the known exoplanets orbiting around GJ 3998, GJ 625, GJ 686, and GJ 3942 with results comparable with those of HARPS-TERRA. Investigating the significance of the signals using the FAP values show that the results obtained using the MVALD mask tend to fall in-between those from HARPS-TERRA and the M2 mask.
Now that the search for exoplanets is moving to targets different from solar-like stars it is important to use new masks for the CCF computation instead of relying on the standard ones: the MVALD mask we created may be a very useful tool for the radial velocity and activity index computation of early M-type stars.
Acknowledgements.
M.R. acknowledges financial support from INAF through the competitive project ”FRONTIERA-2016”. The authors thank the following people for useful comments and insights: J. Maldonado Prado, M. Pinamonti, A. Bignamini, G. Bruno, S. Benatti, E. Poretti.References
- Affer et al. (2016) Affer L, Micela G, Damasso M, et al (2016) HADES RV program with HARPS-N at the TNG GJ 3998: An early M-dwarf hosting a system of super-Earths. A&A 593:A117, DOI 10.1051/0004-6361/201628690, 1607.03632
- Affer et al. (2019) Affer L, Damasso M, Micela G, et al (2019) HADES RV program with HARPS-N at the TNG. IX. A super-Earth around the M dwarf Gl 686. A&A 622:A193, DOI 10.1051/0004-6361/201834868, 1901.05338
- Anglada-Escudé and Butler (2012) Anglada-Escudé G, Butler RP (2012) The HARPS-TERRA Project. I. Description of the Algorithms, Performance, and New Measurements on a Few Remarkable Stars Observed by HARPS. ApJS 200:15, DOI 10.1088/0067-0049/200/2/15, 1202.2570
- Anglada-Escudé et al. (2014) Anglada-Escudé G, Arriagada P, Tuomi M, et al (2014) Two planets around Kapteyn’s star: a cold and a temperate super-Earth orbiting the nearest halo red dwarf. MNRAS 443:L89–L93, DOI 10.1093/mnrasl/slu076, 1406.0818
- Anglada-Escudé et al. (2016) Anglada-Escudé G, Tuomi M, Arriagada P, et al (2016) No Evidence for Activity Correlations in the Radial Velocities of Kapteyn’s Star. ApJ 830(2):74, DOI 10.3847/0004-637X/830/2/74, 1506.09072
- Baranne et al. (1996) Baranne A, Queloz D, Mayor M, et al (1996) ELODIE: A spectrograph for accurate radial velocity measurements. A&AS 119:373–390
- Bonfils et al. (2013) Bonfils X, Delfosse X, Udry S, et al (2013) The HARPS search for southern extra-solar planets. XXXI. The M-dwarf sample. A&A 549:A109, DOI 10.1051/0004-6361/201014704, 1111.5019
- Borsa et al. (2015) Borsa F, Scandariato G, Rainer M, et al (2015) The GAPS programme with HARPS-N at TNG. VII. Putting exoplanets in the stellar context: magnetic activity and asteroseismology of Bootis A. A&A 578:A64, DOI 10.1051/0004-6361/201525741, 1504.00491
- Bourrier et al. (2018) Bourrier V, Lovis C, Beust H, et al (2018) Orbital misalignment of the Neptune-mass exoplanet GJ 436b with the spin of its cool star. Nature 553:477–480, DOI 10.1038/nature24677, 1712.06638
- Cosentino et al. (2012) Cosentino R, Lovis C, Pepe F, et al (2012) Harps-N: the new planet hunter at TNG. In: Ground-based and Airborne Instrumentation for Astronomy IV, Proc.SPIE, vol 8446, p 84461V, DOI 10.1117/12.925738
- Covino et al. (2013) Covino E, Esposito M, Barbieri M, et al (2013) The GAPS programme with HARPS-N at TNG. I. Observations of the Rossiter-McLaughlin effect and characterisation of the transiting system Qatar-1. A&A 554:A28, DOI 10.1051/0004-6361/201321298, 1304.0005
- Delfosse et al. (2013) Delfosse X, Bonfils X, Forveille T, et al (2013) The HARPS search for southern extra-solar planets. XXXIII. Super-Earths around the M-dwarf neighbors Gl 433 and Gl 667C. A&A 553:A8, DOI 10.1051/0004-6361/201219013, 1202.2467
- Dravins (1999) Dravins D (1999) Stellar Surface Convection, Line Asymmetries, and Wavelength Shifts. In: Hearnshaw JB, Scarfe CD (eds) IAU Colloq. 170: Precise Stellar Radial Velocities, Astronomical Society of the Pacific Conference Series, vol 185, p 268
- Dressing and Charbonneau (2015) Dressing CD, Charbonneau D (2015) The Occurrence of Potentially Habitable Planets Orbiting M Dwarfs Estimated from the Full Kepler Dataset and an Empirical Measurement of the Detection Sensitivity. ApJ 807:45, DOI 10.1088/0004-637X/807/1/45, 1501.01623
- Gray (2005) Gray DF (2005) The Observation and Analysis of Stellar Photospheres. Cambridge University Press
- Hunter et al. (2012) Hunter AA, Macgregor AB, Szabo TO, et al (2012) Yabi: An online research environment for grid, high performance and cloud computing. SourceCodeBiolMed 7:1, DOI 10.1186/1751-0473-7-1
- Mayor et al. (2003) Mayor M, Pepe F, Queloz D, et al (2003) Setting New Standards with HARPS. The Messenger 114:20–24
- Pepe et al. (2002) Pepe F, Mayor M, Galland F, et al (2002) The CORALIE survey for southern extra-solar planets VII. Two short-period Saturnian companions to HD 108147 and HD 168746. A&A 388:632–638, DOI 10.1051/0004-6361:20020433, astro-ph/0202457
- Pepe et al. (2010) Pepe FA, Cristiani S, Rebolo Lopez R, et al (2010) ESPRESSO: the Echelle spectrograph for rocky exoplanets and stable spectroscopic observations. In: Ground-based and Airborne Instrumentation for Astronomy III, Proc.SPIE, vol 7735, p 77350F, DOI 10.1117/12.857122
- Perger et al. (2017a) Perger M, García-Piquer A, Ribas I, et al (2017a) HADES RV Programme with HARPS-N at TNG. II. Data treatment and simulations. A&A 598:A26, DOI 10.1051/0004-6361/201628985, 1610.08698
- Perger et al. (2017b) Perger M, Ribas I, Damasso M, et al (2017b) HADES RV Programme with HARPS-N at TNG. VI. GJ 3942 b behind dominant activity signals. A&A 608:A63, DOI 10.1051/0004-6361/201731307, 1709.06851
- Piskunov et al. (1995) Piskunov NE, Kupka F, Ryabchikova TA, et al (1995) VALD: The Vienna Atomic Line Data Base. A&AS 112:525
- Poretti et al. (2016) Poretti E, Boccato C, Claudi R, et al (2016) Global Architecture of Planetary Systems (GAPS), a project for the whole Italian Community. MemSAI 87:141, 1509.03661
- Robertson et al. (2014) Robertson P, Mahadevan S, Endl M, Roy A (2014) Stellar activity masquerading as planets in the habitable zone of the M dwarf Gliese 581. Science 345(6195):440–444, DOI 10.1126/science.1253253, 1407.1049
- Robertson et al. (2015) Robertson P, Roy A, Mahadevan S (2015) Stellar Activity Mimics a Habitable-zone Planet around Kapteyn’s Star. ApJL 805:L22, DOI 10.1088/2041-8205/805/2/L22, 1505.02778
- Suárez Mascareño et al. (2017) Suárez Mascareño A, González Hernández JI, Rebolo R, et al (2017) HADES RV Programme with HARPS-N at TNG. V. A super-Earth on the inner edge of the habitable zone of the nearby M dwarf GJ 625. A&A 605:A92, DOI 10.1051/0004-6361/201730957, 1705.06537
- Tal-Or et al. (2018) Tal-Or L, Zechmeister M, Reiners A, et al (2018) The CARMENES search for exoplanets around M dwarfs. Radial-velocity variations of active stars in visual-channel spectra. A&A 614:A122, DOI 10.1051/0004-6361/201732362, 1803.02338
- Tuomi et al. (2014) Tuomi M, Jones HRA, Barnes JR, et al (2014) Bayesian search for low-mass planets around nearby M dwarfs - estimates for occurrence rate based on global detectability statistics. MNRAS 441(2):1545–1569, DOI 10.1093/mnras/stu358, 1403.0430
- Wittenmyer et al. (2014) Wittenmyer RA, Tuomi M, Butler RP, et al (2014) GJ 832c: A Super-Earth in the Habitable Zone. ApJ 791:114, DOI 10.1088/0004-637X/791/2/114, 1406.5587
- Zechmeister and Kürster (2009) Zechmeister M, Kürster M (2009) The generalised Lomb-Scargle periodogram. A new formalism for the floating-mean and Keplerian periodograms. A&A 496:577–584, DOI 10.1051/0004-6361:200811296, 0901.2573