Tunable two-dimensional electron system at the (110) surface of SnO2
Abstract
We report the observation of a two-dimensional electron system (2DES) at the surface of the transparent bulk insulator SnO2, and the tunability of its carrier density by means of temperature or Eu deposition. The 2DES is insensitive to surface reconstructions and, surprisingly, it survives even after exposure to ambient conditions –an extraordinary fact recalling the well known catalytic properties SnO2. Our data show that surface oxygen vacancies are at the origin of such 2DES, providing key information about the long-debated origin of -type conductivity in SnO2, at the basis of a wide range of applications. Furthermore, our study shows that the emergence of a 2DES in a given oxide depends on a delicate interplay between its crystal structure and the orbital character of its conduction band.
pacs
79.60.-iI Introduction
Tin oxide, a transparent insulator, is a technologically important compound with a wide range of applications. Its exceptional properties stem from its ability to exhibit variable oxygen stoichiometries –a consequence of the variable valence of Sn– accompanied by substantial changes, up to two orders of magnitude, in its conductivity. This remarkable combination of reducibility and changes in conductivity is crucial in the fields of gas sensing Batzill and Diebold 2007; Batzill et al. 2003; Merte et al. 2017; Pea 1981; Sinner-Hettenbach et al. 2002; Semancik and Cox 1987; Watson 1984; Cox et al. 1989 and heterogeneous catalysis Merte et al. 2017; Batzill and Diebold 2005; Jones et al. 1997; Berry 1981; Batzill et al. 2005; Harrison et al. 1999; Cox et al. 1989; Solymosi and Kiss 1976; Fuller and Warwick 1973, while the unique association of high conductivity due to intrinsic defects, transparency to visible light, and high resistance to chemical attack at ambient conditions, allow novel applications including solar cells, liquid crystal displays, or even transparent electrodes, conductive coatings and windows Batzill et al. 2005; Mäki-Jaskari and Rantala 2001; Cox et al. 1989; Sinner-Hettenbach et al. 2002; Egdell et al. 1999.
The origin of -type conductivity in SnO2, at the heart of its numerous applications, has thus attracted a large scientific interest. Bulk SnO2 stabilizes in the rutile structure, with a band gap of 3.6 eV Haines and Léger 1997; Reimann and Steube 1998; Robertson 1979; Munnix and Schmeits 1983, but the presence of a surface modifies this simple picture. Calculations on the thermodynamically most stable termination, the surface, have proposed O -derived defect states within the band gap Munnix and Schmeits 1983. Early photoemission studies on oxygen deficient SnO2 confirmed the existence of such defect states near the valence band maximum Cox et al. 1988; Egdell et al. 1986; Cox et al. 1982; Themlin et al. 1990; Cox et al. 1988; Egdell et al. 1982; Egdell et al. 1987; Hollamby et al. 1993, and suggested the gradual filling of the band gap upon further reduction Oviedo and Gillan 2000; Cox et al. 1988; Jones et al. 1997; Marley and Dockerty 1965. This is in contrast with the metallic two-dimensional electron systems (2DESs) observed in similar transparent conducting oxides, such as In2O3 Zhang et al. 2013, CdO Piper et al. 2008, ZnO Rödel et al. 2018; Yukawa et al. 2016 and TiO2 Rödel et al. 2015; Rödel et al. 2016, where surface defects lead instead to band bending and -type doping of the conduction band.
By means of Angle Resolved PhotoEmission Spectroscopy (ARPES), here we prove the existence 2DES at the surface of SnO2, and characterize its electronic structure. Similar to SrTiO3 Santander-Syro et al. 2011; Rödel et al. 2014 and KTaO3 Bareille et al. 2014, the 2DES in SnO2 arises from oxygen vacancies, and is robust with respect to various surface reconstructions. Intriguingly, the 2DES in SnO2 is not affected by exposure to ambient air, and can be observed without particular surface treatment. Moreover, its carrier density can be tuned by temperature or deposition of Al or Eu, which create oxygen vacancies at the SnO2 surface, in analogy to previous observations in other oxides Rödel et al. 2016; Lömker et al. 2017; Frantzeskakis et al. 2017. These results open possibilities of using and controlling the surface conductivity of SnO2 for novel technological applications.
II Materials and Methods
II.1 Crystal structure and Brillouin zone of
SnO2 crystallizes in the rutile structure. Similar to the perovskite lattice, the oxygen anions form octahedra around the Sn4+ cation. The primitive unit cell, shown in Fig. 1(a), is body-centered tetragonal. The corresponding 3D Brillouin zone is shown in Fig. 1(b), alongside with its projection on the plane. As will be shown later, the periodicity of the shallow metallic state observed in our ARPES data is in perfect agreement with the surface-projected Brillouin zone, confirming the 2D character of such electronic state.

II.2 ARPES experiments and surface preparation

ARPES experiments were performed at the CASSIOPEE beamline of Synchrotron SOLEIL (France) and at beamline 2A of KEK-Photon Factory (KEK-PF, Japan) using hemispherical electron analyzers with vertical and horizontal slits, respectively. Typical electron energy and angular resolutions were 15 meV and 0.25∘. In order to generate pristine surfaces for the ARPES experiments, commercial -oriented SnO2 single crystals (SurfaceNet) were annealed for 20 minutes at a minimum temperature of 600∘C in UHV conditions. Low-energy electron diffraction (LEED) and core-level photoemission spectroscopy were employed to verify the long-range crystallinity and cleanliness of our surfaces after preparation. Depending on the annealing temperature, the clean surfaces showed either a bulk-like periodicity or a weak surface reconstruction Cox et al. 1989; Batzill et al. 2003; Batzill et al. 2005 (see Fig. 2), with no observable difference in the ARPES spectra of the 2DES. As shown as in Fig. 2(c), the energy position and lineshape of photoemission peaks match well with previous experimental results Batzill et al. 2005.
Al and Eu deposition were performed by means of molecular beam epitaxy using Knudsen cells, as described in Refs. Rödel et al. 2016; Lömker et al. 2017. The deposition rates were calibrated with a quartz microbalance. Unless stated differently, ARPES data shown in this manuscript were acquired at K. The typical pressure during ARPES measurements was in the range of mbar, while at no stage of surface preparation it exceeded mbar.
III Results
III.1 Creation of the 2DES


Figure 3(a), bottom panel, shows the energy-momentum map of the valence band using linear horizontal and linear vertical light polarizations. The observed band dispersions demonstrate the crystallinity and cleanliness of the measured surface, while the strong dependence of the spectra on the light polarization indicates a well-defined orbital character of the corresponding states. Furthermore, in striking contrast with the bulk insulating character of SnO2, here we observe a clear metallic state in the vicinity of the Fermi level (), with a band bottom at an approximate binding energy of 0.2 eV –Fig. 3(a), top panel. The energy difference with the valence band maximum (VBM) matches well the energy gap of SnO2 (3.6 eV) as determined by previous experimental and theoretical studies Haines and Léger 1997; Reimann and Steube 1998; Robertson 1979; Munnix and Schmeits 1983. We therefore attribute the metallic state to the conduction band of SnO2 that has been pulled below due to band bending, as observed in surfaces of other bulk insulating oxides Santander-Syro et al. 2011; Meevasana et al. 2011; Santander-Syro et al. 2012; King et al. 2012; Wang et al. 2014; Rödel et al. 2014; S. McKeown Walker et al. 2014; S. McKeown Walker et al. 2015; Rödel et al. 2015; Rödel et al. 2016; Rödel et al. 2017; Rödel et al. 2018; Frantzeskakis et al. 2017. However, in contrast to the -orbital character of the conduction band in transition metal oxides, the conduction band bottom in SnO2 originates mainly from the 5 states of Sn Robertson 1979.
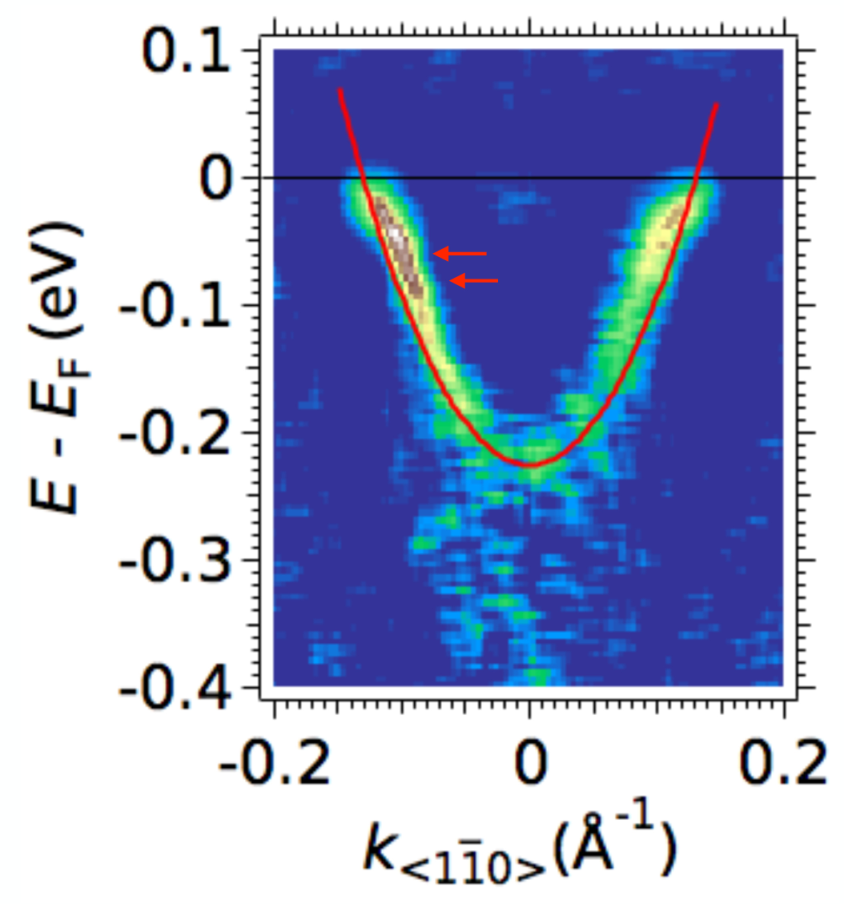
Fig. 3(b) presents a zoom over the metallic state with higher energy resolution. The dispersion is quasi-parabolic, with a kink at an energy of about 80 meV (red arrows) and an intensity built-up at the bottom of the band. Such a kink and strong renormalisation of the band bottom are characteristic signatures of electron-phonon interaction, as previously observed in other oxides such as SrTiO3 Meevasana et al. 2011; Chen et al. 2015; Wang et al. 2016, TiO2 Rödel et al. 2016 and ZnO Rödel et al. 2018. The Fermi momentum () of the metallic state, determined from the maxima of the momentum distribution curve (MDC) integrated over meV, is Å-1.
Fig. 3(c) shows the in-plane ARPES intensity map at measured over several neighboring Brillouin zones. The aforementioned metallic state gives rise to a circular Fermi contour around the center of, and with the same reciprocal-space periodicity as, the surface-projected Brillouin zone of the bulk rutile structure of SnO2 shown in Fig. 1(b). Moreover, the isotropic shape of the Fermi contours, and especially the strong dependence of their ARPES intensity on different Brillouin zones and/or different photon polarizations Moser 2017 (Appendix A), are in line with the expected -like orbital character at the bottom of SnO2 conduction band, as discussed above. We note that the 2DES is insensitive to the surface reconstruction observed in some of our in-situ prepared surfaces, Fig. 2(a), as no Umklapp band structure is observed by ARPES. This suggests that the 2DES resides in the subsurface region (1-2 unit cells below the surface as analyzed later), in agreement with previous conclusions on the -oriented surfaces of SrTiO3 Rödel et al. 2014 and KTaO3 Bareille et al. 2014.
Fig. 3(d) shows the out-of-plane Fermi contour of the metallic state. The absence of dispersion along the direction throughout the complete bulk Brillouin zone demonstrates the near-surface confinement of the conduction band, hence forming a 2DES. The ARPES intensity modulations as a function of out-of-plane momentum, also observed in many other 2DESs Rödel et al. 2014; Rödel et al. 2015; Rödel et al. 2016; Rödel et al. 2017; Rödel et al. 2018, are a consequence of dipole-transition selection rules from the confined electronic states at the surface of the material Rödel et al. 2014; Rödel et al. 2015; Moser et al. 2018. The periodicity of this modulation is approximately determined by the width Å of the potential well confining the electrons in the 2DES, which yields Å, in good agreement with the value inferred from Fig. 3(d) –see Appendix F for details. Recalling that the in-plane Fermi surface is a circle, the corresponding Fermi surface in 3D -space would be a cylinder. Our combined findings prove thus the realization of an -derived 2DES on a rutile structure oxide. Following the Luttinger theorem, the corresponding 2D carrier density () can be extracted from the area () of the in-plane contour as cm-2. This is about 5 times smaller than the carrier density found in analogous 2DESs created by oxygen vacancies at the surface of other binary oxides, such as TiO2(001)-anatase Rödel et al. 2015 or ZnO Rödel et al. 2018, and up to 20 times smaller than the density of the 2DES at the SrTiO3(001) surface Santander-Syro et al. 2011; Meevasana et al. 2011; Rödel et al. 2016.
III.2 Tunability of the 2DES
III.2.1 Temperature dependence
We now show two simple methods for tuning the carrier density of the 2DES in SnO2: controlled temperature variations and surface deposition of Europium (Eu) or Aluminium (Al).
Figs. 4(a-g) show the energy-momentum dispersion of the 2DES as the temperature gradually increases from 20 K to 300 K. The succession of images reveals that the metallic state continuously shifts upwards in energy upon increasing . The corresponding decrease of the Fermi momenta translates into a reduction of the 2D carrier density. A quantitative analysis of the values obtained from the MDCs, presented in Tab. 1, shows a 50% reduction of the carrier density at 150 K with respect to 20 K. We highlight the clear 2DES fingerprint at room temperature, but we note that there is an uncertainty whether the electronic band lies above or below at such high temperatures because the band bottom is masked by the thermal broadening. Temperature-dependent transport measurements may shed light on this issue. Nevertheless, the robustness of the 2DES at high temperatures is of obvious importance for technological applications.

| (K) | 20 | 50 | 100 | 150 | ||
|---|---|---|---|---|---|---|
| ( Å-1) | 85 1 | 80 1 | 71 1 | 60 2 | 51 2 | 63 1 |
| ( cm-2) | 11.5 0.3 | 10.2 0.3 | 8.0 0.2 | 5.7 0.4 | 4.1 0.3 | 6.3 0.2 |

We underline that the observed tunability in carrier density by means of temperature variations is well controlled and, to a great extent, reversible.
After heating the sample from 16 K to 300 K in order to decrease the 2D carrier density as shown in Fig. 4, we decreased the temperature back to 15 K in order to check the reversibility of the phenomenon. Fig. 5 and Tab. 1 show indeed that the 2D carrier density increases as the temperature decreases. After a full thermal cycle, the final value is close to the original one, although the recovery is incomplete, similar to previous observations for SrTiO3 Rödel.
The observed temperature dependence of the 2DES carrier density in SnO2 might be due to temperature-induced variations in its dielectric constant Lanje et al. 2010, which would affect the strength of the confining potential well, and/or to thermal-induced migration of oxygen atoms from the bulk to the surface. A thorough exploration of this issue is left open to future works. In this sense, the reason behind the incomplete recovery of the 2DES after a warming-cooling cycle might be the diffusion, while the sample is heated, of oxygen atoms from the bulk to the surface that irreversibly replenish some of the oxygen vacancies.
III.2.2 Surface deposition of Eu or Al
The second method for modifying the 2D carrier density, namely surface deposition of Eu or Al, is inspired by our recent studies showing that some metallic adatoms on the surface of transition metal oxides act as efficient reduction agents, pumping out the near-surface oxygen atoms, thus producing 2DES capped by a layer of the adatom native oxide Rödel et al. 2016; Lömker et al. 2017. Fig. 6 summarizes all the pertinent spectral changes after the deposition of 1 ML of elemental Eu or 2 Å of elemental Al. Besides the clear oxidation of Al as indicated in Fig. 6(a), or the formation of Eu+2 as indicated in Fig. 6(c), one also observes, a shown in Fig. 6(b), that the bundle of SnO2-4 core levels is drastically modified, developing two new peaks at its low binding energy side. The energy of these new peaks matches well with the spin-orbit-split doublet of metallic Sn, while their seemingly “inverted” branching ratio indeed agrees well with previous experiments on partially oxidized tin Padova et al. 1994, all of which indicates that near-surface Sn atoms have been deprived of some of their oxygen neighbors. A detailed quantitate analysis of these peaks by numerical fitting is given in Appendix C. Note that in Fig. 6(c), the additional peak above the valence band after Eu deposition, which we assign to the Eu+2 core level, did not appear after Al deposition as expected.
Combining all these results, we can conclude that: (1) the new pair of peaks after Eu or Al deposition are not related to Eu core levels, but rather to the doublet of metallic Sn core levels; (2) the additional peak above the valence band after Eu deposition is not an in-gap state due to oxygen vacancies, but rather the Eu+2 core level.
The presence of Sn atoms with a lower oxidation number than in the pure surface is an indication that Al or Eu have been effective in removing the near-surface oxygen atoms by a redox reaction, hence driving the emergence of a 2DES, as shown respectively in Figs. 6(d) and (e), similar to the AlOx/SrTiO3 and EuO/SrTiO3 systems Rödel et al. 2016; Lömker et al. 2017.
As shown in Fig. 6(f), the Fermi momenta of the 2DES at the AlOx/SnO2 interface (green) or the EuO/SnO2 interface (blue) are larger than the one at the bare SnO2 surface (red). The corresponding 2D carrier density in EuO/SnO2, deduced from the observed Fermi momenta Å-1, is now cm-2, implying a twofold increase with respect to the bare surface of SnO2, while in AlOx/SnO2, the 2D carrier density increases around 40% to cm-2. This enhancement of beyond the saturation limit presented by the bare surface under UV irradiation has not been observed in other 2DES created by redox reactions at metal-oxide interfaces Rödel et al. 2016; Lömker et al. 2017, and implies that the carrier density of the 2DES in SnO2 can be tuned via adatom deposition. As shown in the Appendix D, the 2D character of the metallic state at the EuO/SnO2 interface is confirmed by the absence of out-of-plane dispersion.
One step further, 2 ML elementary Eu can be deposited at the surface of SnO2 (Appendix E). As a final result, a higher doublet of the metallic Sn peaks are observed, while no additional metallic states possibly from metallic Eu are detected, suggesting that the deposited 2 ML Eu are fully oxidized. However, the so-formed 2DES shows the same carrier density obtained with the 1 ML Eu capping, a saturation phenomenon also observed in the EuO/SrTiO3 system Lömker et al. 2017. Additionally, as 2 ML of EuO are ferromagnetic Lömker et al. 2017, one could expect to induce a magnetization of the underlying 2DES, which can be interesting for applications in spintronics.
IV Discussion
We now turn to the origin of the 2DES on SnO2. The widely-accepted mechanism of formation of 2DESs at the surface of transition metal oxides, such as SrTiO3, TiO2, KTaO3, CaTiO3 and ZnO, is the creation of oxygen vacancies in the near-surface region, induced either by UV/X incoming photons, or by a redox reaction between the oxide substrate and a reducing metallic agent evaporated at its surface Aiura et al. 2002; Santander-Syro et al. 2011; Meevasana et al. 2011; Santander-Syro et al. 2012; King et al. 2012; Wang et al. 2014; Rödel et al. 2014; S. McKeown Walker et al. 2014; S. McKeown Walker et al. 2015; Rödel et al. 2015; Rödel et al. 2016; Rödel et al. 2017; Lömker et al. 2017; Rödel et al. 2018. Nevertheless, in some oxides, other microscopic phenomena, such as intrinsic electron accumulation and doping with hydrogen impurities may also have an important role for the onset of conductivity King and Veal 2011. In fact, recent numerical calculations for SnO2 have suggested that even though the surface, which is characterized by an ordered arrangement of Sn3O3 clusters, contains a deficiency of oxygen atoms, it remains insulating with a small band gap open Merte et al. 2017. Our work shows that the deposition of a reducing metal agent changes dramatically the chemical environment of Sn atoms as some of the latter pass into a lower oxidation state [Fig. 6(a)]. Therefore, the structural model based on Sn interstitials cannot account for the surface 2DES. On the other hand, a structural model based on the presence of surface oxygen vacancies as suggested in Refs. Jones et al. 1997 and Oviedo and Gillan 2002 might explain the absence of bonding counterparts to the Sn atoms and the enhancement of the 2DES.
The 2DES observed at the surface of SnO2 is, to our knowledge, the first of its kind on a rutile structure. In fact, a previous comparison of the near- electronic structure of TiO2-rutile and TiO2-anatase has led to the conclusion that surface oxygen vacancies on a rutile structure create excess electrons that remain localized at Ti sites rather than forming a 2DES Moser et al. 2013; Rödel et al. 2015. The present work shows that such a conclusion cannot be generalized to all rutile lattices, and other factors, such as the orbital character of the confined states ( for TiO2 vs. for SnO2) , have to be taken into account to understand the emergence of a 2DES.

Finally, we underline that besides its robustness against different surface reconstructions and high temperatures, the 2DES at the surface of SnO2 even survives exposure to ambient pressure. In fact, being an excellent material for heterogeneous catalysis, the surface of SnO2 is expected to easily adsorb and desorb gas molecules. Thus, in order to test its catalytic properties, we studied the electronic structure of the SnO2(110) surface without prior preparation or cleaning in UHV, and using the UV beam at beamline 2A of KEK-PF, whose low brilliance ( photons s-1 m-2), about 100 times smaller than other photoemission beamlines in third generation synchrotrons, has been previously shown to strongly reduce or even inhibit the photo-induced creation of oxygen vacancies in other oxides Backes et al. 2016. As demonstrated in Fig. 7, the characteristic parabolic dispersion and circular Fermi surface of the 2DES in SnO2 can be observed even under these adverse measurement conditions –note that even the slightest exposure to moderate vacuum would normally make the surface unsuitable for ARPES measurements, due to the strong surface sensitivity of the technique. We note furthermore that the 2DES was observed immediately after illumination with the low-brilliance UV beam, and no evolution of its carrier density was evident even after several hours of measurements.
The Fermi momentum of such a 2DES intrinsically present at the SnO2 surface, determined from the MDC peaks at , is Å-1, which is comparable to the Fermi momentum of the 2DES observed at the UHV-prepared surface shown in Fig. 3. These results show that, either under the normal conditions of ambient pressure, temperature and illumination, or the exposure to low-brilliance UV light, a 2DES in SnO2 can be readily observed despite the absence of surface treatment, suggesting that the catalytic properties of this material protect, or might even induce, such a 2DES, and making of SnO2 a unique candidate for future technological applications.
V Conclusions
In conclusion, we observed a metallic 2DES at the surface of SnO2 by means of ARPES. Its carrier density can be enhanced by the deposition of elemental Al or Eu, and reduced by a controlled temperature increase, while the 2DES remains robust against different surface reconstructions, high temperatures and exposure to ambient pressure. The spectral fingerprints of the 2DES show an appreciable electron-phonon interaction, with the system always lying in the Fermi liquid regime (Appendix G) due to the small dielectric constant of SnO2. The strong effect of a reducing metal agent such as Al or Eu on the emergence and enhancement of the 2DES proves that surface oxygen vacancies are at the origin of the 2DES in SnO2. Our results provide new important insights on the long-withstanding debate on the origin of the -type conductivity of SnO2, and prove that both the crystal structure and the orbital origin of the conduction electrons are decisive for the emergence of a 2DES in oxides.
Acknowledgements.
Work at CSNSM and ISMO was supported by public grants from the Centre National de la Recherche Scientifique (CNRS, project PICS FermiAds No 272651), the French National Research Agency (ANR, project LACUNES No ANR-13-BS04-0006-01), and the “Laboratoire d’Excellence Physique Atomes Lumière Matière” (LabEx PALM projects ELECTROX, 2DEG2USE and 2DTROX) overseen by the ANR as part of the “Investissements d’Avenir” program (reference: ANR-10-LABX-0039). Work at KEK-PF was supported by Grants-in-Aid for Scientific Research (Nos. 16H02115 and 16KK0107) from the Japan Society for the Promotion of Science (JSPS). Experiments at KEK-PF were performed under the approval of the Program Advisory Committee (proposals 2016G621, 2015S2005 and 2018S2004) at the Institute of Materials Structure Science at KEK.Appendix A ARPES results with linear vertical polarization
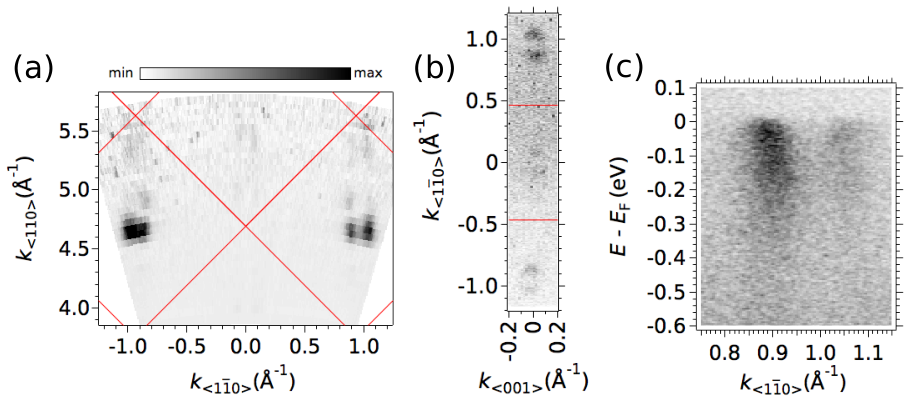
The majority of the data shown in the main text were acquired with linear horizontal (LH) light polarization. For the sake of completion we present here the main results obtained on the bare surface of SnO2 using linear vertical (LV) polarization. Fig. 8 shows the out-of-plane Fermi surface contours, the in-plane Fermi surface contours, and the energy dispersion of the metallic 2DES as probed by LV photons in panels (a), (b) and (c), respectively. A comparison of Figs. 8(a) and Fig. 3(d) of the main text reveals a clear polarization selection at normal emission (i.e. ) where there is almost no photoemission intensity with LV photons. Moreover, there is a strong suppression of spectral weight along the directions. These intensity variations are due to the orbital character of the 2DES state Moser 2017.
Appendix B Gibbs free energies of relevant redox reactions
We now consider the Gibbs free energies for the redox reactions relevant to our experiments, namely the ones needed to form SnO2, Al2O3, and EuO at 25 ∘C. According to the database found in the chemistry-reference website the, we have:
| (1) |
Thus,
| (2) |
So, instead of a simple picture of Eu or Al ionization, these exothermic redox reactions will happen spontaneously once Eu or Al is deposited at the SnO2 surface. This conclusion is consistent with our XPS data and analysis.
Appendix C Quantitate analysis of Sn core level peaks by numerical fitting
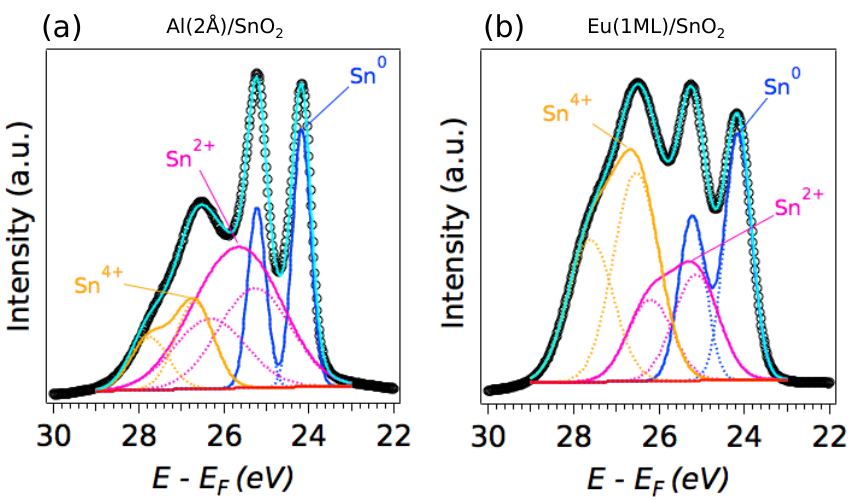
We further analyzed the Sn core levels measured after Al(2Å) or Eu(1 ML) deposition at the SnO2(110) surface by numerical fitting with Lorentzian peaks and a Shirley background as shown in Fig. 9. As demonstrated by previous experiments Padova et al. 1994, exposure of a clean tin surface to oxygen results in the appearance of an oxidized component at the high-binding-energy side of the metallic Sn doublet, composed of a bundle of four peaks: the Sn2+ and Sn4+ doublets. Thus, to fit our data we use three doublets (Sn0, Sn2+ and Sn4+ states), constraining their branching ratio to , within 10% of the value of expected for a -doublet, their energy difference to eV, corresponding to the splitting in metallic tin Padova et al. 1994, and keeping the same broadening for the peaks of each doublet. As seen in Fig. 9, the overall fit describes very well the data, confirming the effective reduction, and concomitant formation of oxygen vacancies, in the SnO2 surface after Al or Eu deposition.
Appendix D Fermi surfaces of the 2DES at the interface EuO(1 ML)/SnO2
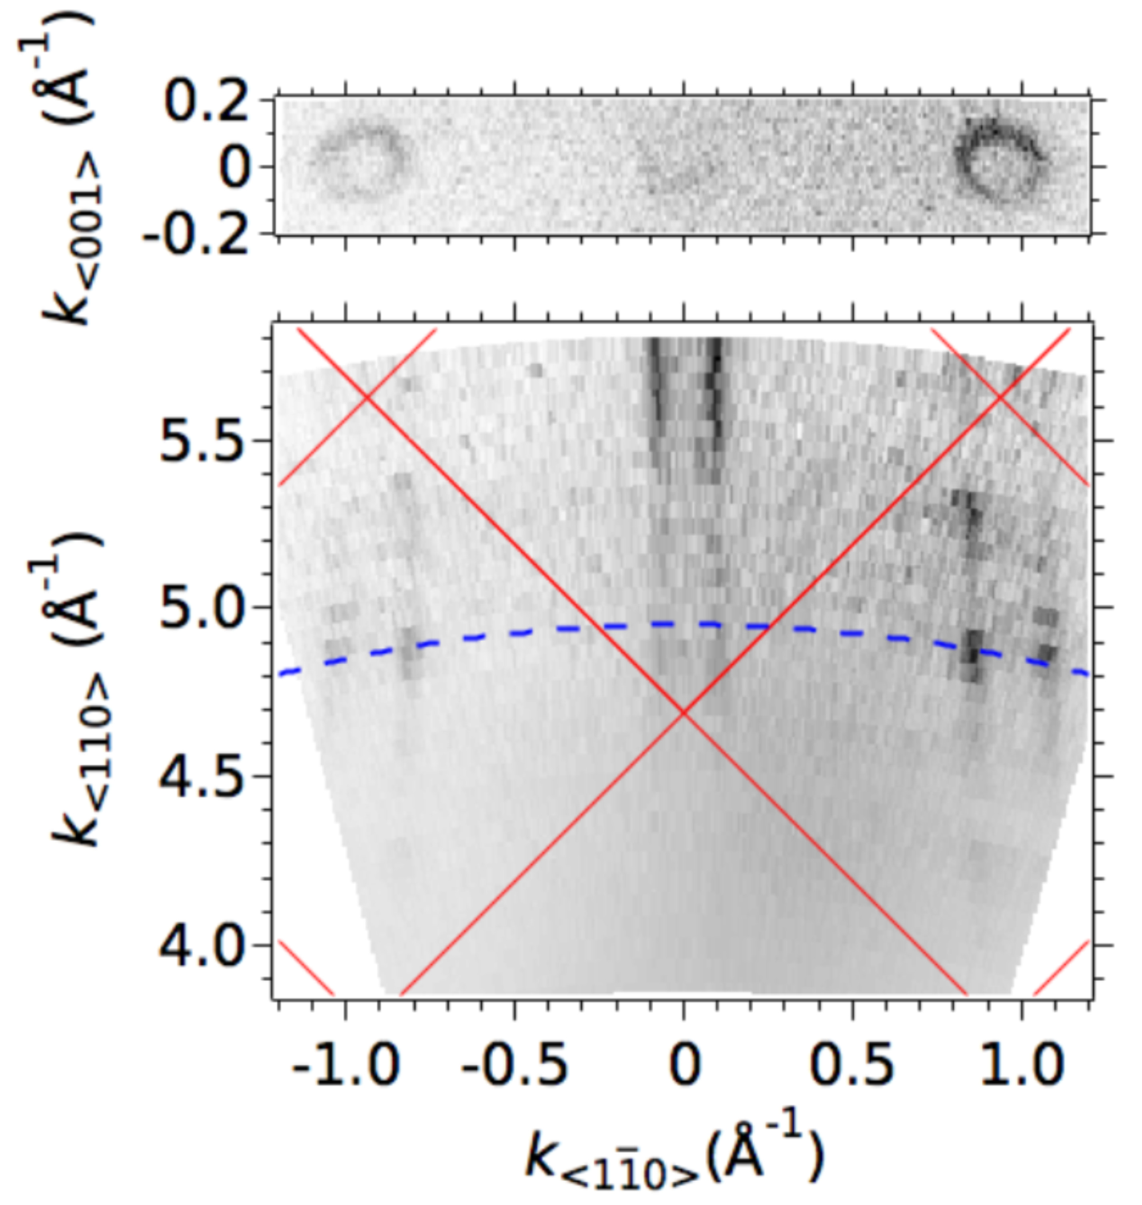
Fig. 10 shows the in-plane and out-of-plane Fermi surfaces obtained at the EuO(1 ML)/SnO2 interface after deposition of 1 ML of metallic Eu on the SnO2(110) surface. The in-plane periodicity of the Fermi circles corresponds to that of the projected bulk Brillouin zone, while the absence of out-of-plane dispersion demonstrates the 2D character of the confined state.
Appendix E 2 ML elemental Eu capping at the SnO2(110) surface
According to a previous work in the EuO/SrTiO3 system Lömker et al. 2017, EuO(1 ML)/SrTiO3 shows a paramagnetic behavior while EuO(2 ML)/SrTiO3 shows a ferromagnetic behavior, even though the carrier density remains the same in both cases, indicating a saturation in the creation of itinerant electrons from oxygen vacancies at the surface. Inspired by this work, we deposited 2 ML pure Eu on SnO2 to check whether this Eu coverage will also be fully oxidized, and explore potential changes in the 2DES.
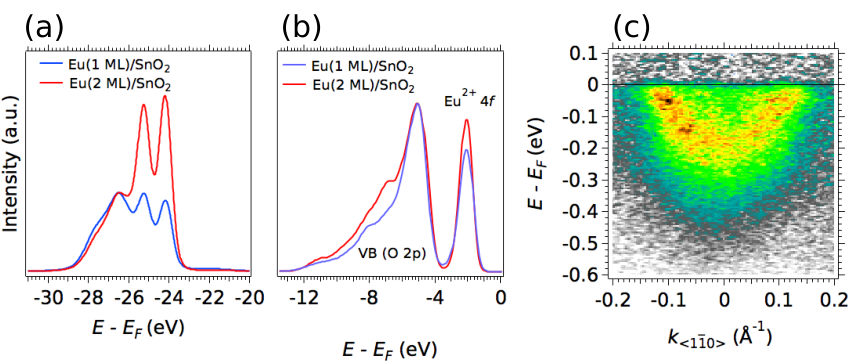
The observation of a larger metallic Sn doublet in Fig. 11(a) and a larger Eu+2 peak in Fig. 11(b) suggest that more oxygen vacancies were created after deposition of 2 ML Eu on the SnO2 surface, compared to 1 ML Eu deposition. In both cases, the XPS profile lines show the same shape without additional peaks appearing, indicating that Eu is still mainly oxidized into Eu+2. The 2DES resulting after deposition of 2 ML Eu on the SnO2(110) surface, presented in Fig. 11(c), shows the same carrier density and effective mass as the 2DES at the interface of Eu(1 ML)/SnO2. An analogous saturation was reported in the EuO/SrTiO3 system Lömker et al. 2017. These result also indicate that the 2 ML Eu are fully oxidized.
Appendix F Extracting the 2DES parameters
We now present a further analysis of the 2DES dispersion after the deposition of Eu in order to extract the parameters of the confinement surface potential. Fig. 12 shows the 2D curvature Zhang et al. 2011 of the spectral intensity previously shown in Fig. 6(e) of the main text. A parabolic fit of the energy dispersion, in the form , yields a band bottom meV and an effective mass not. We assume that the first excited state () of the confining quantum well, not directly observed in our data, lies just above . This will provide an upper bound for the width of the quantum well. Taking, for simplicity, a wedge-shaped potential well, the values (in eV) of the discrete energy levels are given by Santander-Syro et al. 2011; Frantzeskakis et al. 2017:
with the energy depth of the quantum well (eV), the effective mass of the confined electrons, and the strength of the electric field generating the confining potential (V/m).
With the subband (ground state) at 225 meV below , and the subband (first excited state) at the Fermi level, the electric field strength can be calculated to be MV/m. This yields meV, Å (i.e. 3 unit cells) for the spatial extension of the wave-function in the ground state of the 2DES, the main part of which thus lies 1-2 unit cells below the surface, and a maximum width of the confining potential Å (6 unit cells). These parameters are similar to the characteristics of the textbook 2DES observed at the surface of SrTiO3 Santander-Syro et al. 2011; Meevasana et al. 2011; Frantzeskakis et al. 2017.
Appendix G Electron-phonon interaction
The fingerprint of the electron-phonon interaction is a kink in the experimental dispersion that corresponds to the characteristic energy of the phonon. After the deposition of Eu, two such kinks are observed in the energy dispersion of the 2DES at the surface of SnO2 (Fig. 12). The corresponding phonon energies are 59 meV ( mode) and 79 meV ( mode) Peercy and Morosin 1973; Dieguez et al. 2001; Sangeetha et al. 2011. In the presence of electron-phonon coupling, the predominant interactions vary as a function of the carrier density, giving rise to two different regimes: the polaronic regime at low carrier densities, where the long-range Fröhlich interaction prevails, and the Fermi liquid regime at high carrier densities, where the long range interaction is suppressed by strong electronic screening Chen et al. 2015; Wang et al. 2016.
The critical carrier density between these two regimes can be estimated by balancing the relevant phonon energy and the surface plasma frequency given by the carrier density Verdi et al. 2017:
where is the vacuum permittivity, is the dielectric constant in high frequency limit, and is the carriers’ effective mass. Given that and for SnO2, we can use a relevant phonon energy cutoff of 80 meV, and the aforementioned spatial extension of the confining potential ( Å) to estimate a critical carrier density cm-2. This rather low critical carrier density is mainly due to the small dielectric constant of SnO2, and means that the 2DESs both at the bare SnO2 surface and at the EuO/SnO2 interface lie in the Fermi liquid regime -as their corresponding carrier concentrations are up to one order of magnitude larger than the critical one. This is confirmed in the experimental data by the absence of the spectroscopic fingerprint of Fröhlich polarons: replica bands at higher binding energies Chen et al. 2015; Wang et al. 2016. This is in stark contrast with the 2DESs on SrTiO3 and TiO2 surfaces where clear band satellites were observed at similar carrier densities owing to the large dielectric constant of the corresponding materials Chen et al. 2015; Wang et al. 2016; Moser et al. 2013.
References
- Batzill and Diebold (2007) M. Batzill and U. Diebold, Phys. Chem. Chem. Phys. 9, 2307 (2007).
- Batzill et al. (2003) M. Batzill, K. Katsiev, and U. Diebold, Surf. Sci. 529, 295 (2003).
- Merte et al. (2017) L. R. Merte, M. S. Jørgensen, K. Pussi, J. Gustafson, M. Shipilin, A. Schaefer, C. Zhang, J. Rawle, C. Nicklin, G. Thornton, et al., Phys. Rev. Lett. 119, 096102 (2017).
- Pea (1981) Catalysis and Chemical Processes (Eds. R. Pearce and W. R. Patterson, 1981).
- Sinner-Hettenbach et al. (2002) M. Sinner-Hettenbach, Göthelid, T. Weiss, N. Barsan, U. Weimar, H. von Schenck, L. Giovanelli, and G. L. Lay, Surf. Sci. 499, 85 (2002).
- Semancik and Cox (1987) S. Semancik and D. F. Cox, Sens. Actu. 12, 101 (1987).
- Watson (1984) J. Watson, Sens. Actu. 5, 29 (1984).
- Cox et al. (1989) D. F. Cox, T. B. Fryberger, and S. Semancik, Surf. Sci. 224, 121 (1989).
- Batzill and Diebold (2005) M. Batzill and U. Diebold, Prog. Surf. Sci. 79, 47 (2005).
- Jones et al. (1997) F. H. Jones, R. Dixon, J. S. Foord, R. G. Egdell, and J. B. Pethica, Surf. Sci. 376, 367 (1997).
- Berry (1981) F. J. Berry, Adv. Catal. 30, 97 (1981).
- Batzill et al. (2005) M. Batzill, K. Katsiev, J. M. Burst, and U. Diebold, Phys. Rev. B 72, 165414 (2005).
- Harrison et al. (1999) P. G. Harrison, C. Bailey, and W. Azelee, J. Catal. 186, 147 (1999).
- Solymosi and Kiss (1976) F. Solymosi and J. Kiss, J. Catalysis 41, 202 (1976).
- Fuller and Warwick (1973) M. J. Fuller and M. E. Warwick, J. Catalysis 29, 441 (1973).
- Mäki-Jaskari and Rantala (2001) M. A. Mäki-Jaskari and T. T. Rantala, Phys. Rev. B 64, 075407 (2001).
- Egdell et al. (1999) R. G. Egdell, J. Rebane, and T. J. Walker, Phys. Rev. B 59, 1792 (1999).
- Haines and Léger (1997) J. Haines and J. Léger, Physical Review B 55, 11144 (1997).
- Reimann and Steube (1998) K. Reimann and M. Steube, Solid State Communications 105, 649 (1998).
- Robertson (1979) J. Robertson, J. Phys. C 12, 4767 (1979).
- Munnix and Schmeits (1983) S. Munnix and M. Schmeits, Phys. Rev. B 27, 7624 (1983).
- Cox et al. (1988) D. F. Cox, T. B. Fryberger, and S. Semancik, Phys. Rev. B 38, 2072 (1988).
- Egdell et al. (1986) R. G. Egdell, S. Eriksen, and W. R. Flavell, Solid State Commun. 60, 835 (1986).
- Cox et al. (1982) P. A. Cox, R. G. Egdell, C. Harding, W. R. Patterson, and P. J. Tavener, Surf. Sci. 123, 179 (1982).
- Themlin et al. (1990) J. Themlin, R. Sporken, J. Darville, R. Caudano, J. Gilles, and R. Johnson, Phys. Rev. B 42, 11914 (1990).
- Egdell et al. (1982) R. G. Egdell, S. Eriksen, and W. R. Flavell, Solid State Commun. 44, 837 (1982).
- Egdell et al. (1987) R. G. Egdell, S. Eriksen, and W. R. Flavell, Surf. Sci. 192, 265 (1987).
- Hollamby et al. (1993) P. C. Hollamby, P. S. Aldridge, G. Moretti, R. G. Egdell, and W. R. Flavell, Surf. Sci. 280, 393 (1993).
- Oviedo and Gillan (2000) J. Oviedo and M. G. Gillan, Surf. Sci. 467, 35 (2000).
- Marley and Dockerty (1965) J. A. Marley and R. C. Dockerty, Phys. Rev. 140, A304 (1965).
- Zhang et al. (2013) K. Zhang, R. Egdell, F. Offi, S. Iacobucci, L. Petaccia, S. Gorovikov, and P. King, Phys. Rev. Lett. 110, 056803 (2013).
- Piper et al. (2008) L. Piper, L. Colakerol, P. King, A. Schleife, J. Zúñiga-Pérez, P.-A. Glans, T. Learmonth, A. Federov, T. Veal, F. Fuchs, et al., Phys. Rev. B 78, 165127 (2008).
- Rödel et al. (2018) T. C. Rödel, J. Dai, F. Fortuna, E. Frantzeskakis, P. L. Fèvre, F. Bertran, M. Kobayashi, R. Yukawa, T. Mitsuhashi, M. Kitamura, K. Horiba, H. Kumigashira, and A. F. Santander-Syro, Phys. Rev. Mater. 2, 051601(R) (2018).
- Yukawa et al. (2016) R. Yukawa, K. Ozawa, S. Yamamoto, H. Iwasawa, K. Shimada, E. Schwier, K. Yoshimatsu, H. Kumigashira, H. Namatame, M. Taniguchi, et al., Phys. Rev. B 94, 165313 (2016).
- Rödel et al. (2015) T. C. Rödel, F. Fortuna, F. Bertran, M. Gabay, M. J. Rozenberg, A. F. Santander-Syro, and P. L. Fèvre, Phys. Rev. B 92, 041106 (2015).
- Rödel et al. (2016) T. C. Rödel, F. Fortuna, S. Sengupta, E. Frantzeskakis, P. L. Fèvre, F. Bertran, B. Mercey, S. Matzen, G. Agnus, T. Maroutian, et al., Adv. Mater. 28, 1976 (2016).
- Santander-Syro et al. (2011) A. F. Santander-Syro, O. Copie, T. Kondo, F. Fortuna, S. Pailhès, R. Weht, X. G. Qiu, F. Bertran, A. Nicolau, A. Taleb-Ibrahimi, P. L. Fèvre, G. Herranz, M. Bibes, N. Reyren, Y. Apertet, P. Lecoeur, A. Barthélémy, and M. J. Rozenberg, Nature 469, 189 (2011).
- Rödel et al. (2014) T. C. Rödel, C. Bareille, F. Fortuna, C. Baumier, F. Bertran, P. L. Fèvre, M. Gabay, O. H. Cubelos, M. J. Rozenberg, T. Maroutian, P. Lecoeur, and A. F. Santander-Syro, Phys. Rev. Appl. 1, 051002 (2014).
- Bareille et al. (2014) C. Bareille, F. Fortuna, T. C. Rödel, F. Bertran, M. Gabay, O. H. Cubelos, A. Taleb-Ibrahimi, P. L. Fèvre, M. Bibes, A. Barthélémy, T. Maroutian, P. Lecoeur, M. J. Rozenberg, and A. F. Santander-Syro, Sci. Rep. 4, 3586 (2014).
- Lömker et al. (2017) P. Lömker, T. C. Rödel, T. Gerber, F. Fortuna, E. Frantzeskakis, P. Le Fèvre, F. Bertran, M. Müller, and A. F. Santander-Syro, Phys. Rev. Mater. 1, 062001 (2017).
- Frantzeskakis et al. (2017) E. Frantzeskakis, T. C. Rödel, F. Fortuna, and A. F. Santander-Syro, J. Electron Spectr. Rel. Phenom. 219, 16 (2017).
- Meevasana et al. (2011) W. Meevasana, P. D. C. King, R. H. He, S.-K. Mo, M. Hashimoto, A. Tamai, P. Songsiriritthigul, F. Baumberger, and Z.-X. Shen, Nat. Mater. 10, 114 (2011).
- Santander-Syro et al. (2012) A. F. Santander-Syro, C. Bareille, F. Fortuna, O. Copie, M. Gabay, F. Bertran, A. Taleb-Ibrahimi, P. L. Fèvre, G. Herranz, N. Reyren, M. Bibes, A. Barthélémy, P. Lecoeur, J. Guevara, and M. J. Rozenberg, Phys. Rev. B 86, 121107 (2012).
- King et al. (2012) P. D. C. King, R. H. He, T. Eknapakul, P. Buaphet, S.-K. Mo, Y. Kaneko, S. Harashima, Y. Hikita, M. S. Bahramy, C. Bell, Z. Hussain, Y. Tokura, Z.-X. Shen, H. Y. Hwang, F. Baumberger, and W. Meevasana, Phys. Rev. Lett. 108, 117602 (2012).
- Wang et al. (2014) Z. Wang, Z. Zhong, X. Hao, S. Gerhold, B. Stoger, M. Schmid, J. Sanchez-Barriga, A. Varykhalov, C. Franchini, K. Held, and U. Diebold, PNAS 111, 3933 (2014).
- S. McKeown Walker et al. (2014) S. McKeown Walker, A. de la Torre, F. Y. Bruno, A. Tamai, T. K. Kim, M. Hoesch, M. Shi, M. S. Bahramy, P. D. C. King, and F. Baumberger, Phys. Rev. Lett. 113, 177601 (2014).
- S. McKeown Walker et al. (2015) S. McKeown Walker, F. Y. Bruno, Z. Wang, A. de la Torre, S. Ricco, A. Tamai, T. K. Kim, M. Hoesch, M. Shi, M. S. Bahramy, P. D. C. King, and F. Baumberger, Adv. Mater. 27, 3894 (2015).
- Rödel et al. (2017) T. C. Rödel, M. Vivek, F. Fortuna, P. L. Fèvre, F. Bertran, R. Weht, J. Goniakowski, M. Gabay, and A. F. Santander-Syro, Phys. Rev. B 96, 041121(R) (2017).
- Chen et al. (2015) C. Chen, J. Avila, E. Frantzeskakis, A. Levy, and M. C. Asensio, Nat. Commun. 6, 8585 (2015).
- Wang et al. (2016) Z. Wang, S. M. Walker, A. Tamai, Y. Wang, Z. Ristic, F. Y. Bruno, A. De La Torre, S. Riccò, N. Plumb, M. Shi, et al., Nat. Mater. 15, 835 (2016).
- Moser (2017) S. Moser, J. Electron Spectr. Rel. Phenom. 214, 29 (2017).
- Moser et al. (2018) S. Moser, V. Jovic, R. Koch, L. Moreschini, J.-S. Oh, C. Jozwiak, A. Bostwick, and E. Rotenberg, Journal of Electron Spectroscopy and Related Phenomena 225, 16 (2018).
- (53) T. C. Rödel, private communication.
- Lanje et al. (2010) A. S. Lanje, S. J. Sharma, R. B. Pode, and R. S. Ningthoujam, Arch. Apll. Sci. Res. 2, 127 (2010).
- Padova et al. (1994) P. D. Padova, M. Fanfoni, R. Larciprete, M. Mangiantini, S. Priori, and P. Perfetti, Surface Science 313, 379 (1994).
- Aiura et al. (2002) Y. Aiura, I. Hase, H. Bando, T. Yasue, T. Saitoh, and D. S. Desau, Surf. Sci. 515, 61 (2002).
- King and Veal (2011) P. King and T. D. Veal, J. Phys. Cond. Matter 23, 334214 (2011).
- Oviedo and Gillan (2002) J. Oviedo and M. J. Gillan, Surf. Sci. 513, 26 (2002).
- Moser et al. (2013) S. Moser, L. Moreschini, J. Jaćimović, O. Barišić, H. Berger, A. Magrez, Y. Chang, K. Kim, A. Bostwick, E. Rotenberg, et al., Phys. Rev. Lett. 110, 196403 (2013).
- Backes et al. (2016) S. Backes, T. C. Rödel, F. Fortuna, E. Frantzeskakis, P. L. Fèvre, F. Bertran, M. Kobayashi, R. Yukawa, T. Mitsuhashi, M. Kitamura, K. Horiba, H. Kumigashira, R. Saint-Martin, A. Fouchet, B. Berini, Y. Dumont, A. J. Kim, F. Lechermann, H. O. Jeschke, M. J. Rozenberg, R. Valentí, and A. F. Santander-Syro, Phys. Rev. B 94, 241110(R) (2016).
- (61) http://chemistry-reference.com/standard%20thermodynamic%20values.pdf, accessed: 2019-06-04.
- Zhang et al. (2011) P. Zhang, P. Richard, T. Qian, Y.-M. Xu, X. Dai, and H. Ding, Rev. Sci. Instr. 82, 043712 (2011).
- (63) A fit of the bare data yields an identical energy for the band bottom but a slightly lower effective mass . In fact, the values derived from the momentum distribution curves of the raw data at the Fermi level are always smaller than the real ones because the Gaussian convolution with the experimental resolution shifts the band slightly towards .
- Peercy and Morosin (1973) P. Peercy and B. Morosin, Physical Review B 7, 2779 (1973).
- Dieguez et al. (2001) A. Dieguez, A. Romano-Rodrıguez, A. Vila, and J. Morante, Journal of Applied Physics 90, 1550 (2001).
- Sangeetha et al. (2011) P. Sangeetha, V. Sasirekha, and V. Ramakrishnan, Journal of Raman Spectroscopy 42, 1634 (2011).
- Verdi et al. (2017) C. Verdi, F. Caruso, and F. Giustino, Nature Commun. 8, 15769 (2017).