In-Flight Performance of the Advanced Radiation Detector for UAV Operations (ARDUO)Journal: Nuclear Instruments and Methods in Physics Research Section A
Abstract
Natural Resources Canada is responsible for the provision of aerial radiometric surveys in the event of a radiological or nuclear emergency in Canada. Manned aerial surveys are an essential element of the planned consequence management operation, as demonstrated by the recovery work following the 2011 Tohoku earthquake and tsunami, and their effects in Fukushima, Japan. Flying lower and slower than manned aircraft, an unmanned aerial vehicle (UAV) can provide improved spatial resolution. In particular, hot spot activity can be underestimated in manned survey results as the higher flight altitude and wider line spacing effectively average the hot spot over a larger area. Moreover, a UAV can enter an area which is too hazardous for humans, due not only to the radiological threat which is its target, but also to other anticipated hazards such as explosives, airborne chemical hazards, or open water. Natural Resources Canada has been investigating the inclusion of UAV-borne radiation survey spectrometers into its aerial survey response procedures. The Advanced Radiation Detector for UAV Operations (ARDUO) was developed to exploit the flight and lift capabilities available in the under 25 kg class of UAVs. The detector features eight 2.8 cm 2.8 cm 5.6 cm CsI(Tl) crystals arranged in a self-shielding configuration, read out with silicon photomultipliers. The signal is digitized using miniaturized custom electronics. The ARDUO is flown on a main- and tail-rotor UAV called Responder which has a 6 kg lift capacity and up to 40 minute endurance. Experiments were conducted to characterize the performance of the ARDUO and Responder UAV system in both laboratory and outdoor trials. Outdoor trials consisted of aerial surveys over sealed point sources and over a distributed source of 10 MBq/m2 of La-140. Results show how the directional response of the ARDUO can provide an indication in real time of source location to guide the UAV during flight. As well, the results show how utilization of the directional information in post-acquisition processing can result in improved spatial resolution of radiation features for both point and distributed sources.
Keywords:
unmanned aerial vehicle , gamma-ray detection , self-shielding , directional detector , aerial surveying , nuclear emergency response1 Introduction
Natural Resources Canada (NRCan) is responsible for conducting radiometric surveys in response to radiological and nuclear incidents. This requires high sensitivity systems that are easily deployable in order to detect, locate and identify radioactive materials in real time. Manned aircraft and terrestrial vehicle systems are traditionally used for nuclear emergency response surveying, and have demonstrated their importance during the Fukushima Dai-ichi Nuclear Power Plant accident International Atomic Energy Agency 2003, Sinclair et al. 2011, Sanada et al. 2014, Tanigaki et al. 2013. As the use of unmanned aerial vehicles (UAVs) becomes more common, NRCan is investigating the benefits UAVs provide to their existing radiometric systems. Flying lower and slower than manned aircraft, a UAV can provide improved spatial resolution. This is particularly beneficial in hot spot activity assessments as lower resolution surveys can underestimate count rates by averaging the hot spot over a larger area Sinclair and Fortin 2018. UAVs are also able to provide an additional level of safety for operators as they are able to collect measurements in areas containing possible radiological threats, or associated threats such as explosive or chemical hazards.
Several radiation detecting UAV systems have been built and tested Sanada and Torii 2015, Kochersberger et al. 2014, Kurvinen et al. 2005, Li et al. 2018, Pöllänen et al. 2009, MacFarlane et al. 2014. Heavier systems have larger payload capacities, but have limited use due to Canadian flight regulations. Smaller UAVs are only capable of carrying smaller radiation detectors that have fewer applications for nuclear emergency response situations. The radiation detecting UAV system designed at NRCan has been specifically optimized for performance in the under 25 kg class of UAVs set by Canadian regulations.
Using the EGSnrc Kawrakow et al. 2011a, Kawrakow et al. 2011b radiation propagation package, NRCan designed the Advanced Radiation Detector for UAV Operations (ARDUO) Sinclair et al. 2016 to have optimal sensitivity and direction reconstruction capability given the lift capacity of the ING Robotic Aviation Inc. main- and tail-rotor Responder UAV ING Robotic Aviation Inc. 2018. The ARDUO features thallium-doped cesium iodide (CsI(Tl)) scintillator detectors in a self-shielding configuration read out with silicon photomultipliers. The performance of the silicon photomultipliers had been characterized though previous research Sinclair et al. 2014. Radiation Solutions Inc. Radiation Solutions Inc. 2018 developed custom miniaturized pulse shaping and digital electronics for ARDUO and as well designed the ARDUO housing and mounts and integrated ARDUO’s direction calculation into their RadAssist data acquisition and real-time display software. Post-acquisition processing techniques use this direction information to improve source localization. This paper presents results on how the ARDUO performs in a series of laboratory tests, a small-scale point-source survey and a larger-scale distributed-source survey. Further details about this work can be found in Chen 2018.
2 Instrumentation
The ARDUO consists of eight 2.8 cm 2.8 cm 5.6 cm CsI(Tl) crystals in a self-shielding arrangement, resulting in a sensitive volume of 0.35 L. Each crystal is coupled with a silicon photomultiplier for light collection and the signal is digitized with miniaturized custom electronics. Every second, eight 1024-channel energy spectra spanning the energy range up to 3 MeV (one spectrum from each crystal) are saved and are tagged with a position from the Global Navigation Satellite System (GNSS). Each crystal in the ARDUO has a full-width-at-half-maximum energy resolution of approximately 7 % at 662 keV.
ARDUO is mounted on the Responder UAV built by ING Robotics Inc. The Responder is a main- and tail-rotor, battery-powered UAV with a lift capacity of up to 6 kg and an endurance of up to 40 minutes. This type of UAV was chosen over a fixed-wing aircraft as it is capable of vertical takeoffs and landings, and has the ability to hover. In addition, main- and tail-rotor UAVs have larger lift capactities and better stability in windy conditions when compared to similar-sized multi-rotor UAVs.
The Responder UAV and ARDUO crystal layout are shown in Figure 1.

The ARDUO is mounted below the center of mass of the Responder UAV. The crystals are arranged in a rectangular array with two layers of four crystals. A representative direction vector is shown, as well as its associated azimuth and elevation angles. The ARDUO is oriented such that the 0∘ azimuth axis is aligned with the nose of the Responder UAV.
The ARDUO and Responder UAV system is flown in a semi-autonomous mode where it follows a series of GNSS waypoints that are planned by the operator prior to flight. During flight, the Responder UAV’s PixHawk 1 autopilot logs the position and orientation of the system. The autopilot uses an extended Kalman filter with measurements from a GNSS antenna and receiver, compass, barometer and inertial measurement unit to determine its position and orientation every 0.02 seconds. The position and orientation data logged by the the autopilot are available for post-acquisition data analysis and mapping.
3 Direction Reconstruction
The direction vector pointing towards a detected radiation source is calculated using the self-shielding configuration of the crystals. The crystals with relatively higher gamma count rates will be closer to the source, while the crystals behind will have relatively lower gamma count rates due to the shielding of the front crystals. Using the relative count rates in each of the eight crystals over an energy range of 0.1 to 3.0 MeV, a direction vector in three dimensions, , is calculated according to Equations 1 to 3, where is the number of counts per second in crystal number .
| (1) |
| (2) |
| (3) |
The direction vector is calculated over this wide range of energy deposits (0.1 MeV to 3.0 MeV) to allow the direction reconstruction algorithm to produce a result for any spectrum in real time, prior to isotope identification. The direction reconstruction algorithm can also be expected to return a sensible direction result for heavily shielded isotopes or mixed radiation fields due to this wide energy window range.
After calculating the direction vector in three dimensions, the vector is comverted into spherical polar coordinates using Equations 4 and 5.
| (4) |
and,
| (5) |
The elevation angle spans from -90∘ (directly below ARDUO) to 90∘ (directly above ARDUO), and the azimuth angle spans 360∘ clockwise along the horizon from the nose direction of the UAV. These angles are shown in Figure 1b.
Incorporating the telemetry of the Responder UAV, the ARDUO control software displays the self-shielding direction vector to the operator in real time. The display is updated every second when a new radiation data point is collected. A screenshot of the real-time display is shown in Figure 2.

This display shows the counts in the current energy spectrum versus time; the one-second spectrum; a map of each data point location coloured according to the total spectrum counts; as well as the directional information. In the screenshot provided, it can be seen in the directional display that the source is located towards the right with respect to the flight direction, at an approximate -45∘ angle downwards. This corresponds well to the true locations of the sources indicated by purple stars in the map display. The operator can also use the energy spectrum information displayed in real time for isotope identification.
4 Post-Acquisition Data Analysis and Mapping
After a survey is flown, the data is processed and mapped to examine the spatial distribution of any sources contained within the survey area. Processing follows a number of distinct steps, as explained in the following subsections.
4.1 Energy Window Count Rates
A spectrum energy window from 0.1 to 3.0 MeV is used to calculate the crystal count rates per data point for the direction reconstruction process described in Section 3. The spectrum is then examined to determine the presence of any photopeaks and for isotope identification. An isotope-dependent energy window is then established around the isotope’s photopeak of interest. The ARDUO count rates in this isotope-dependent energy window are used for subsequent count-rate mapping.
4.2 Background Subtraction
Aerial surveys are generally conducted outdoors, therefore the naturally-occurring isotopes of K-40, U-238, and Th-232 could contribute a significant background signal to each measurement. This background signal can be estimated within the survey area by conducting a nearby survey where only natural sources are present; or, if available, by using previously conducted radiometric surveys for geological purposes of the area or nearby surroundings. The average background count rate is subtracted from the data.
4.3 Lag Correction
A lag correction is applied to the ARDUO radiation data time-stamps to account for the ARDUO’s motion during the one-second data accumulation time. As each data point is time-stamped at the beginning of the accumulation time, 0.5 seconds is added to each time-stamp to shift them to a midpoint time. These time-stamps are used to correlate the ARDUO radiation data with the Responder UAV’s autopilot data.
4.4 Location and Orientation
The Responder UAV’s PixHawk 1 autopilot logs its latitude, longitude, altitude above ground level, and orientation every 0.02 seconds using an extended Kalman filter and the suite of sensors listed in Section 2. This data stream is merged with the ARDUO’s radiation data stream using the lag-corrected time-stamps, thus providing each radiation measurement with a position and orientation for further analysis.
4.5 Heading Correction
As the Responder and ARDUO UAV system is flying, the flight direction makes some angle with respect to true north. The nose of the Responder, which is in-line with the ARDUO’s 0∘ azimuth angle axis, can be rotated from this flight direction due to windy conditions or during turns. These rotations are logged by the autopilot as the yaw, the orientation angle of the nose of the Responder with respect to true north. The direction vector’s azimuth angle is calculated with respect to the yaw angle of the Responder at the time the data point is collected. The direction vector’s azimuth angle with respect to the ARDUO is added to the yaw angle of the Responder at the time the data point is collected to obtain an azimuth angle with respect to true north.
The pitch and roll angles would also have an effect on the direction vectors. Inspection of the flight controller records from one survey verified that the average pitch and roll angles, including turns where the roll and pitch are more variable, were and respectively, where the uncertainty shows the root-mean-square deviation from the mean value. These small deviations of the system’s orientation from a level orientation (with the ARDUO axis pointing upward) were neglected in the analysis.
4.6 Count-Rate Map
With all preceding corrections made, the latitude and longitude from the autopilot are converted from the geographic World Geodetic System 1984 system to easting and northing coordinates from the projected Universal Transverse Mercator system in the corresponding zone of the survey. Each data point is mapped based on its location. The count rate in the isotope-dependent energy window for each data point is interpolated using the inverse distance interpolation algorithm provided by the ArcGIS software suite Esri 2018a. The interpolated map can be used to interpret the spatial distribution of the radiation in the survey area.
4.7 Direction Vector Overlay
The direction vectors are calculated using the count rates in the spectrum energy window (0.1 to 3.0 MeV) and the process described in Section 3. This energy window is used for the direction vector calculation as the partial gamma-ray energy deposits are part of the signal from the source, therefore increasing the signal to noise ratio. All preceding corrections are made plus the additional heading correction to the azimuth angle presented in Section 4.5. The direction vectors can be displayed in two-dimensions and overlaid on the count-rate map. Each direction vector is displayed as an arrow with the arrowhead at the data point location. The arrow is rotated to point in the direction of the azimuth angle with respect to true north. The length of the arrow represents the elevation angle, with shorter arrows being closer to vertical, and longer arrows being closer to horizontal. The arrow colour indicates whether the elevation angle is positive (upwards), or negative (downwards).
4.8 Direction Vector Projection
An additional processing step using the direction vectors can be done to improve on source localization. Each direction vector is projected to the ground surface, and new point is created where the vector intersects the ground. Only data points with downward elevation angles are used in this part of the analysis. An additional restriction to elevation angles less than was applied to avoid the horizon region where reconstruction of the elevation angle is poor (to be presented in Section 5.1).
A diagram illustrating this process is shown in Figure 3.

The locations of each data point at an altitude above ground level are shown by the helicopters. The direction vector is shown by the orange arrow extending from the ARDUO to the ground, shown by the blue surface. While a flat surface is shown in Figure 3, the method is extendable to terrain with topographic variations by using a digital elevation model. The direction vector’s intersection point with the ground is calculated using the Responder UAV’s orientation and position from the autopilot, and the direction vector’s azimuth and elevation angles. The kernel density function provided by ArcGIS Esri 2018b is then used to contour the spatial point density of the intersection points, where each point is weighted by the number of measured gamma-ray energy deposits. Areas with higher point densities indicate possible source locations.
As the distance between the location where the data was collected and the location where the direction vector intersects the ground is calculated, a source strength at ground level could in principle be estimated. This estimation adds additional complexity to the processing methods, especially in the case of multiple point sources, and is outside the scope of this paper.
5 Results
5.1 Laboratory Tests
To determine the the ARDUO’s direction reconstruction capabilities, a series of experiments were conducted in laboratory conditions. A calibrated 3.2 MBq point source of Cs-137 was placed at known locations around the ARDUO mounted on the Responder UAV. Locations were chosen at varying azimuth and elevation angles to cover a range of three-dimensional space. Distances from the source to the ARDUO ranged from approximately 1 m to 3 m. A subset of these locations was used for measurements without the UAV airframe present to determine its influence. A five-minute measurement was taken at each source location and split into an ensemble of 30 ten-second datasets. Background measurements, lasting fifteen minutes, were collected daily and used to remove the average background level from the ten-second data sets. The azimuth and elevation angles were then reconstructed for each data set in the ensemble following the method presented in Section 3. The mean reconstructed azimuth and elevation angles from the ensembles, and their corresponding root mean square deviation, are plotted in Figure 4.
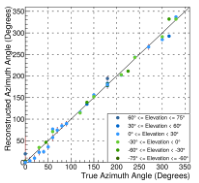
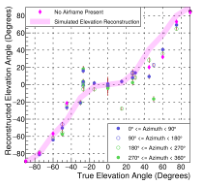
The two plots in Figure 4 show the ability of the ARDUO to reconstruct the direction vector to a 3.2 MBq source located 1 to 3 m away using ten seconds of data.
Figure 4(a) shows the reconstructed azimuth angles versus the true azimuth angle at elevation angles ranging from -75∘ to 75∘. A one-to-one line is plotted to compare the true and reconstructed azimuth angles. The reconstructed azimuth angles correspond well with the one-to-one line, indicating that the ARDUO performs well at reconstructing the azimuth angle for a range of elevation angles. Azimuth angle reconstructions for elevation angles above +75∘ and below -75∘ were not explored as the azimuthal phase space is significantly truncated and vanishing at the poles ().
Figure 4(b) shows the reconstructed elevation angles compared with the true elevation angles at azimuth angles ranging from 0∘ to 330∘. The pink diamonds are results without the Responder airframe present. The pink shaded curve represents the approximate known system response as obtained from earlier Monte Carlo design studies Sinclair 2015. Due to limitations in the geometry of the crystals and their arrangement, little elevation information is available for points at true elevation angles near the horizon. At positive (up) true elevation angles with certain azimuth angles, the airframe appears to have an effect on the elevation reconstruction. The measurement at a true elevation angle of 15∘ and true azimuth angle of 180∘ appears to be affected by the mass of the tailboom. Likewise, the measurement taken at a true elevation angle of 50∘ and a true azimuth angle of 315∘ appears to be affected by the mass of the batteries. As the elevation angle approaches vertical, the reconstructed elevation points generally lie near the known system response curve.
5.2 Two Point Sources
Following the laboratory tests, the in-flight performance of the ARDUO was examined during a small-scale survey over two 162 MBq point sources of Cs-137. The sources were arranged with approximately 27 m separation in a relatively flat survey area of approximately 100 m x 50 m. The source locations were surveyed using a Leica Geosystems model GNSS GS15 Leica Geosystems A. 2018 to an approximate accuracy of 2 cm Al-Khoubbi 2018. The nominal flight parameters for the ARDUO and Responder system were an altitude of 10 m, a speed of 2 m/s and line spacing of 4 m.
Figure 5 shows an example one-second spectrum from crystal 1 of the ARDUO when flying over the sources of Cs-137.
The energy window for the count-rate analysis is 100 keV wide (approximately three standard deviations) and centered on the 0.662 MeV photopeak. The spectra from the other seven crystals were also collected, and are similar to the example shown. A background survey of the area to determine the contribution to the gamma count rate from natural geological sources was conducted on the same day prior to source placement, with the same nominal flight parameters. The average background count rate is also shown in Fig 5, by the solid green histogram.
The flight data were processed according to the procedure described in Section 4. The two maps resulting from the survey and the post-acquisition data analysis can be seen in Figure 6.


Figure 6(a) shows the count-rate map with the overlaid direction vectors and source locations obtained following the methods presented in Section 4. A high count rate in the Cs-137 peak is shown in white and red, and a low count rate in the Cs-137 peak is shown in green. The true source locations are indicated by the pink and purple diamonds. The spatial distribution of the count rate shows an elongated anomaly extending diagonally across the survey area. The count rate contours outline the general location of the radioactive point sources, however, the result could be interpreted as indicating the presence of a distributed source, rather than two point sources.
The reconstructed direction vectors are also shown, overlaid on the count-rate contours in Figure 6(a). The location of the data point is at the head of the direction vector arrow with the length of the vector representing its elevation angle and blue arrows pointing up and black arrows pointing down. The direction vectors tend to point towards two separate locations on the map, corresponding to the two ends of the elongated anomaly identified using the count-rate contours. Some reconstructed direction vectors located between the two true source locations point away from the middle of the count-rate anomaly, and toward the two actual source locations near the ends of the anomaly. Thus, by examining the direction vectors, it can be surmised that the count-rate distribution is being caused by two separate sources. This indicates that the direction vectors are generally providing useful information, pointing in the direction of the two true source locations. Of particular benefit during real-time data acquisition, direction vectors at the closest approach to the two individual sources tend to point vertically downward.
Figure 6(b) shows the results from the direction vector projection and point density analysis. Using the altitude from the autopilot, the points of intersection of the projected downward-pointing direction vectors were calculated and are shown where they intersect the earth’s surface. The intersection points are weighted by the number of energy deposits in the window 0.1 MeV to 3.0 MeV at the measurement point to which they correspond and this weighting is indicated by the colour of the intersection point markers. The resulting blue point density contours were calculated using the algorithm described in Section 4, with higher densities represented by a darker blue colour. The point density contours show that there are two high density anomalies within the survey area. This indicates that there are two sources in the survey area. The high density anomaly locations nearly centered on the true source locations, indicated by the pink and purple diamonds. Thus, post-acquisition processing of the direction vectors improves the localization of the two sources.
5.3 Distributed Source
A large-scale distributed source survey was conducted at Defence Research and Development Canada (DRDC) in Suffield, Alberta. An unmanned ground vehicle (UGV) outfitted with an agricultural sprayer distributed an ’L’-shaped pattern of La-140 with dimensions of 120 m x 20 m for the long arm trending northeast-southwest, and 80 m x 10 m for the short arm trending northwest-southeast. The activity was intended to be approximately uniform at 10 MBq/m2 within the spray area. The survey location was relatively flat. Additional details about the experimental setup can be found in Beckman et al. 2018.
Once the La-140 was distributed, the ARDUO and Responder system flew over the source with a number of different flight parameters. The results from only one survey over the source are presented here. The nominal flight parameters for the survey were an altitude of 10 m, a speed of 10 m/s, and a line spacing of 10 m.
La-140 is an isotope with multiple gamma-ray energy emissions. A typical one-second spectrum accumulated during the flight over the source is shown in Figure 7.
The counts falling into a three standard deviation energy window 150 keV wide and centered around La-140’s highest energy photopeak at 1.596 MeV were used in the analysis. A background flight over the survey area was conducted prior to the distribution of La-140. The average background energy spectrum is overlaid on the signal spectrum in Figure 7.
Post acquisition, the data were analyzed in the same way as the point source data, following the methods presented in Section 4. The results of the post-acquisition analysis are shown in Figure 8.


Similar to the map produced for the small-scale point-source survey, Figure 8(a) shows the count-rate map with the overlaid direction vectors. The path of the UGV sprayer is shown by the red lines. This is an approximation of the ground truth for where the distributed source is located. The spatial distribution of the count rate indicates that there is a high linear anomaly trending northeast-southwest. It also shows a smaller linear anomaly trending northwest-southeast, perpendicular to the higher anomaly. The spatial distribution of the count rate is thus consistent with the known location of the sprayer path, however the count rate contours extend more broadly than the known path.
The reconstructed direction vectors are also shown in Figure 8(a) overlaid on the count-rate contours. In contrast to the small-scale point-source survey, the direction vectors point along the lengths of both linear anomalies, therefore indicating that the source of the anomalies is distributed along two linear paths. The direction vectors show good correlation to the sprayer path and indicate that the source may be more narrowly distributed than the count-rate contours suggest.
Figure 8(b) shows the intersection points with the flat earth’s surface of the projected downward-pointing direction vectors. The colour of each intersection point represents its weighting from the number of measured energy deposits in the range 0.1 MeV to 3.0 MeV. Similar to Figure 6(b), the point densities are contoured with higher point densities shown in darker blue. Again, the sprayer path is overlaid as shown by the red lines. The map shows a high point density linear area trending northeast-southwest, and a less dense linear area trending northwest-southeast. The two features appear perpendicular to each other and correlate well with the sprayer path. These features are similar to the anomalies found in the count-rate map (Figure 8(a)), but the features in the point density map have a reduced spatial extent. The area of each feature in the point density follows more closely with the extent of the sprayer path. This indicates that the direction projection processing method can improve source localization.
6 Summary and Conclusions
The ARDUO is a novel detector of gamma radiation that is mounted on a UAV. The ARDUO meaures gamma energy spectra as a function of position and also determines the direction of radioactivity using its self-shielding properties. The ARDUO and UAV system can conduct aerial radiometric surveys and display the data as well as directional information in real time, allowing for in-flight source locating. In post-processing, the directional information can be used to improve source locating. Mapping of the direction vectors appears to provide a superior ablility to distinguish multiple point sources and spatially restrict distributed sources, improving on mapping the gamma count rates alone. A point density map may be produced by projecting the data points from the UAV altitude to the ground and looking at the intersection points. The point density contours from the projected direction vectors more closely delineate the spatial distribution of the source than the simple count-rate contours. The direction vector projection method has been demonstrated by distinguishing two point sources with a 27 m separation, from an altitude approximately half this amount. The same method has also demonstrated to better constrain the spatial extent of a large distributed source.
7 Acknowledgments
This work was supported by Canada’s Centre for Security Science as a part of CSSP-2016-TI-2290. We would like to thank Defence Research and Development Canada Suffield for their collaboration on the distributed source survey. This paper is NRCan Contribution number 20180165.
References
- International Atomic Energy Agency [2003] International Atomic Energy Agency, Guidelines for Radioelement Mapping Using Gamma Ray Spectrometry Data, International Atomic Energy Agency, Vienna, 2003. IAEA-TECDOC-1363.
- Sinclair et al. [2011] L. E. Sinclair, H. C. J. Seywerd, R. Fortin, J. M. Carson, P. R. B. Saull, M. J. Coyle, R. A. Van Brabant, J. L. Buckle, S. M. Desjardins, R. M. Hall, Aerial measurement of radioxenon concentration off the west coast of vancouver island following the fukushima reactor accident, Journal of Environmental Radioactivity 102 (2011) 1018 – 1023.
- Sanada et al. [2014] Y. Sanada, T. Sugita, Y. Nishizawa, A. Kondo, T. Torii, The aerial radiation monitoring in japan after the fukushima daiichi nuclear power plant accident, Progress in Nuclear Science and Technology 4 (2014).
- Tanigaki et al. [2013] M. Tanigaki, R. Okumura, K. Takamiya, N. Sato, H. Yoshino, H. Yamana, Development of a car-borne gamma-ray survey system, kurama, Nuclear Instruments and Methods in Physics Research A 726 (2013) 162–168.
- Sinclair and Fortin [2018] L. E. Sinclair, R. Fortin, Spatial deconvolution of aerial radiometric survey and its application to the fallout from a dadiological dispersal device, accepted for publication in Journal of Environmental Radioactivity (2018).
- Sanada and Torii [2015] Y. Sanada, T. Torii, Aerial radiation monitoring around the fukushima dai-ichi nuclear power plant using an unmanned helicopter, Journal of Environmental Radioactivity 139 (2015) 294 – 299.
- Kochersberger et al. [2014] K. Kochersberger, K. Kroeger, B. Krawiec, E. Brewer, T. Weber, Post-disaster remote sensing and sampling via an autonomous helicopter, Journal of Field Robotics 31 (2014) 510–521.
- Kurvinen et al. [2005] K. Kurvinen, P. Smolander, R. Pöllänen, S. Kuukankorpi, M. Kettunen, J. Lyytinen, Design of a radiation surveillance unit for an unmanned aerial vehicle, Journal of Environmental Radioactivity 81 (2005) 1 – 10.
- Li et al. [2018] B. Li, Y. Zhu, Z. Wang, C. Li, Z.-R. Peng, L. Ge, Use of multi-rotor unmanned aerial vehicles for radioactive source search, Remote Sensing 10 (2018).
- Pöllänen et al. [2009] R. Pöllänen, H. Toivonen, K. Peräjärvi, T. Karhunen, T. Ilander, J. Lehtinen, K. Rintala, T. Katajainen, J. Niemelä, M. Juusela, Radiation surveillance using an unmanned aerial vehicle, Applied Radiation and Isotopes 67 (2009) 340 – 344.
- MacFarlane et al. [2014] J. W. MacFarlane, O. D. Payton, A. C. Keatley, G. P. T. Scott, H. Pullin, R. A. Crane, M. Smilion, I. Popescu, V. Curlea, T. B. Scott, Lightweight aerial vehicles for monitoring, assessment and mapping of radiation anomalies, Journal of Environmental Radioactivity 136 (2014) 127 – 130.
- Kawrakow et al. [2011a] I. Kawrakow, E. Mainegra-Hing, D. Rogers, F. Tessier, B. Walters, The EGSnrc code system, NRC Report PIRS-701, NRC, Ottawa (2011a).
- Kawrakow et al. [2011b] I. Kawrakow, E. Mainegra-Hing, D. Rogers, F. Tessier, B. Walters, The EGSnrc C++ class library, NRC Report PIRS-898, NRC, Ottawa (2011b).
- Sinclair et al. [2016] L. Sinclair, R. Fortin, M. Coyle, R. Van Brabant, A. McCann, Advanced Radiation Detector for Unmanned Aerial Vehicle Operations (ARDUO), IEEE Symposium on Radiation Measurements and Applications, Berkeley, California, United States (2016) 22–26.
- ING Robotic Aviation Inc. [2018] ING Robotic Aviation Inc., 2018. 1455 Youville Drive, Orléans, ON K1C 6Z7.
- Sinclair et al. [2014] L. Sinclair, P. Saull, D. Hanna, H. Seywerd, A. MacLeod, P. Boyle, Silicon photomultiplier-based compton telescope for safety and security (scotss), IEEE Transactions on Nuclear Science 61 (2014) 2745–2752.
- Radiation Solutions Inc. [2018] Radiation Solutions Inc., 2018. 5875 Whittle Rd, Mississauga, ON L4Z 2H4.
- Chen [2018] C. M. Chen, Demonstration of a new gamma spectrometer designed for radiometric surveying with an unmanned aircraft system, Master’s thesis, Carleton University, Ottawa, Ontario, Canada, 2018.
- Esri [2018a] Esri, How idw works, 2018a. URL: http://desktop.arcgis.com/en/arcmap/10.3/tools/3d-analyst-toolbox/how-idw-works.htm, accessed 28 June.
- Esri [2018b] Esri, How kernel density works, 2018b. URL: http://web.archive.org/web/20080207010024/http://www.808multimedia.com/winnt/kernel.htm, accessed 28 June.
- Sinclair [2015] L. E. Sinclair, Proposed design for directional detector for uav, December, 2015. Natural Resources Canada internal report.
- Leica Geosystems A. [2018] Leica Geosystems A., Heinrich Wild Strasse, CH-9435 Heerbrugg, St. Gallen Switzerland, 2018.
- Al-Khoubbi [2018] I. Al-Khoubbi, Private communication, 2018.
- Beckman et al. [2018] B. Beckman, A.-R. Green, L. E. Sinclair, B. Fairbrother, D. White, Radiological dispersal field trial involving unmanned air and ground systems, 2018. Manuscript in preparation.