Possible detection of a new cyclotron feature in 4U 1700-372015Possible detection of a new cyclotron feature in 4U 1700-37–Possible detection of a new cyclotron feature in 4U 1700-37
Abstract
We present a spectral and timing study of the High Mass X-ray Binary transient source 4U 1700-37 using NuSTAR and ASTROSAT/LAXPC. The source is observed in two different flux states. A combined spectral analysis of NuSTAR’s FPMA and FPMB shows the possible hint of a cyclotron line feature at 16 keV. The line feature is consistently present in different continuum models with at least 3 confidence level. We do not detect the presence of a previously reported 39 keV cyclotron line in the combined spectra. A 16 keV cyclotron feature would suggest that the compact object is a neutron star with a magnetic field strength 1012 Gauss in the emission region. We also find the presence of a rare Ni emission line around 7.6 keV in the NuSTAR spectrum. We searched the NuSTAR and ASTROSAT data for coherent or quasi-periodic oscillation signals but found no evidence in the frequency range 0.1 mHz to 103 Hz.
Keywords:
binaries: eclipsing-stars: individual: 4U 1700-37: cyclotron line: magnetic field1 Introduction
The X-ray source 4U 1700-37 was first detected by the Uhuru satellite in 1970 December (Jones & Liller 1973). This High Mass X-ray Binary (HMXB) has an orbital period of 3.41 days. The extreme 07 f star HD 153919 is a confirmed optical counterpart (Penny et al. 1973; Hutchings et al. 1973; Dolan et al. 1980), of which an orbital eccentricity of 0.220.04 and a radial velocity semi-amplitude of 20.61.0 km s-1 have been measured (Hammerschlag-Hensberge et al. 2003). The binary parameters of the 4U 1700-37 System are tabulated in Seifina et al. 2016 and Islam & Paul 2016.
One of the primary diagnostics of the presence of a neutron star (NS) in an X-ray binary system is the detection of pulsation. A persistent, approximately sinusoidal modulation of 60% amplitude, and 97 min periodicity was reported from the source 4U 1700-37 (Matilsky et al. 1978). Kruszewski 1978 further examined the optical data of HD 153919 and found a similar 97 min periodicity in 0.44-0.59 binary orbital phase. Another 96.8-min periodicity was reported by Matilsky et al. 1978 but later Hammerschlag-Hensberge et al. 1979 showed that it was caused by instrumental effects . The 96.8 min periodicity was also rejected by Dolan et al. 1980 studying OSO 8 data above 20 keV. Murakami et al. 1984 detected a 67.4s periodicity with a 4 percent modulation of the X-ray flux during a single 20-min flare, observed by the X-ray satellite Tenma. Gottwald et al. 1986 reported the absence of any coherent periodicity over the frequency range to 256 Hz. Similarly, no periodicity was found in the timescales of 32 ms to 2 hr from EXOSAT observations (Doll & Brinkmann 1987). Brown et al. 1996 suggested that the source may be a black hole candidate based on the absence of pulsations and the presence of a hard X-ray tail in the spectrum. The power density spectrum (PDS) of the source was reported to show a 6.5 mHz QPO (Boroson et al. 2003) with a fractional root mean square (rms) amplitude of 4.5 before the eclipse. Recently, Jaisawal & Naik 2015a strongly suggested the absence of any coherent periodicity, and reported a 20 mHz QPO from SUZAKU HXD/PIN data.
The source 4U 1700-37 is known to be a wind fed accreting HMXB system (Haberl et al. 1989). The stellar wind absorbs the low energy X-ray photons by photoelectric absorption which is found to be orbital phase dependent. Haberl et al. 1989 studied the variation of the X-ray absorption in different orbital phases, using a continuous observation of 3.2 days by the EXOSAT satellite. They observed a sharp increase in absorption near phase 0.6 to eclipse ingress and a decrease in absorption from phase 0.5 to eclipse egress. The hydrogen column density () is found to vary between 11022 and 451022 cm-2 during this 3.2 day-long observation. Kaper et al. 1994 studied the optical lines in the spectra of optical counterparts of Vela X-1 and 4U 1700-37. They found an increment in blue-shifted absorption before and during the transit of the compact object through the line of sight towards the companion star. They argued that the observed obscuration or eclipse of the companion star in Vela X-1 could not be explained by an accretion wake surrounding the compact object or a gas stream resulting from tidal forces. They attributed the absorption seen in the spectrum to a photo-ionization wake trailing the X-ray source. Changes in the geometry of the photo-ionization wake could account for the orbit wise variation of the absorption feature.
Another clear diagnostic for the presence of a NS in an X-ray binary system is a cyclotron line. Cyclotron lines, also called cyclotron resonant scattering features (CRSFs) are absorption features in the X-ray spectrum of highly magnetized neutron stars with teragauss magnetic field (). The cyclotron line energy () allows a direct measurement of the magnetic field strength in X-ray Pulsars,
Where is the magnetic field in the unit of Gauss and is the gravitional redshift from the line formation region near the NS. Till now, nearly 36 sources are known to exhibit CRSF in their x-ray spectrum (Staubert et al. 2019). In a few cases, multiple absorption features have also been observed and identified as harmonics (e.g. 4U 0115+63: Heindl et al. 1999, Cep X-4: Jaisawal & Naik 2015b). But in several sources, e.g., 4U 1538-52 (Rodes-Roca et al. 2009), Vela X-1 (Kreykenbohm et al. 2002), departures from an integral line ratio have been observed. Most of the observed line features are consistent with a simple Gaussian shape, primarily due to the limited spectral resolution of the observing instruments. In very few cases, asymmetric or distorted line profiles have also been observed, like Cep X-4; (Fürst et al. 2015). The CRSF line energy is also found to vary with spin phase (e.g. Vela X-1; Maitra & Paul 2013a, A 0535+26; Maitra & Paul 2013b, GX 301-2: Kreykenbohm et al. 2004). In a few sources, dependence of the CRSF on X-ray luminosity has also been observed (4U 0115+63 Nakajima et al. 2006; A0535+262 Terada et al. 2006) . The correlation is found to be either positive (e.g. Her X-1: Staubert et al. 2007; GX 304-1: Yamamoto et al. 2011; Cep X-4: Fürst et al. 2015) or negative (e.g. V 0332+53; Doroshenko et al. 2017). Long term variation of the energy of the cyclotron line has also been observed in two sources, namely Her X-1 (Ji et al. 2019; Staubert et al. 2017), and Vela X-1 (Fürst et al. 2014; Ji et al. 2019). Reynolds et al. 1999 observed the first broad-band spectrum of 4U 1700-37 in the energy range 0.5-200 keV using BeppoSAX. The spectrum was well described by an absorbed powerlaw with a cutoff, typical of X-ray binary pulsars. The spectrum showed a soft bremsstrahlung component at 2 keV. They suggested the possibility of a cyclotron line at 37 keV, which was a direct evidence for the compact object being a NS. Jaisawal & Naik 2015a further endorsed the findings of Reynolds et al. 1999 with a detection of a broad (width 19 keV) cyclotron line like feature at 39 keV in the broadband spectrum derived from a SUZAKU observation of September 13-14, 2006. This detection implied a surface magnetic field 3.41012 Gauss of the neutron star. In a recent work, Seifina et al. 2016 described the source spectrum with a more physical model, and found no evidence of any cyclotron line near 40 keV in the BeppoSAX and SUZAKU Data. They studied the high-soft state spectral evolution of the source by modelling the spectra with two comptonization components. They observed that the componized spectral components are similar to those previously found in NS systems and concluded that source 4U 1700-37 is a NS binary system.
This paper is structured as follows: introduction in section 1 is followed by a description of observations and data analysis in section 2. In section 3, we discuss the results derived from timing and spectral analysis. All the errors are reported in this paper with 90 confidence level.
2 observations and data analysis
In our analysis, we have used two archived data sets. The first is a 40 ks NuSTAR observation (Obs Id: 30101027002, PI. Felix Fuerst)11 1 https://heasarc.nasa.gov/cgi-bin/W3Browse/w3browse.pl obtained on 1st March 2016. The second dataset is from an ASTROSAT LAXPC observation carried out on 16th Aug 2017 (Obs Id:9000001464, PI: Gaurava K. Jaisawal)22 2 https://astrobrowse.issdc.gov.in/astro_archive/archive/Home.jsp.
| Instrument | Obs Date | MJD | Stare time | Orb. Phase |
|---|---|---|---|---|
| NuSTAR | 01/03/2016 | 57448 | 73.08 ks | 0.55-0.80 |
| ASTROSAT (LAXPC) | 16/08/2017 | 57981 | 131.80 ks | 0.35-0.75 |
NuSTAR consists of two identical Focal Plane Modules, A and B (FPMA and FPMB, respectively) (Harrison et al. 2013). We have extracted data separately from both the modules. We have used nupipeline version 0.4.6 distributed with HEASOFT33 3 https://heasarc.gsfc.nasa.gov/docs/software/heasoft/ v6.25, and calibration files 20181030, to create clean event files. We observe that the SNR (signal to noise ratio) at 3–79 keV increases with the radius of the source region, and levels off beyond 90 arc–second. The 40–79 keV SNR is found to increase with radius and reach a maximum at 90", beyond which it starts to decrease. So, we have selected the source region as a 90" circle around the brightest point and the background is obtained from a same size region away from the source. We have then used nuproducts to create the spectra and light-curves.
ASTROSAT is the first Indian multi-wavelength space observatory consisting of five principal scientific payloads (Agrawal 2006). ASTROSAT can observe in different energy ranges: visible (320-530 nm), near Ultra Violet (NUV: 180-300 nm), far UV (FUV: 130-180 nm), soft X-rays (Soft X-ray imaging Telescope (SXT): 0.3-8.0 keV), Scanning Sky Monitors ( SSM: 2.0-10.0 keV) and hard X-rays (Large Area X-ray Proportional Counters (LAXPC): 3-80 keV, Cadmium-Zinc-Telluride Imager (CZTI: 20-150 keV).
We have used publicly available LAXPC data for the timing analysis of the source. The standard available software LAXPCsoftware (Format (A)) from ASTROSAT Science Support Cell (ASSC44 4 http://astrosat-ssc.iucaa.in/) has been used to create the event-file, good time intervals (GTI) file, light-curves, and background light-curves. The GTI is further adjusted to remove unusual high or low counts before generating the final lightcurve.

| Photon Index | ||||||||
| - | KeV | eV | - | KeV | keV | - | - | |
| 78.51/88 |
2.1 Timing analysis
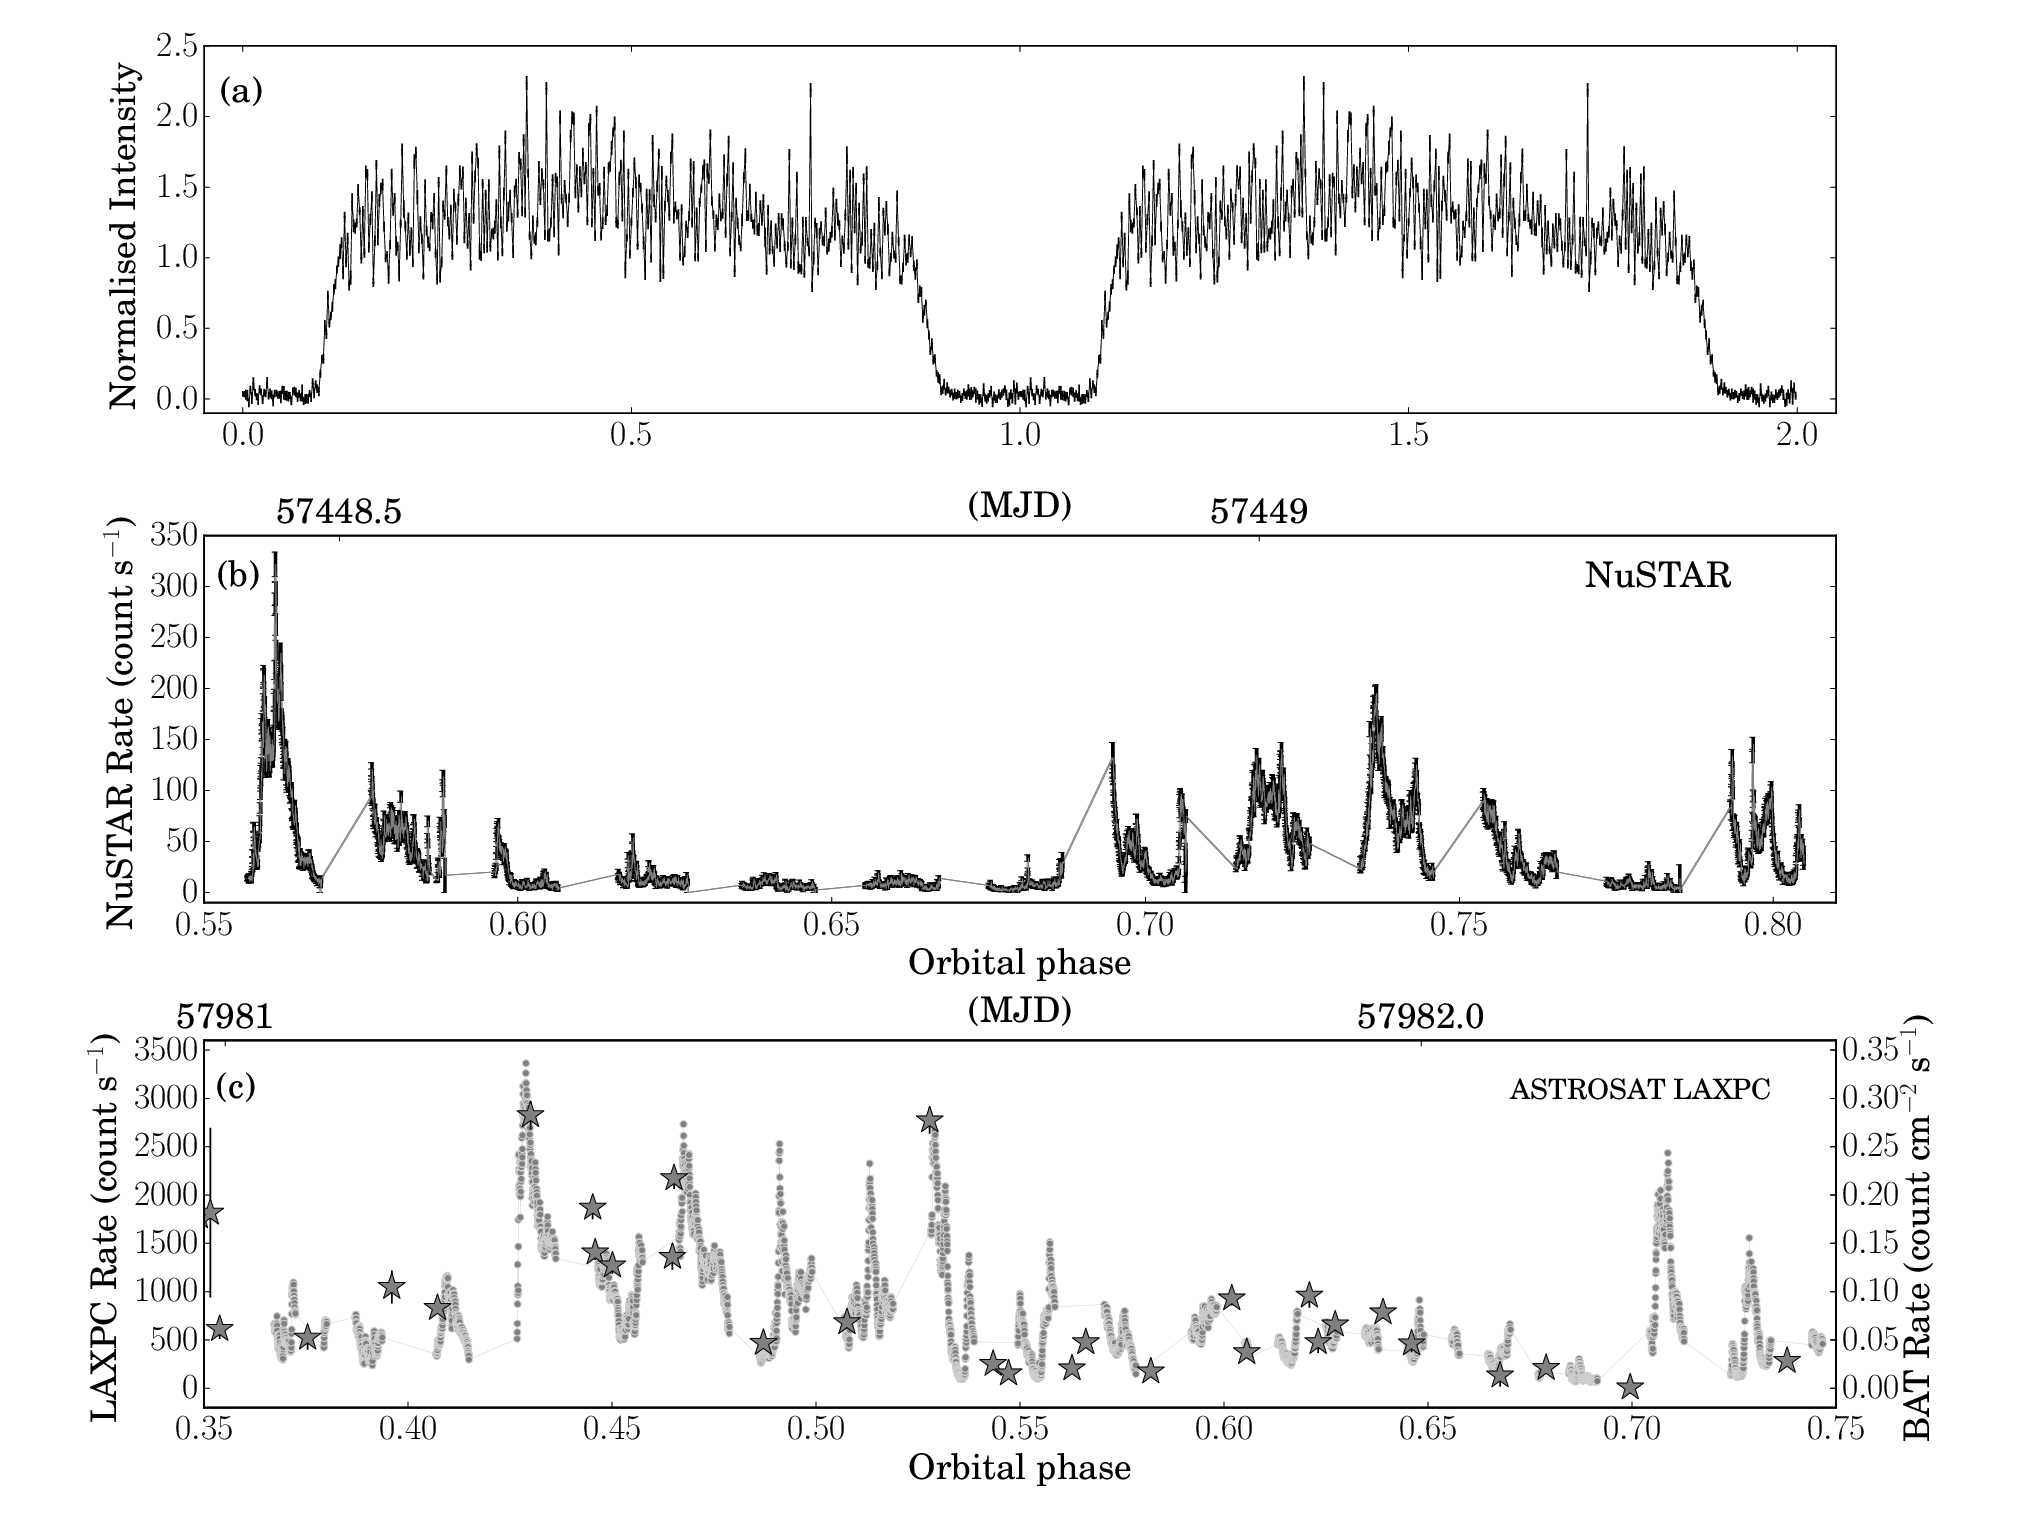
We have used 131180s of stare time of AstroSat observation of 4U 1700-37 to achieve 48.62 ks effective exposure for our analysis. LAXPC has an excellent resolution of 10 s, which is unique when combined with a large effective area of 6500 cm2 (Agrawal et al. 2017; Antia et al. 2017; Roy et al. 2016) in probing coherent or quasi periodicity. Visible gaps in the 15-50 keV LAXPC light curve pertain to source occultation and south atlantic anomaly (SAA) passages (Figure 1(c)). From the figure we can also see that the LAXPC and BAT light-curves follow a similar trend. A combined light-curve of LAXPC10 and LAXPC20, with 1s bin size has been generated using laxpc_make_lightcurve module of LAXPCsoftware.
To look for previously reported periodicity from the source with the LAXPC data, the lightcurve has been extracted from all layers and for 3.0-80.0 keV energy range. The source had been observed in a bright state with a total count rate of 1043.70.15 in the 3-80 keV band (flux , as computed using the flux command after the spectral fitting of LAXPC data in XSPEC). The PDS have been generated from the combined 1s binned lightcurve using the ftool powspec of HEASOFT. The light curve was segmented into stretches of 4096 bins per interval. Individual PDS of these intervals were averaged to obtain a final PDS which is shown in the bottom panel of Figure 2. To subtract the Poissonian noise, the PDS were normalized such that their integral gives the squared rms fractional variability normalized to units of (rms/mean)2 Hz-1. Further, to investigate periodicity/quasi-periodicity in 1-1000 Hz range, a combined light curve binned at 0.5 ms was obtained from LAXPC 10 and 20. This light curve was segmented in stretches of 2048 bins. White noise subtracted PDS were then generated from individual segments and averaged to obtain the final PDS. There is no detection of coherent pulsation or quasi-periodicity in the range 1-1000 Hz from the LAXPC data.
Following the same procedure as above we have generated a PDS from a 1s binned combined lightcurve of FPMA and FPMB, for the energy range 3.0-79.0 keV (top panel, Figure 2). To combine the FPMA and FPMB light-curves, we have used the ftool fmerge. The source is comparatively less bright during the NuSTAR observation. In 3.0-79.0 keV energy range the source count rate is found to be 71.30.07 counts/s.
We have observed that the PDS obtained from the 1s binned LAXPC lightcurve can be described by the sum of a powerlaw and a zero centred Lorentzian model. We have ignored two spikes in the data points corresponding to frequencies 0.027 and 0.065 Hz to obtain a reduced of 1.15 (= 64.82/56). The PDS of NuSTAR is well described with a powerlaw model and the reduced is found to be 1.19 (=72.80/61). We do not find the presence of any coherent pulsation or significant quasi-periodicity in the source. We also failed to detect the previously reported QPOs at 6.5 mHz (Reynolds et al. 1999) and 20 mHz (Jaisawal & Naik 2015a), in either the ASTROSAT or the NuSTAR data.
We have evaluated the orbital phases during these observations in the following manner. The BAT all sky monitor (ASM) lightcurve between 57000-58500 MJD has been barycenter corrected using the earth2sun package available in HEASOFT. Using the ftool efsearch on it, the orbital period is found to be s (3.411627 days), which is consistent with the result published earlier (Islam & Paul 2016). For NuSTAR and XRT data barycorr has been used to apply the barycentric correction and for LAXPC data the standard ASTROSAT tool as1bary has been used for the same. We compute orbital phases using the above period and a reference epoch of MJD 57446.55. A resulting folded light-curve is shown in Figure 1(a).

2.2 Spectral Analysis
We have done a combined fit of NuSTAR’s FPMA and FPMB data using the well known X-ray spectral fitting software XSPEC (V 12.10.1). We have binned the data following the standard binning condition, i.e having a minimum 30 counts per bin and taking into account the instrument resolution (i.e bin size equal to 1/3 of FWHM) by combining 2, 3, 5, 8, 16, 18, 30, 45, 76 channels for energies above 3, 10, 15, 20, 35, 45, 55, 64 and 70 keV respectively. This follows the prescription of Fürst et al. 2018 upto 45 keV, and as we have more photons at higher energies, we have followed the standard condition above 45 keV.
The continuum of HMXBs is usually fitted with various empirical models like high energy cutoff powerlaw (White et al. 1983), Fermi Dirac cutoff powerlaw (FDCUT; Tanaka 1986), NewHCUT (a third order polynomial function with continuous derivatives; Burderi et al. 2000), negative positive cutoff powerlaw or NPEX (Makishima et al. 1999). Some physical models like Thermal Comptonization model (CompTT; Titarchuk 1994), Thermal and bulk Comptonization of a seed blackbody-like spectrum (COMPTB; Farinelli et al. 2008), thermal and bulk Comptonization for cylindrical accretion (COMPMAG; Farinelli et al. 2012) have occasionally been used to describe the continuum. We have applied some of these models to describe the spectrum of 4U 1700-37. We have added a partial absorption TBpcf to describe the low energy part of the spectra. To describe a cyclotron feature we used a Gaussian absorption line model gabs.
To adjust factors related to cross-instrument calibration uncertainties, we have used a multiplicative model constant (cons) inbuilt in XSPEC along with the other models. This value of the constant is frozen at 1.0 for FPMA. For FPMB we have kept the parameter to be free. For all fits, the relative cross-instrument factors or the constant values for FPMB, are found to be nearly 1.03.
2.2.1 Probing emission lines of 4U 1700-37 using NuSTAR, SUZAKU and XMM-Newton
NuSTAR: In the NuSTAR spectrum we find the presence of an iron
Kα emission line at keV and
another emission line at keV with a large
width 0.2 keV. The effect of these on the high energy continuum model or the cyclotron features is negligible. Nonetheless, we have studied these emission lines by fitting the NuSTAR data in the energy
range 5.0-9.0 keV, with a powerlaw with an
absorption TBabs and two Gaussian emission
(gauss) lines
[cons*TBabs*(powerlaw+gauss+gauss)]. The best fit
parameter values are given in Table 2.
While fitting the complete spectra in the 5-75.0 keV band,
whenever we are unable to constrain the low energy
emission lines, we have fixed the line parameters to the
value quoted above.
Previously a Gaussian line at 6.5 keV was reported by (Reynolds et al. 1999 from a BeppoSAX observation.
XMM-Newton: Earlier An XMM-Newton observation showed a prominent fluorescence Fe K line at 6.4 keV, accompanied by the detection of a second K line at a slightly higher energy 6.7 keV and a K line at 7.1 keV (van der Meer et al. 2005).
We have analyzed the XMM-Newton observation (obs Id 0083280401; MJD 51960.74) of the source during the eclipse phase of Figure 1 of van der Meer et al. 2005. Among the XMM Newton detectors, namely three European photon imaging camera (EPIC); MOS1, MOS2, pn, and one Reflection Grating Spectrometer (RGS), only EPIC-MOS2 has observed the source in timing mode. Science Analysis Software (SAS), version 18.0, and the latest calibration files (as available on April 1, 2019) are used for the data reduction. The SAS task emproc has been used to generate a calibrated event file. The energy range of 0.3-10 keV is used as an energy filter55 5 http://xmm2.esac.esa.int/docs/documents/CAL-TN-0018.pdf. During this observation, XMM-Newton Epic-MOS2 data is free from pile up issues. The source region is selected as a circular region of radius 800 physical coordinates centred on the source, and the background spectrum is extracted from an annulus of width 200 physical coordinates surrounding the circular source extraction region. The spectrum of the source and the background regions are generated using SAS task evselect. The Redistribution Matrix File (RMF) and The Ancillary Response File (ARF) are created by using the SAS tasks rmfgen and arfgen respectively. Grouping of the spectra is done by the SAS task specgroup. The minimum count per group is set to 25, and the minimum energy width of each group is set to 3.
It has been
found that along with the previously reported emission lines (van der Meer
et al. 2005) a Gaussian
emission line at 7.5 keV, improves the fit of the 0.3-10.0 keV XMM-Newton spectrum. The is found to
be 660/605 without including the 7.5 keV line, and 653.3/602 after
including the line. The line is found with more than 2
confidence level, having a energy keV and width
0.17 keV. As the detection level was less than
3, the presence of the line could not be claimed from the
XMM-Newton observation.
SUZAKU: The iron lines at 6.7 keV and 7.1 keV were also found in a SUZAKU observation (Jaisawal & Naik 2015a), . We have analysed publicly available SUZAKU data (processing date 27th May 2016) of 4U 1700-37, observed on 2006 September 13-14 (Obs ID: 401058010). The observation was performed in "XIS nominal" position with an effective exposure of 81 ks for XIS. The HEASOFT software package (version 6.26) and the calibration database (CALDB) released on 2015 October 05 (for XIS) are used for the data analysis. Unfiltered event files were processed by using aepipeline package of FTOOLS, along with standard screening criteria, to create cleaned XIS event files. Following Jaisawal & Naik 2015a, the photon pile-up for XIS data has been corrected by taking an annulus region with inner and outer radii of and respectively from the source position. Source spectra are extracted from the reprocessed XIS event data by selecting the above annulus region in XSELECT. Background spectra are generated by selecting circular regions away from the source. The response and effective area files for all the XIS detectors were generated by using the task xisrmfgen and xissimarfgen respectively.
To probe the low energy emission lines we have combined all the XIS spectra by using the ftool addascaspec as recommended by the XIS team66 6 https://heasarc.gsfc.nasa.gov/docs/suzaku/analysis/abc/node9.html. This also combine all rmf, arf and background spectrum files of different XIS units. We have used the combined spectra, background, rmf and arf to look for the presence of low energy emission lines. Following Jaisawal & Naik 2015a the combined spectra is binned by a factor of 6 from 0.8 to 10 keV. We find that in XIS spectra the inclusion of a 7.5 keV Gaussian line along with the previous reported lines in Jaisawal & Naik 2015a, improves the fit ( = 445/365 without the line, and = 411.8/362 with the line). In the combined XIS spectra the 7.5 keV line has been detected with more than 5 confidence level. The estimated line energy is keV and the width 0.06 keV.
2.2.2 Probing cyclotron absorption features in 4U 1700-37 with NuSTAR
We have used 3.0–75.0 keV NuSTAR data to probe any cyclotron line feature. To describe the continuum of 4U 1700-37 we have applied the NPEX model [cons*TBpcf*(powerlaw*npex+gaus+gaus)], following the previous work of Jaisawal & Naik 2015a. The NPEX model has been created by adding two cutoffpl models with their cutoff energies tied to each other and keeping the photon index of one to be frozen at -2.0. For the best fit, the is found to be 577.64/475. The fit shows some residuals in the overall spectrum. We added a Gaussian absorption model around 39 keV (following the previous work of Jaisawal & Naik 2015a), but the best fit gives the line energy as keV with =487.32/472. The width and the depth of the line are found to be keV and respectively. The chance probability of the line has been computed using the ftest task in XSPEC. The F-test with this absorption line gives an F value = 29.2 and a chance probability of . If we add another Gaussian absorption line at 38.9 keV ( Energy value frozen) the best fit is found to be 486.8/470. This indicates that the second absorption line is not required for the fit. If we use only one Gaussian absorption line and freeze the line energy at 38.9 keV then the width and the depth of the line are found to be keV and respectively with a = 549.2/473. The ftest gives a chance probability of the 38.9 keV line to be . So, with NPEX model we find two valid model combinations of the data. One, the presence of a Gaussian absorption line at 15 keV, two, the presence of a Gaussian absorption line at 38.9 keV. But, the presence of both lines together is not supported by the data. The 10.0-70.0 keV flux of the source is found to be , much lower than the value ( , previously reported from SUZAKU data (Jaisawal & Naik 2015a).
We have observed that the 16 keV absorption line structure found with the NPEX model is not smooth but has a double peak. So, we added another absorption component having energy

keV and it marginally improves the fit (=). The width and depth of this second line is found to be keV and respectively. Although the overall continuum is not affected after including the second absorption line, the parameters of the first absorption line get slightly modified. The energy, width, and depth of the modified first line are found to be keV, keV and respectively. All the best fit parameters are given in Table 4. The ftest gives the chance probability of the second line as .
We have observed similar kind of residuals around 15.0-17.0 keV after fitting the continuum with a NewHCUT model.The model cons*TBpcf(newhcut*powerlaw*gabs+gaus+gaus) gives the is to be . With this continuum, if we include a 38.9 keV absorption line, the depth is found to be very low and almost no change occurs in value. If we freeze the width at the previous published value of 9.8 keV (Jaisawal & Naik 2015a), then the upper limit to the depth is found to be 0.11 (=531.45/474). The fit is found to improve significantly (= ) when we allow the line energy to be free and the line energy is found to be = keV. The best fit parameter values are given in Table 3. In this case also the absorption line is found to have a double peak and the inclusion of a second line improves the fit (table–4).
To check the consistency of the absorption lines, we have also applied the HCUT model. The model cons*TBpcf*(powerlaw*hcut+gaus+gaus) also gives an acceptable fit (=516.65/475) but has some residuals around 15.0–17.0 keV. Modelling the residuals with gabs gives a wide absorption line. The reason could be the sharp feature produced by the HCUT model at the cutoff energy (Kretschmar et al. 1997; Kreykenbohm et al. 1999). In general practice a Gaussian optical-depth profile is added to smooth the transition between the pure power law components and the cutoff power law (Coburn et al. 2002; Fuerst et al. 2013). To implement this, we add a gabs component tied to the cutoff energy keV. The width and depth of this gabs is found to be keV and respectively. As the cutoff energy is close to the Ni line energy, we have kept the energy and the width of the Ni line frozen to the values mentioned in table 2. This gives the best fit (=) cyclotron line energy to be keV having width and depth keV and respectively. With this continuum if we fix the energy of absorption line to 38.9 keV, then the best fit (=516.64/470) gives the depth to be very low. If we keep the width to be frozen to the value 7.3 keV (Jaisawal & Naik 2015a), then the upper limit to the depth of the line is found to be 0.12.
In this case also, the 16 keV absorption line is found to have a double peak, and the inclusion of another Gaussian absorption line at keV slightly improves the fit ( = ). The width and the depth of the second line are found to be = keV and = respectively (Table-4).
We then use a physical model COMPMAG to describe the continuum of the spectrum. This model assumes a cylindrical polar cap accretion on the NS due to the presence of the magnetic field. In this model, it is considered that soft photons with temperature are upscattered by the in-falling plasma having a temperature . This model gives the best fit when we set the betaflag to 2.0 which makes the model independent of the parameters and . In this case, we are not able to compute the lower limit of the width of the 7.6 keV emission line. So we mention the upper limits. We get an acceptable fit with the model cons*TBpcf*(compmag+gaus+gaus) (=).
When we add a gabs around 38.9 keV, it does not improve the fit, and its depth and width could not be computed simultaneously. On the other hand, if we include one Gaussian absorption component at keV, the fit improves a little (=). The width and the depth of the line are found to be keV and
| Parameter | NPEX | NPEX | NewHCUT | NewHCUT | COMPMAG | COMPMAG | HighECut | HighECut |
| - | - | |||||||
| (keV) | - | - | - | - | ||||
| (keV) | - | - | ||||||
| (keV) | - | - | - | - | - | - | ||
| (keV) | - | - | - | - | - | - | ||
| - | - | - | - | - | - | |||
| - | - | - | - | - | - | |||
| - | - | - | - | - | - | |||
| - | - | - | - | - | - | |||
| (keV) | - | - | - | - | ||||
| (keV) | - | - | - | - | ||||
| - | - | - | - | |||||
| - | - | - | - | |||||
| - | - | - | - | |||||
| (keV) | ||||||||
| (keV) | ||||||||
| (keV) | ||||||||
| (keV) | ||||||||
respectively. With this continuum model, we have not noticed any distortion in the absorption line. We find the soft photon temperature 1.32 keV and the plasma temperature 3.88 keV. The albedo is found to be 0.6, which is consistent with a reflection from the neutron star surface (0<<1). The parameter is found to be nearly 0.23 ( 0.8 km) which is considered to be the radius of the accretion column, in units of NS Schwarzschild radius. The distance of the source (1.9 kpc) and the normalisation constant give the soft photon source radius to be 1.9 km.
We have also conducted a combined fitting of ASTROSAT SXT, LAXPC and CZTI spectrum. The uncertainties in LAXPC response and the poor SNR of the source spectrum in LAXPC and CZTI, do not allow us to probe the presence of a cyclotron line using ASTROSAT data.
| Parameter | NPEX | NewHCUT | HCUT |
|---|---|---|---|
| Photon Index | |||
| (keV) | - | ||
| (keV) | |||
| (keV) | |||
| (keV) | |||
| (keV) | |||
| (keV) | |||
| (keV) | |||
| (keV) | |||
| (keV) | |||
| (keV) | |||
3 Discussion and conclusions
The source 4U 1700-37 is one of the HMXB pulsar candidates where the X-ray pulsations remain unconfirmed. The debate persists since the discovery of the source regarding the existence of a 97 min or 50s or 67.4s coherent periodicity. In this work, we have used high-resolution LAXPC data during the orbital phase 0.35-0.75. The source was bright during in this orbital phase with an observed flux of . With the 3.0-80.0 keV LAXPC lightcurve, we have not found any sign of coherent or quasi-periodic oscillation in the PDS in the frequency range from 0.1 mHz to 103 Hz. A NuSTAR observation of this source had been carried out spanning the orbital phase 0.55 to 0.80. During this phase the source was at a lower flux ( ) state. The PDS of the NuSTAR observation was devoid of any coherent pulsation or QPO in the 3.0-79.0 keV energy range. The pulsation in X-ray pulsars originates due to a misalignment between the spin axis and the magnetic axis, causing the X-ray emitting hot spot to rotate in and out of the line of sight. The lack of observed pulsations in high magnetic field pulsars (1012 Gauss) is possible if the angle between the magnetic axis and the rotational axis of the pulsar is small.
In our spectral analysis of the NuSTAR data we find the presence of an emission line at 7.56 keV which has never been reported in this source. We detect this feature at more than 7 confidence. The line is identified as a rare Ni line which has occasionally been reported in X-ray sources such as IGR J16318-4848 (galactic X-ray binary) (Walter et al. 2003), and in some AGNs (Pounds & Page 2005). In a wind fed accretion powered X-ray pulsar, having neutral Ni in abundance, the stellar wind can ionize and result in the formation of a Ni K (7.5 keV) emission line (Reynolds 1998). Walter et al. 2003 suggested that the X-ray spectrum of an accreting high mass X-ray binary like IGR J16318-4848 features strong photo-electric absorption due to stellar wind. This leads to the detection of the Ni K (7.5 keV) line.
We have found that the continuum can be described by the empirical models NPEX, NewHCUT, HCUT and also by a physical model COMPMAG. We find the absorbing column density to the source to be high, 201022 cm-2. This is consistent with the earlier studies of the source as mentioned in section 1. With the empirical continuum models we find strong residuals around 15-16 keV (, which can be modelled with a Gaussian absorption line and this improves the fit significantly. All reported lines with the empirical models are at least significant and the maximum chance probability of the line is found to be 2.27 (HCUT model). It has also been observed that the line shape deviates from a simple Gaussian profile. We found a marginal improvement in chi-square value after including another absorption line with an energy 11 keV (). For all three empirical models the parameters of both the lines are found to be consistent. On the other hand if we describe the continuum with a COMPMAG model, we find some residual around 17.0 keV. Including a Gaussian absorption line improves the fit. The second cyclotron line could not be discerned with this continuum model. It has also been noticed that with the COMPMAG model it is difficult to constrain the width of weak features like the 7.6 keV emission line.
It has also been found that with different continuum models, a Gaussian absorption line at 38.9 keV previously reported from this source (Jaisawal & Naik 2015a), does not improve the fit significantly. Apart from NPEX none of these models allow us to compute the width and the depth of the 38.9 keV line. So, with this data, we do not find any significant hint of the presence of a line at 38.9 keV. We have computed the upper limit to the line using the previously reported width (Jaisawal & Naik 2015a). One of the possible reasons for not finding the 38.9 keV line could be the difference in the flux state between these two observations. The source flux during the SUZAKU observation was nearly twice that during the NuSTAR observation. Another possibility could be that the previously reported line was an artifact of an inadequately modeled continuum. Jaisawal & Naik 2015a used the NPEX continuum and concluded that the cyclotron line feature has a huge width (19 keV), which is difficult to justify with any physical model. It has also been shown by Müller et al. 2013 that the NPEX model sometimes results in very broad cyclotron lines and line parameters cannot be blindly trusted. The first reported cyclotron line by Reynolds et al. 1999 was around 37 keV. They too have suggested that the feature may arise due to incorrect modeling of the continuum or a purely instrumental effect.
If the 16 keV cyclotron line is true, then it suggests that the magnetic field strength of the line forming region is nearly Gauss. If the line is distorted and consists of two absorption profiles having energies around 11 keV and 16 keV, then the actual magnetic field strength may be around Gauss. The presence of the 16 keV line along with the 11 keV residual could be described as a distorted line like that in Cep X-4 (Fürst et al. 2015) or it may consist of two lines with anharmonic ratio. The ratio between the line energies in this case is 1.45, too small to be claimed as harmonics. In other sources, deviations from exact integral ratio have been observed, but the deviation is found to be much smaller (e.g., 4U 0115+63 Heindl et al. 1999). Cep X-4 (Fürst et al. 2015) is the only source where the line energy ratio is nearly 1.56. Two CRSFs of such different energies may indicate a strong deviation from a simple dipole magnetic field, as might be expected due to the formation of an accretion mound (Mukherjee & Bhattacharya 2012). The formation of accretion mound causes a redistribution of the magnetic field inside the accretion mound. The central field lines are dragged towards the edge, to balance the gravitational pressure of the mound by the magnetic field pressure. This reduces or keeps unaffected (depending on the mound profile) the magnetic field intensity at the center of the mound While the magnetic field intensity towards the edge of the mound increases. The integrated emission from different parts of the mound causes broadening and asymmetry in the observed cyclotron line profile. An asymmetric line profile may also arise from simultaneous viewing of different parts of an accretion column with different field strengths. If the magnetic field intensity is not symmetric with respect to the column axis, the phase averaged cyclotron line will have an asymmetric shape, due to different magnetic field intensities in different phases. Deviations from a smooth cyclotron line could also be attributed to the presence of strong emission wings, which is predicted from simulations (Schönherr et al. 2007).
Our spectral study of 4U 1700-37 with NuSTAR finds the presence of a rare 7.6 keV Ni K line, which is being reported for first time in this source. Our study also finds the hint of a previously unreported cyclotron feature around 16 keV. In certain continuum models, this line feature deviates in shape from a simple Gaussian, suggesting the presence of a complex magnetic field structure. However this cannot yet be conclusively established. Our timing study with ASTROSAT and NuSTAR show no evidence of any periodic or quasi-periodic oscillation. Further observations at different flux states of the source would be important for a more detailed exploration of its spectral and temporal properties.
Acknowledgements
S. Bala and J. Roy want to thank Prof. Ranjeev Mishra and Prof. Gulab Chand Dewangan and Kabir Chakravarti for their useful suggestions and discussions. Authors would like to thank the annonymous referee for valuable comments and suggestion which improved the manuscript substantially. The research work is funded by the University Grants Commission (UGC) and the Indian Space Research Organisation (ISRO). The authors want to thank Inter University Center for Astronomy and Astrophysics (IUCAA) for the research facilities. This work made use of data from the NuSTAR mission, a project led by the California Institute of Technology, managed by the Jet Propulsion Laboratory, and funded by the National Aeronautics and Space Administration. This research has made use of the NuSTAR Data Analysis Software (NuSTARDAS) jointly developed by the ASI Science Data Center (ASDC, Italy) and the California Institute of Technology (USA). This publication uses the data from the AstroSat mission of the Indian Space Research Organisation (ISRO), archived at the Indian Space Science DataCentre (ISSDC). This work has used the data from the LAXPC developed at TIFR, Mumbai, and the LAXPC POC at TIFR is thanked for verifying and releasing the data via the ISSDC data archive and providing the necessary software tools. This research has made use of data, software and/or web tools obtained from the High Energy Astrophysics Science Archive Research Center (HEASARC), a service of the Astrophysics Science Division at NASA/GSFC and of the Smithsonian Astrophysical Observatory’s High Energy Astrophysics Division. We want to thank the instrument teams of SUZAKU and XMM-Newton.
References
- Agrawal (2006) Agrawal P. C., 2006, Advances in Space Research, 38, 2989
- Agrawal et al. (2017) Agrawal P. C., et al., 2017, Journal of Astrophysics and Astronomy, 38, 30
- Antia et al. (2017) Antia H. M., et al., 2017, ApJS, 231, 10
- Boroson et al. (2003) Boroson B., Vrtilek S. D., Kallman T., Corcoran M., 2003, ApJ, 592, 516
- Brown et al. (1996) Brown G. E., Weingartner J. C., Wijers R. A. M. J., 1996, ApJ, 463, 297
- Burderi et al. (2000) Burderi L., Di Salvo T., Robba N. R., La Barbera A., Guainazzi M., 2000, ApJ, 530, 429
- Coburn et al. (2002) Coburn W., Heindl W. A., Rothschild R. E., Gruber D. E., Kreykenbohm I., Wilms J., Kretschmar P., Staubert R., 2002, ApJ, 580, 394
- Dolan et al. (1980) Dolan J. F., Coe M. J., Crannell C. J., Dennis B. R., Frost K. J., Maurer G. S., Orwig L. E., 1980, ApJ, 238, 238
- Doll & Brinkmann (1987) Doll H., Brinkmann W., 1987, A&A, 173, 86
- Doroshenko et al. (2017) Doroshenko V., Tsygankov S. S., Mushtukov A. A., Lutovinov A. A., Santangelo A., Suleimanov V. F., Poutanen J., 2017, MNRAS, 466, 2143
- Farinelli et al. (2008) Farinelli R., Titarchuk L., Paizis A., Frontera F., 2008, ApJ, 680, 602
- Farinelli et al. (2012) Farinelli R., Ceccobello C., Romano P., Titarchuk L., 2012, A&A, 538, A67
- Fuerst et al. (2013) Fuerst F., et al., 2013, preprint, (arXiv:1309.5361)
- Fürst et al. (2014) Fürst F., et al., 2014, ApJ, 780, 133
- Fürst et al. (2015) Fürst F., et al., 2015, ApJ, 806, L24
- Fürst et al. (2018) Fürst F., et al., 2018, Astronomy and Astrophysics, 620, A153
- Gottwald et al. (1986) Gottwald M., White N. E., Stella L., 1986, MNRAS, 222, 21P
- Haberl et al. (1989) Haberl F., White N. E., Kallman T. R., 1989, ApJ, 343, 409
- Hammerschlag-Hensberge et al. (1979) Hammerschlag-Hensberge G., Henrichs H. F., Shaham J., 1979, ApJ, 228, L75
- Hammerschlag-Hensberge et al. (2003) Hammerschlag-Hensberge G., van Kerkwijk M. H., Kaper L., 2003, A&A, 407, 685
- Harrison et al. (2013) Harrison F. A., et al., 2013, ApJ, 770, 103
- Heindl et al. (1999) Heindl W. A., Coburn W., Gruber D. E., Pelling M. R., Rothschild R. E., Wilms J., Pottschmidt K., Staubert R., 1999, ApJ, 521, L49
- Hutchings et al. (1973) Hutchings J. B., Thackeray A. D., Webster B. L., Andrews P. J., 1973, MNRAS, 163, 13P
- Islam & Paul (2016) Islam N., Paul B., 2016, MNRAS, 461, 816
- Jaisawal & Naik (2015a) Jaisawal G. K., Naik S., 2015a, MNRAS, 448, 620
- Jaisawal & Naik (2015b) Jaisawal G. K., Naik S., 2015b, MNRAS, 453, L21
- Ji et al. (2019) Ji L., Staubert R., Ducci L., Santangelo A., Zhang S., Chang Z., 2019, MNRAS, 484, 3797
- Jones & Liller (1973) Jones C., Liller W., 1973, ApJ, 184, L65
- Kaper et al. (1994) Kaper L., Hammerschlag-Hensberge G., Zuiderwijk E. J., 1994, A&A, 289, 846
- Kretschmar et al. (1997) Kretschmar P., et al., 1997, in Winkler C., Courvoisier T. J.-L., Durouchoux P., eds, ESA Special Publication Vol. 382, The Transparent Universe. p. 141
- Kreykenbohm et al. (1999) Kreykenbohm I., Kretschmar P., Wilms J., Staubert R., Kendziorra E., Gruber D. E., Heindl W. A., Rothschild R. E., 1999, A&A, 341, 141
- Kreykenbohm et al. (2002) Kreykenbohm I., Coburn W., Wilms J., Kretschmar P., Staubert R., Heindl W. A., Rothschild R. E., 2002, A&A, 395, 129
- Kreykenbohm et al. (2004) Kreykenbohm I., Wilms J., Coburn W., Kuster M., Rothschild R. E., Heindl W. A., Kretschmar P., Staubert R., 2004, A&A, 427, 975
- Kruszewski (1978) Kruszewski A., 1978, Information Bulletin on Variable Stars, 1424, 1
- Maitra & Paul (2013a) Maitra C., Paul B., 2013a, ApJ, 763, 79
- Maitra & Paul (2013b) Maitra C., Paul B., 2013b, ApJ, 771, 96
- Makishima et al. (1999) Makishima K., Mihara T., Nagase F., Tanaka Y., 1999, ApJ, 525, 978
- Matilsky et al. (1978) Matilsky T., LaSala J., Jessen J., 1978, ApJ, 224, L119
- Mukherjee & Bhattacharya (2012) Mukherjee D., Bhattacharya D., 2012, MNRAS, 420, 720
- Müller et al. (2013) Müller S., et al., 2013, A&A, 551, A6
- Murakami et al. (1984) Murakami T., Kawai N., Makishima K., Mitani K., Hayakawa S., Nagase F., Tawara Y., Kunieda H., 1984, PASJ, 36, 691
- Nakajima et al. (2006) Nakajima M., Mihara T., Makishima K., Niko H., 2006, Advances in Space Research, 38, 2756
- Penny et al. (1973) Penny A. J., Olowin R. P., Penfold J. E., Warren P. R., 1973, MNRAS, 163, 7P
- Pounds & Page (2005) Pounds K. A., Page K. L., 2005, MNRAS, 360, 1123
- Reynolds (1998) Reynolds C. S., 1998.
- Reynolds et al. (1999) Reynolds A. P., Owens A., Kaper L., Parmar A. N., Segreto A., 1999, A&A, 349, 873
- Rodes-Roca et al. (2009) Rodes-Roca J. J., Torrejón J. M., Kreykenbohm I., Martínez Núñez S., Camero-Arranz A., Bernabéu G., 2009, A&A, 508, 395
- Roy et al. (2016) Roy J., et al., 2016, Experimental Astronomy, 42, 249
- Schönherr et al. (2007) Schönherr G., Wilms J., Kretschmar P., Kreykenbohm I., Santangelo A., Rothschild R. E., Coburn W., Staubert R., 2007, A&A, 472, 353
- Seifina et al. (2016) Seifina E., Titarchuk L., Shaposhnikov N., 2016, ApJ, 821, 23
- Staubert et al. (2007) Staubert R., et al., 2007, in The Obscured Universe. Proceedings of the VI INTEGRAL Workshop. p. 465
- Staubert et al. (2017) Staubert R., Klochkov D., Fürst F., Wilms J., Rothschild R. E., Harrison F., 2017, A&A, 606, L13
- Staubert et al. (2019) Staubert R., et al., 2019, A&A, 622, A61
- Tanaka (1986) Tanaka Y., 1986, Observations of Compact X-Ray Sources. p. 198, doi:10.1007/3-540-16764-1_12
- Terada et al. (2006) Terada Y., et al., 2006, ApJ, 648, L139
- Titarchuk (1994) Titarchuk L., 1994, ApJ, 434, 570
- Walter et al. (2003) Walter R., et al., 2003, A&A, 411, L427
- White et al. (1983) White N. E., Swank J. H., Holt S. S., 1983, ApJ, 270, 711
- Yamamoto et al. (2011) Yamamoto T., Sugizaki M., Mihara T., Nakajima M., Yamaoka K., Matsuoka M., Morii M., Makishima K., 2011, PASJ, 63, S751
- van der Meer et al. (2005) van der Meer A., Kaper L., di Salvo T., Méndez M., van der Klis M., Barr P., Trams N. R., 2005, A&A, 432, 999