Pressure-Induced Antiferromagnetic Dome in the Heavy-Fermion Yb2Pd2In1-xSnx System
Abstract
In the heavy-fermion system Yb2Pd2In1-xSnx, the interplay of crystal-field splitting, Kondo effect, and Ruderman-Kittel-Kasuya-Yosida interactions leads to complex chemical-, pressure-, and magnetic-field phase diagrams, still to be explored in full detail. By using a series of techniques, we show that even modest changes of parameters other than temperature are sufficient to induce multiple quantum-critical transitions in this highly susceptible heavy-fermion family. In particular, we show that, above kbar, hydrostatic pressure not only induces an antiferromagnetic phase at low temperature, but it likely leads to a reorientation of the Yb magnetic moments and/or the competition among different antiferromagnetic configurations.
I Introduction
Yb-based intermetallic compounds represent one of the most interesting
classes of materials for investigating the interplay of crystal-field
splitting, Kondo effect, and Ruderman-Kittel-Kasuya-Yosida (RKKY) interactions.
Given their comparable energy scales, it is not surprising that the
resulting ground state can easily be tuned via external pressure, chemical substitution, or
applied magnetic fields Gegenwart et al. 2002; Gegenwart et al. 2008.
Within the larger class of heavy-fermion (HF) compounds, Yb-based materials
are among the best examples of quantum critical systems showing a
non-Fermi liquid behavior. This is due to
the manifest sensitivity of the Yb2+ electronic configuration to chemical- and external pressure.
Thus, an increase in pressure “squeezes” one of the Yb -electrons out of its shell, driving the non magnetic Yb2+ (, )
to magnetic Yb3+ (, , ).
As a consequence, the Kondo effect is weakened, while the RKKY-mediated exchange
interactions among the Yb ions are enhanced, a favorable condition for the onset of a
long-range magnetically ordered phase Bauer et al. 2004; Bauer et al. 2005; Bauer et al. 2010; Muramatsu et al. 2011; Yamaoka et al. 2017.
This is precisely the case of Yb2Pd2In1-xSnx, previously investigated via
macroscopic techniques and lately studied also via SR, at both ambient- and high-pressure conditions,
in the stoichiometric case Muramatsu et al. 2011. While, in general, there is consensus
with regard to
the broad picture, key details are still missing. In particular, the
joint effects of chemical- and applied pressure, as well as the resulting phase diagrams and the type of magnetic order remain largely unexplored to date.
Here, by combining a range of experimental techniques, including magnetic susceptibility, muon-spin
rotation (SR), x-ray, and neutron diffraction, we map out
the temperature-, pressure-, and composition phase diagram of this prototypical HF system.
In particular, we show that externally applied pressure reinforces the effects of
chemical pressure (here achieved via In/Sn substitution),
by extending the magnetically ordered dome and by reordering the Yb magnetic moments into a new antiferromagnetic phase, whose critical temperature reaches 4.9 K at 23.4 kbar at the optimum doping.
Numerical calculations and symmetry considerations proved essential in clarifying the new magnetic structure adopted at high pressure.
II Crystal structure, x-ray diffraction and dc-magnetization
A series of Yb2Pd2In1-xSnx polycrystalline samples with nominal compositions , 0.3, 0.6, 0.8 were prepared from stoichiometric amounts of pure elements by high-frequency melting of the constituent materials in a closed tantalum crucible. A subsequent one-week heat treatment at 1250 K was used to ensure chemical homogeneity. All the compounds of this series crystallize in the tetragonal space group, where Yb occupies the sites. Systematic x-ray diffraction and dc magnetization measurements performed on all the samples confirmed the absence of spurious phases (within the sensitivity of the respective techniques Rx). Samples were further investigated via high-pressure synchrotron x-ray diffraction at the Elettra source and neutron powder diffraction at the Institute Laue-Langevin. The detailed results of the above measurements are reported in the Apps. A–C and in Ref. Martinelli et al. 2019.

III SR measurements
The muon-spin relaxation measurements under hydrostatic-pressure conditions in the 0–25 kbar range, from 0.25 to 10 K, were carried out at the General Purpose Decay-Channel (GPD) spectrometer of the SS muon source of the Paul Scherrer Institut (Villigen, Switzerland). The external pressure was applied by using a double-wall piston-cylinder pressure cell made of MP35N alloy. Daphne oil 7373 was used as a pressure-transmitting medium to achieve nearly hydrostatic conditions across the whole pressure range Khasanov et al. 2016; Shermadini et al. 2017. To determine the exact pressure at low temperature, a small piece of indium was placed next to the sample. The pressure-dependent shift of its superconducting transition was determined via ac susceptometry Khasanov et al. 2016; Shermadini et al. 2017.


Due to the small mass of In, its contribution to the SR background is negligible.
Figures 1 and 2 show the time-dependent, zero-field (ZF) muon-spin depolarization at short-time for all the samples under test at representative temperatures and applied pressures. As a general feature, highly-damped coherent oscillations are seen to develop upon increasing the Sn content or the applied pressure, thus providing key evidence about the onset of a long-range magnetic order with a large degree of inhomogeneity. To determine the parameters of these coherent precessions and to disentangle the spurious contribution of the pressure cell to the total signal, the time-dependent muon-spin depolarization was fitted by using the model:
| (1) |
Here is the high-temperature value of the initial asymmetry, whereas accounts for the fraction of incoming muons stopped outside the sample. Regarding this last parameter, three cases can be distinguished: i) is almost zero during the reference experiments performed at the low-background spectrometer Dolly (samples with and 0.6); ii) coincides with the muon fraction implanted in the Ag sample holder during the experiments on sample at Low Temperature Facility (LTF) at the SµS, PSI. In this case we assume , with both and being determined at the lowest temperature and kept fixed during subsequent fits bac. iii) During the GPD measurements, accounts for the fraction of muons implanted in the pressure cell TF_. In this case, represents a Gaussian Kubo-Toyabe function multiplied by an exponential damping Khasanov et al. 2016; ZF_.
The coherent muon precession in the magnetically-ordered phase is described by the function, while the and terms account for a possible damping. Here reflects the static distribution of local magnetic fields, whereas describes the dynamical relaxation processes. is the magnetic field at the -th muon implantation site and MHz/T is the muon gyromagnetic ratio; and refer to muons probing local magnetic fields in the transverse (T) or longitudinal (L) direction with respect to the initial muon-spin polarization. The sum over generalizes Eq. (1) to the case of diverse inequivalent crystallographic implantation sites, whose population weights satisfy the normalization condition . In the following, we specify the above parameters in the context of each case.

(a)
 (b)
(b)
 (c)
(c)
 (d)
(d)
 (e)
(e)
 (f)
(f)
.
Figure 1 shows the short-time zero-field (ZF) SR depolarization for the pure In case. The polarization can be fitted by a single Gaussian decay at both standard- and applied-pressure conditions, provided the temperature is not very low. This type of decay is normally associated with randomly-oriented nuclear dipolar fields. However, when (at 25 kbar) the temperature is lowered to 0.25 K, a small transverse component appears, indicating that 15% of the sample develops weak magnetic correlations. Such behavior suggests that Yb2Pd2In is on the verge of quantum criticality, with a magnetic phase transition presumably occurring at higher pressure.
.
The low-background ambient-pressure data taken at K [Fig. 2(a), top panel] are well fitted by a single Gaussian depolarization, reflecting the randomly oriented nuclear dipolar fields. At the lowest temperature a small depolarization appears, suggesting that also in this case, at ambient pressure the system is likely at the verge of a magnetic instability. Interestingly, by progressively increasing the pressure (to 12.3 and 23.4 kbar) a strongly damped oscillation appears at 0.25 K. In this case, the fitting function describing the sample contribution consists of two transverse components, one of which is a damped Gaussian cosine cos and the other is represented by a Gaussian decay. The corresponding longitudinal components can be merged into a single Lorentzian decay. It is worth noting that the frequency of the oscillating part increases rapidly with increasing pressure, suggesting the proximity to a pressure-induced magnetic order.
.
As shown in Fig. 2 (top panel), the low background data taken at ambient pressure and K are well fitted by one transverse component, consisting of a damped Gaussian cosine cos and a single Lorentzian decay. This differs from the case where, at ambient pressure, a weakly decaying Gaussian function is sufficient to describe the data. The previous two-component fitting function was successfully adopted also for the measurements under pressure [Fig. 2(b), lower panels]. Here, too, a sudden increase of muon-precession frequency with increasing pressure occurs.
.
At ambient pressure, the low background data taken at K, i.e., above , [Fig. 2, top panel]
are well fitted by a single Gaussian depolarization, reflecting the randomly oriented nuclear dipolar moments. At the lowest temperature, the damped oscillation could be fitted by two transverse components, of which one is a damped Gaussian cosine term cos and the other is a Gaussian decay. The two longitudinal signals, again merged into one, are fitted by a single Lorentzian exponential. Upon applying pressure, the same fitting function was adopted [Fig. 2, lower panels]. Also in this case, the frequency of the oscillating component increases rapidly with increasing pressure.
Panels 3(a)-(c) show the evolution of the oscillating component of the local field as a function of temperature for all the applied pressures. Generally, in all cases, we note a steep increase of the internal magnetic field. In particular, for , the internal field shows a fivefold enhancement from its ambient-pressure value.

Figure 4 summarizes the evolution of the local-field widths for both transverse components at the lowest temperature as a function of applied pressure. We note a remarkable broadening of both widths at the muon implantation sites upon increasing pressure.
The magnetic volume fraction in the ordered phase was determined in two different ways. In case of ambient pressure experiments, it was extracted from the total longitudinal component by means of Shiroka et al. 2011; Asy. In case of applied pressure, the magnetic volume fraction was estimated from the temperature evolution of the oscillating paramagnetic fraction in a weak transverse field (wTF) SR experiment ( mT). The evolution of the magnetic volume fraction with the applied pressure is shown in Fig. 3(d)-(f) for all those cases where a magnetically ordered phase could be detected.
We note two important features: i) the transition widths remain rather narrow, never exceeding 1 K, irrespective of the applied pressure; ii) the magnetic ordering temperature increases steeply with applied pressure. For instance, in the optimally substituted sample, at 23 kbar reaches twice its ambient-pressure value. In the explored pressure range increases almost linearly with pressure. The differential increment (slope) is maximal for (ca. 0.15 K/kbar), then it gradually decreases, to saturate at K/kbar at higher tin content. Such values are remarkably high for a heavy-fermion compound (compared, for instance, with 0.016 K/kbar for CeNiSiHx Isnard et al. 2016).
The datasets shown in Fig. 3 allow us to build the full
-- and -- phase diagrams, as shown in Fig. 5. Some interesting features can be highlighted: i) For , at K and kbar the system is already on the verge of quantum
criticality, as almost 15% of the sample develops weak magnetic
correlations, suggesting that a possible phase transition might occur at higher pressures.
ii) For , at K and ambient pressure the system
is again at the verge of a magnetic instability, with only a small
volume fraction developing magnetic correlations. Upon increasing pressure,
a long-range magnetic order appears, with transition temperatures and local magnetic
fields reaching 3.8 K and 40 mT, respectively, at 24.6 kbar.
iii) In the (optimally doped) and cases a long-range magnetic order is already present at ambient pressure
and K. At the highest applied pressure the magnetic
ordering temperature almost doubles and the internal field shows
a fivefold increase from its ambient-pressure value. iv) Upon increasing pressure, we observe a remarkable broadening of the field width at each muon implantation site. v) For , previous experiments
have shown that a magnetically
ordered phase appears only for pressures above 10 kbar Muramatsu et al. 2011.

(a)
 (b)
(b)
In summarizing this section we conclude that: (a) below , all the tested compounds order magnetically over the whole sample volume, (b) the magnetic transition widths remain narrow even at the highest applied pressures, while increases steeply with pressure; (c) the internal field increases steeply above a critical pressure kbar. This is accompanied by a progressive broadening of the field widths.
| Magnetic structure a | ||||||
|---|---|---|---|---|---|---|
| Label | Magnetic group | Yb1 | Yb2 | Yb3 | Yb4 | [mT] (s.d.) |
| I | (, , 0) | (, , 0) | (, , 0) | (, , 0) | 6.18 (1.91) | |
| II | (, , 0) | (, , 0) | (, , 0) | (, , 0) | 3.79 (1.66) | |
| III | (0, 0, ) | (0, 0, ) | (0, 0, ) | (0, 0, ) | 3.58 (1.76) | |
| IV | (0, 0, ) | (0, 0, ) | (0, 0, ) | (0, 0, ) | 245.22 (4.95) | |
| V | (, , 0) | (, , 0) | (, , 0) | (, , 0) | 4.66 (1.68) | |
| VI | (,, 0) | (, , 0) | (, , 0) | (, , 0) | 6.87 (1.89) | |
| VII | (0, 0, 0) | (0, 0, 0) | (0, 0, ) | ( 0, 0,) | 2.25 (1.21) | |
| VIII c | (, , 0) | (, , 0) | (,, 0) | (, , 0) | 122.61 (4.53) | |
| IX | (0, 0, ) | (0, 0, ) | (0, 0, ) | (0, 0, ) | 3.03 (1.25) | |
| X c | (, , 0) | (, , 0) | (, , 0) | (, , 0) | 100.17 (4.54) | |
- a
Dipolar field at the muon position (0.5, 0.5, 0.5) for . The In/Sn substitution-induced displacements on the Yb ions were considered. The values in parenthesis labeled (s.d.) represent the standard deviation considering different random displacements.
- b
Yb1, Yb2, Yb3, Yb4 at (0.1724, 0.6724, ), (0.8276, 0.3276, ), (0.3276, 0.1724, ), (0.6724, 0.8276, ); .
- c
In these cases was considered.
IV DFT and dipolar field calculations
Density functional theory (DFT) based calculations have proven highly successful in locating the muon implantation sites in several materials Möller et al. 2013; Bernardini et al. 2013; Bonfà et al. 2015; Bonfà and De Renzi 2016; Cheung et al. 2018. Based on this, we performed structural relaxations by DFT to determine the muon stopping sites and, thus, get a better understanding of the evolution of with applied pressure and as a function of In/Sn substitution. Here, we consider the representative cases of and .
To determine the muon implantation sites we used (0.45, 0.45, 0.54) as a starting position, since it corresponds to the minimum of the electrostatic potential in Yb2Pd2Sn (see Apps. D and E). The final muon site resulting from structural relaxations, (0.459, 0.484, 0.50), is close to that obtained from the electrostatic potential minima, but has a higher site symmetry ( instead of ). Notably, we find 4 symmetry-equivalent sites that are only 0.6 Å apart from each other. At first approximation, we therefore assume the muon to occupy a delocalized region, spread over these equivalent closely-spaced sites. This implies the need to consider muon delocalization in the subsequent local dipolar-field calculations in the following form: . This procedure yields similar results to those where the muon is located at the centroid (0.5, 0.5, 0.5) position (of the four equivalent sites). To simplify the description, we report the results for this second case.
It is worth noting that, despite the presence of two transverse-field components in the and 0.8 samples (suggesting two non equivalent muon sites), DFT calculations predict only one muon implantation site. Such apparent inconsistency could be resolved by considering the disorder induced by either the In/Sn substitution or by applied pressure. Thus, at low temperatures, the whole sample could be pictured as an ensemble of nanometric size domains with either long- or short-range magnetic order. Such effect becomes increasingly relevant with increasing pressure, as suggested by the considerable rise in the local field width (see Fig. 4). Magnetic frustration, expected to increase with increasing pressure, may further reinforce such effects. In this context, in the limit of even higher pressures, Yb2Pd2In1-xSnx could be at the verge of a transition towards a nonmagnetic phase of a so-called “valence bond solid” (VBS), as already proposed in Ref. Bernhard et al. 2011 to explain the vanishing of the AF phase above 40 kbar in the case Muramatsu et al. 2011.
We evaluate the dipolar field at the muon site (due to Yb magnetic moments) by making the following assumptions: i) is predominantly of dipolar origin. ii) the applied hydrostatic pressure, when lower than (see App. A), distorts negligibly the atomic surrounding in the crystallographic unit cell. Thus, neither the muon implantation site(s), nor the propagation vector change significantly with pressure. iii) The ordered Yb magnetic moment is set to 1 , independently of the tin content and the applied pressure. This strong assumption is reasonably verified at ambient pressure, where the Yb magnetic moment does not vary by more than 40% (as deduced from neutron scattering measurements Bauer et al. 2010 at different In/Sn substitutions). Very recent neutron powder diffraction measurements as a function of pressure (up to 14 kbar) on an sample also show only an increase of 11% of the ordered magnetic moment (App. C). Since the dipolar field contribution at the muon implantation site is linear with the ordered magnetic moment, the above tiny variations cannot justify the tenfold increase of reported in Fig. 3. Therefore, we can reasonably assume that the Yb magnetic moment is almost constant, at least up to .
Given the propagation vector Bauer et al. 2010; Martinelli et al. 2019,
the MAXMAGN code on the Bilbao crystallographic
server Bilbao Crystallogr. Server; Perez-Mato et al. 2015 identifies ten maximal magnetic space groups for the parent space group (No. 127), allowing a nonzero field
on Yb. These are labeled I to X and reported in Tab. 1
together with the corresponding magnetic structures on the Yb atoms.
For all these magnetic structures the dipole sum was calculated
using a supercell.
In a perfect stoichiometric crystal, all the structures except
IV, VIII, and X have zero dipolar fields by symmetry.
However, Sn/In substitutions induce small in-plane displacements of the Yb atoms and of the muon position. The extent of
these displacements was reproduced
through several random realizations of the concentration.
The small dipolar field that arises as a consequence of the
Yb displacements was evaluated by averaging on a set of 32 interstitial
positions. This leads to local fields ranging from 3 to 10 mT in
those structures where the field would otherwise have been zero by symmetry.
The full set of results for the ten magnetic structures, obtained
after averaging on the lattice realizations, is summarized
in Tab. 1. The additional averaging over the four
equivalent muon sites has a negligible effect. Yet, for completeness, we report it in App. E.
Notably, the calculated dipolar field for the magnetic structure suggested by neutron scattering at ambient pressure [structure VI,
observed for –0.9] Bauer et al. 2010; Martinelli et al. 2019
is found to be about 7 mT. This field value agrees well with those
sensed by muons in the Sn/In substituted samples at ambient-pressure,
hence justifying our original omission of the contact-field contribution.
At the same time, the above result suggests
that the Yb magnetic moments cannot remain in the magnetic structure VI also at high pressures, where
the measured internal field is four-to-ten times the expected one. For the same reason, none of the magnetic structures I–III, V, VII, and IX can describe the Yb ordering observed at high pressure for
, 0.6, and 0.8, since in all these cases the calculated dipolar fields range from 3 to 7 mT.
Out of the ten long-range orders considered here, only three
justify the drastic increase of local field at the muon site for . These include the magnetic structures IV, VIII, and X, marked in bold in Tab. 1 and shown in Fig. 6.
However, since also a contact hyperfine component may be present, we refrain from making direct comparisons between the measured and calculated local field.
To summarize, our results strongly suggests a reordering of the Yb magnetic moments at high pressures, above . The above-mentioned recent low-temperature neutron and room temperature synchrotron
diffraction data (see Ref. Martinelli et al. 2019 and Apps. A and C), both collected under applied pressure,
suggest no changes in the magnetic and crystalline structure up to . However, above a structural transition does take place.
Consequently, we considered also the supposed high-pressure
monoclinic structure (App. D).
In this case, four irreducible representations allow for a non-zero magnetic moment on the Yb ion.
If the Yb moments are constrained to lie
either along or in the plane, with ,
the local field at the muon site does not change appreciably with
respect to the values identified for the tetragonal low-pressure
structure. This implies that the structural transition at does not appreciably change the calculations of the internal field done for the ten models deduced for the tetragonal symmetry summarized in Tab. 1.
At the same time neutron powder diffraction in the case revealed a stable magnetic structure up to 14 kbar, suggesting that a pressure-induced magnetic phase transition — if any — could take place only at very high pressures, beyond the instrument limits. At intermediate pressure values, we expect the effects of the different competing AF-ordered phases, to correspond to the magnetic structures IV, VIII, and X mentioned above. These competing orders could result in magnetic frustration and, hence, significantly enhance the local field width at high pressure. At the same time, all these magnetic structures are compatible with the large increase of magnetic field observed above [see Fig. 5(b)].
(a) Struc. IV (b) Struc. VI


(c) Struc. VIII (d) Struc. X


V Discussion
The ground-state electronic properties of heavy-fermion compounds are determined by a subtle interplay between the RKKY and Kondo interactions, whose characteristic temperature (energy) scales are and , with , a coupling parameter. Here , where represents the overlap between the wave functions of and conduction electrons, while is the excitation energy between the magnetic and non-magnetic electronic configurations Muramatsu et al. 2011. In most Yb systems, valence fluctuations and the reduced size of Yb ions rule out significant changes of up to 25 kbar Muramatsu et al. 2011. Consequently, in the considered pressure range, the coupling strength is determined almost entirely by the excitation energy .
At the boundaries of the -- phase diagram, i.e., at low hydrostatic pressures in the pure In or Sn case (i.e., for or 1), the excitation energy is expected to assume its minimum value, which maximizes Muramatsu et al. 2011. In turn, this is reflected in values up to 20–30 K, resulting in a nonmagnetic ground state with non-Fermi-liquid properties, as confirmed by our SR measurements (see Fig. 5). In this case, our Yb-based Kondo-lattice system is found in the Kondo screening region of the Doniach phase diagram Doniach 1977.
The application of hydrostatic- or chemical pressure implies a reduction of the unit cell volume Bauer et al. 2005. Moderate hydrostatic pressure has negligible effects on the Yb3+ valence, as confirmed by x-ray absorption spectroscopy in the partial fluorescence yield mode (PFY-XAS) and by resonant x-ray emission spectroscopy (RXES) under applied pressure Yamaoka et al. 2017. Also the In/Sn substitution, (chemical pressure), does not distinctly affect valence, since dc susceptibility measurements indicate almost constant Yb magnetic moments in the paramagnetic state, independent of tin concentration (App. B). In this region of the phase diagram, an increase of pressure induces a growth of resistivity Bauer et al. 2004; Bauer et al. 2005, corresponding to a reduced - electron coupling and to an increased excitation energy . Both of them stabilize the antiferromagnetic phase Muramatsu et al. 2011, clearly suggesting that pressure (either hydrostatic or chemical) shifts a Kondo-lattice system towards the RKKY interaction regime in the Doniach phase diagram Doniach 1977.
As shown in Fig. 5(a), the antiferromagnetic phase covers a wide area of the -- phase diagram. At ambient pressure it spans only the range. However, upon increasing pressure, the AF region extends to cover the full range, albeit with a slightly asymmetric distribution of temperatures. Thus, for , the system is at the verge of a magnetic transition at a pressure of 25 kbar, while for the AF phase has its onset at only about 10 kbar. The fine balance between chemical pressure and effective doping, here realized through the In/Sn substitution, may explain the slightly off-centered dome shape in the -- phase diagram. In addition, Mössbauer studies evidence different types of ground states in the pure In and Sn systems Muramatsu et al. 2011; Bauer et al. 2003. Off-centered features might thus result naturally.
Similar features are also found in the -- phase diagram, shown in Fig. 5(b). Interestingly, for , a marked change in the slope of the vs. plot is clearly visible at about (see continuous lines). Such pressure value coincides with that where a structural phase transition was shown to occur at ambient temperature (see Fig. 7) for any value, except for . In this case, no structural transitions could be detected (up to 100 kbar). In this case, we note also that the internal field never exceeds the values found at ambient pressure in the AF dome Giovannini 2018. Consequently, the significant increase of local magnetic field observed in the central part of the -- phase diagram cannot be ascribed to a distinct change of the Yb magnetic moment, the latter being ruled out by our dipolar-field calculations. We suggest, instead, that the steep increase in the local magnetic field is due to a reorientation of the Yb magnetic substructure and/or to magnetic frustration resulting from the competition of at least three different AF magnetic structures. Since such reordering occurs at , it is very tempting to assume that the change in magnetic structure is most likely driven by the above mentioned structural transition.
Finally, we would like to address the significant increase in with increasing pressure. To this aim it is instructive to compare the quantum critical behavior of Ce- with Yb-based systems Flouquet and Harima 2012; Braithwaite et al. 2013. Both Ce and Yb exhibit a trivalent magnetic state (Ce3+, 4 vs. Yb3+, 4), which can fluctuate to a nonmagnetic state, corresponding to an empty shell for Ce and to a filled () shell for Yb. To a first approximation, in both cases pressure leads to a delocalization of the electrons. However, while this drives Ce towards a nonmagnetic 4 state, in Yb it favors the magnetic 4 state, in an almost specular behavior, known as the mirror-like behaviour of cerium and ytterbium. This implies a reinforced magnetic order in Yb-based systems under applied pressure, as indeed observed, e.g., in YbCu2Si2 Fernandez-Pañella et al. 2011 or in YbRh2Si2 Knebel et al. 2006, and to its suppression in Ce-based systems as, e.g., in CeRh2Si2 Knebel et al. 2006 (where an initial of 35 K goes to zero in only 12 kbar).
VI CONCLUSIONS
The intriguing magnetic behavior
of Yb2Pd2In1-xSnx was studied mostly via SR spectroscopy and elucidated
by detailed DFT calculations. Both hydrostatic- and chemical
pressure (the latter through In/Sn substitution) promote
an AF coupling of Yb3+ magnetic moments.
The internal field evolution with pressure suggest a possible reorientation of the Yb moments and/or the presence of frustrated magnetism, most likely due to different competing AF-interactions above and
is presumably driven by a structural phase transition.
VII ACKNOWLEDGMENTS
GL acknowledges financial support from the CNR Short-Term Mobility Program for his stay at the University of Prešov (Slovakia), where part of the magnetization measurements were performed. Part of this work was supported by the Schweizerische Nationalfonds zur Förderung der Wissenschaftlichen Forschung (SNF) under grant No. 200021-169455. RDR acknowledges support from the European Union’s Horizon-2020 research and innovation program (grant No. 654000). RDR, IJO, and PB also acknowledge the computing resources provided by the Swiss National Supercomputing Centre (CSCS) (project sm16), CINECA (project IsC58), STFC SCARF cluster, UK, and the HPC at the University of Parma, Italy. MR, IC, AD, and GP were supported by the grants VEGA 1/0956/17, VEGA 1/0611/18, and APVV-16-0079. The authors acknowledge Elettra for allocation of HP-XRPD beamtime and ILL for beam time allocation under the experiment code 5-31-2584. Neutron Diffraction data are available from ILL at DOI: 518 10.5291/ILL-DATA.5-31-2584.
Appendix A X-ray diffraction
The synchrotron x-ray powder diffraction (XRPD) measurements were carried out at 300 K at the Xpress beamline of Elettra (Trieste, Italy). Two datasets were collected: at ambient pressure using a radiation wavelength Å (for , 0.3, 0.4, 0.6, 0.8), and as a function of pressure — up to kbar — using Å (for , 0.3, 0.8). The ambient-pressure XRPD data could be satisfactorily fitted using a tetragonal space group across the whole compositional range, in agreement with previous investigations Bauer et al. 2005; Martinelli et al. 2019.
The XRPD patterns collected under applied pressure at the Xpress beamline reveal that all the investigated samples undergo a structural transition as the pressure increases (Fig. 7). Yb2Pd2In () exhibits a sharp structural transition at kbar. In the case, the structural transition has its onset at about the same pressure, but develops over a wider pressure range, to complete at kbar, thus indicating the first-order character of the transition. For , the structural transition is triggered at a significantly higher pressure ( kbar). By inspecting the above data one can deduce that, to some extent, the Sn substitution hinders the formation of the high pressure (HP) phase.

Attempts to ascertain the crystal structure of the HP phase were carried out, notwithstanding the unavoidable background due to the experimental set-up. To this purpose, the HP-XRPD data of the case were carefully analysed, since it exhibits not only a complete structural transformation at lower pressures, but also because of the lack of a diffraction line broadening due to In-substitution. Figure 8 shows the evolution with pressure of the peak located at Å-1, representing the 111 reflection of the low pressure (LP) phase that splits in the HP polymorph. Such behavior provides some clues and allows us to exclude some of the possible structural models. Firstly, the peak splitting indicates the suppression of the 4-fold rotational symmetry. Among the maximal subgroups of the space group, only the orthorhombic space groups and do not contain a 4-fold rotational axis. Nevertheless, none of them can account for the observed splitting. Upon further inspection of the structural models pertaining to the and subgroups, it turns out that the HP phase must be at least monoclinic to reproduce such peak splitting.

Several monoclinic models were tested and the best fit of the experimental data was obtained with a structural model. The corresponding Rietveld refinement plot and structural data are reported in Fig. 9 and Table 2, respectively. Noteworthy, the -values listed in Table 2 are somewhat biased towards relatively low values due to the strong instrumental contribution to the diffraction pattern. Therefore, the proposed structural model could differ significantly from the real structure.

| [Å] | [Å] | [Å] | [deg.] | |||
|---|---|---|---|---|---|---|
| 3.6874(1) | 7.5276(1) | 7.4740(1) | 89.65(1) | |||
| Atom | Wyckoff site | |||||
| Yb | 4 | 0.5334(3) | 0.6679(1) | 0.8210(1) | ||
| Pd | 4 | 0.0975(2) | 0.1334(1) | 0.3787(1) | ||
| In | 2 | 0 | 0 | 0 | ||
| , | ||||||

Appendix B DC magnetization
To assess the bulk magnetic properties of the as-grown samples, systematic dc susceptibility measurements were performed by means of an MPMS and a VSM Dynacool magnetometer systems, both from Quantum Design. curves measured from 2 to 300 K at T are reported in Fig. 10. Data exhibit a clear linear behavior down to about 30–50 K, below which they show a downward curvature. Most likely, this reflects the increasingly stronger correlations between Yb magnetic moments as one approaches the AF ordering temperature. After excluding the low- data, the magnetic susceptibility between 50 and 300 K could be fitted by means of a modified Curie Weiss law:
| (2) |
Here, is the Curie constant, is the Curie-Weiss temperature, and is a constant that accounts for the different temperature-independent contributions. In our case, is dominated by the Pauli paramagnetism of the conduction electrons.
Figure 11 summarizes the fit parameters as a function of Sn content and highlights some interesting features. Firstly, the effective magnetic moment is close to 4.53 , the expected value for (-term) magnetic Yb3+ ions, and is mostly independent of the In-Sn substitution rate. Secondly, the Curie

(a)
(b)
(c)
temperature is always negative, thus suggesting a predominance of antiferromagnetic-like interactions between Yb3+ ions. Finally, the -independent term shows a parabolic dependence vs. Sn content. In particular, it exhibits magnitudes in the cm3/mol range, with the maximum being reached at optimum doping. We recall that for simple metals is about cm3/mol Ashcroft and Mermin 1976, yet it may increase by more than a factor of 1000 in heavy-fermion (HF) compounds Gegenwart et al. 2005. This is also our case, where the Yb electrons hybridize with the conduction electrons, producing a strong enhancement of the carriers’ effective mass (heavy-fermion state).
Appendix C Neutron powder diffraction
The magnetic structure of Yb2Pd2In1-xSnx at ambient pressure, as resulting from neutron diffraction data Martinelli et al. 2019 on an optimally-doped compound, is shown in Fig. 12. The anticollinear in-plane ordering of the Yb3+ ions, as well as their antiferromagnetic intralayer interactions are in agreement with the magnetometry results.

(a)
(b)
Because SR measurements reveal that in all the cases (and in particular for ) the magnetic phase is greatly enhanced by external pressure, we selected the sample for further neutron powder diffraction (NPD) analysis under applied pressure. To this aim, NPD measurements were performed at the D20 diffractometer of the Institute Laue-Langevin (Grenoble, France). A TiZr clamp cell was loaded with about 4 g of sample, using Fluorinert as a pressure transmitting medium. Data were collected at 300 K, as well as in the 1.5–5.0 K range (above and below the magnetic transition) using an orange cryostat ( Å). To determine the pressure, a small amount of Pb was added to the sample. The applied pressure was thus directly calculated by substituting the measured structural parameters of Pb into its equation of state.
(a)
 (b)
(b)

Firstly, it is worth noting that the low resolution setup used to collect the NPD data prevented us from detecting the structural transformation taking place at high pressure. The Rietveld refinement was carried out by fitting the difference between the NPD data collected at 10 K (in the paramagnetic state) and at 1.5 K (in the magnetically ordered state), as shown in Fig. 13(a). No clear evidence of a magnetic phase transition with increasing pressure was observed up to kbar, a value where the magnetic structure adopted at ambient pressure Martinelli et al. 2019 is still retained. Nonetheless, we still could detect a moderate increase of the ordered magnetic moment with pressure, as derived by the Rietveld fits shown in Fig. 13(b).
Appendix D Details of the DFT calculations
(a)
(b)

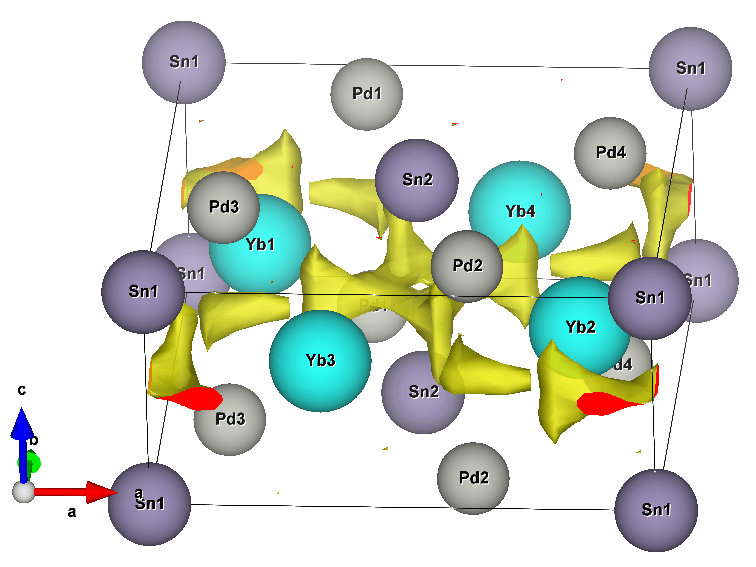
To determine the muon site(s) in Yb2Pd2In1-xSnx, we adopted the following strategy: firstly, we calculated the electrostatic potential in the unit cell. The resulting minima were then used as starting trial positions for the muon, treated in this second step as an impurity in a supercell where all atomic positions are allowed to relax.
The electrostatic potential was calculated using the non-magnetic Yb2Pd2Sn unit cell, which belongs to the space group, with lattice parameters Å and Å. Here, Yb ions occupy the Wyckoff positions at (0.1724, 0.6724, 0.5), Pd the positions at (0.3716, 0.8716, 0.0) and Sn the positions at (0.0, 0.0, 0.0). The potential minima are shown in the isosurface plot of Fig. 14(a). In a second step, the muon was introduced as a hydrogen impurity at the potential minimum, corresponding to the interstitial position (0.45, 0.45, 0.54).
A non-magnetic 224 supercell containing 160 atoms was used to model both Yb2Pd2Sn and Yb2Pd2In1-xSnx. Random distributions of In/Sn atoms [] were used to account for the substitution. The planewave- and pseudopotential based implementation provided by the Quantum Espresso suite of codes Giannozzi et al. 2017 was used for the structural relaxation. For the exchange correlation functional, the Perdew-Burke-Ernzerhof (PBE) Perdew et al. 1996 parametrization was used. The core wavefunction was approximated with the projector augmented wave (PAW) method for Yb and Pd atoms Blöchl 1994; Dal Corso 2014, and by the ultrasoft pseudopotential formalism Vanderbilt 1990; Garrity et al. 2014 for In, Sn and H. The kinetic and charge density cutoffs were set to 75 and 750 Ry, respectively 11 1 These values compare well with the convergence tests available at https://www.materialscloud.org/discover/sssp/table/efficiency and described in Ref. Küçükbenli et al.; Lejaeghere and et al. 2016. The Brillouin zone integration was performed at the gamma point. The force and the total energy were minimized by using Ry/a.u. and Ry as thresholds, respectively. The candidate muon site, as resulting from DFT calculations, is shown in Fig. 14(b). This corresponds to four symmetry-equivalent muon-stopping positions, lying only 0.6 Å apart.
We also verified that the transition to a monoclinic structure (occurring at high pressure) does not modify the local magnetic field at the muon site. For this, we selected the four irreducible representations allowed by the monoclinic HP structure (space group ) with nonzero magnetic moment on the Yb ion, as detailed in Table 3. Then, we calculated the dipolar field at the muon implantation sites in all these configurations, as shown in Table 4. It is worth noting that is almost unchanged for all the structures except III, where mT.
| Magnetic structure a | |||||
|---|---|---|---|---|---|
| Label | Mag. group | Yb1 | Yb2 | Yb3 | Yb4 |
| I | Pa21/c | (, , ) | (, , ) | (, , ) | (, , ) |
| II | Pa21/c | (, , ) | (, , ) | (, , ) | (, , ) |
| III | Pa21/c | (, , ) | (, , ) | (, , ) | (, , ) |
| IV | Pa21/c | (, , ) | (, , ) | (, , ) | (, , ) |
- a
Yb1, Yb2, Yb3, Yb4 at: (0.2667, 0.66790, 0.82100), (0.2333, 0.33210, 0.17900), (0.2333, 0.1679, 0.6790), (0.2667, 0.8321, 0.32100).
| [mT] | |||||
|---|---|---|---|---|---|
| Label | , | , | , | , | , |
| I | 234.03 | 99.74 | 25.93 | 117.09 | 225.85 |
| II | 0.0 | 0.0 | 0.0 | 0.0 | 0.0 |
| III | 234.19 | 103.55 | 251.90 | 216.13 | 137.32 |
| IV | 0.0 | 0.0 | 0.0 | 0.0 | 0.0 |
- b
Dipolar field at the muon position (0.5, 0.5, 0.5). The substitution-induced distortions on the Yb ions were considered for the Sn/In[] case.
Appendix E Averaging the dipolar fields and accounting for the effects of structural distortion
The averaging over four equivalent off-center sites leads to small deviations from the field value calculated at . For completeness, in Tab. 5, we summarize the results obtained using both approaches. Only three configurations (here shown in bold) exhibit substantial magnetic fields at the muon stopping site.
| [mT] | [mT] | |||
|---|---|---|---|---|
| Label | undist. | dist. | undist. | dist. |
| I | 0.0 | 6.18 (1.91) | 0.0 | 6.37 (1.97) |
| II | 0.0 | 3.79 (1.66) | 0.0 | 3.86 (1.69) |
| III | 0.0 | 3.58 (1.76) | 0.0 | 3.71 (1.87) |
| IV | 242.16 | 245.22 (4.96) | 248.65 | 251.83 (5.20) |
| V | 0.0 | 4.66 (1.68) | 0.0 | 4.74 (1.71) |
| VI | 0.0 | 6.87 (1.89) | 0.0 | 7.06 (1.95) |
| VII | 0.0 | 2.25 (1.21) | 0.0 | 2.36 (1.27) |
| VIII | 121.08 | 122.61 (4.53) | 124.32 | 125.91 (4.68) |
| IX | 0.0 | 3.03 (1.25) | 0.0 | 3.19 (1.29) |
| X | 96.99 | 100.17 (4.54) | 99.26 | 102.50 (4.64) |
References
- Gegenwart et al. (2002) P. Gegenwart, J. Custers, C. Geibel, K. Neumaier, T. Tayama, K. Tenya, O. Trovarelli, and F. Steglich, Magnetic-field induced quantum critical point in YbRh2Si2, Phys. Rev. Lett. 89, 056402 (2002).
- Gegenwart et al. (2008) P. Gegenwart, Q. Si, and F. Steglich, Quantum criticality in heavy-fermion metals, Nat. Phys. 4, 186 (2008).
- Bauer et al. (2004) E. Bauer, G. Hilscher, H. Michor, C. Paul, Y. Aoki, H. Sato, M. Giovannini, and A. Saccone, Evolution of ground state properties in novel Yb2Pd2In1-xSnx, J. Magn. Magn. Mater. 272–276, 237 (2004).
- Bauer et al. (2005) E. Bauer, G. Hilscher, H. Michor, C. Paul, Y. Aoki, H. Sato, D. T. Adroja, J.-G. Park, P. Bonville, C. Godart, J. Sereni, M. Giovannini, and A. Saccone, The magnetic instability of Yb2Pd2(In,Sn) in a non-Fermi liquid environment, J. Phys.: Condens. Matter 17, S999 (2005).
- Bauer et al. (2010) E. Bauer, R. T. Khan, M. Giovannini, and C. Ritter, Appearance of long range magnetic order in a nonmagnetic periphery: Yb2Pd2(In,Sn), Phys. Status Solidi B 247, 717 (2010).
- Muramatsu et al. (2011) T. Muramatsu, T. Kanemasa, T. Kagayama, K. Shimizu, Y. Aoki, H. Sato, M. Giovannini, P. Bonville, V. Zlatic, I. Aviani, R. Khasanov, C. Rusu, A. Amato, K. Mydeen, M. Nicklas, H. Michor, and E. Bauer, Reentrant quantum criticality in Yb2Pd2Sn, Phys. Rev. B 83, 180404(R) (2011).
- Yamaoka et al. (2017) H. Yamaoka, N. Tsujii, M.-T. Suzuki, Y. Yamamoto, I. Jarrige, H. Sato, J.-F. Lin, T. Mito, J. Mizuki, H. Sakurai, O. Sakai, N. Hiraoka, H. Ishii, K.-D. Tsuei, M. Giovannini, and E. Bauer, Pressure-induced anomalous valence crossover in cubic YbCu5-based compounds, Sci. Rep. 7, 5846 (2017).
- (8) In some cases we observed only tiny fractions of YbPd2In.
- Martinelli et al. (2019) A. Martinelli, S. Sanna, G. Lamura, C. Ritter, B. Joseph, E. Bauer, and M. Giovannini, Structural and magnetic properties of the Yb2Pd2In1-xSnx system: A synchrotron x-ray and neutron powder diffraction investigation, J. Phys.: Condens. Matter 31, 385802 (2019).
- Khasanov et al. (2016) R. Khasanov, Z. Guguchia, A. Maisuradze, D. Andreica, M. Elender, A. Raselli, Z. Shermadini, T. Goko, F. Knecht, E. Morenzoni, and A. Amato, High pressure research using muons at the Paul Scherrer Institute, High Press. Res. 36, 140 (2016).
- Shermadini et al. (2017) Z. Shermadini, R. Khasanov, M. Elender, G. Simutis, Z. Guguchia, K. V. Kamenev, and A. Amato, A low-background piston-cylinder-type hybrid high pressure cell for muon-spin rotation/relaxation experiments, High Press. Res. 37, 449 (2017).
- (12) The background contribution from the Ag sample holder (plate no. 233) was determined via transverse-field experiments at mT and 20 mK: and s-1.
- (13) A transverse-field SR experiment at high temperature () was used to determine (%). This parameter was then kept fixed during the subsequent fit iterations.
- (14) The K-T Gaussian depolarization rate (static dipolar nuclear contribution) and (dynamic electronic contribution) were determined by fitting the ZF-asymmetry at long times, where the depolarization rate is dominated by the pressure cell. Both parameters were then kept fixed during the subsequent fit iterations except for T<1K.
- (15) We note that the choice of a zero order Bessel function for the oscillating component does not improve the fit in all the tested samples.
- Shiroka et al. (2011) T. Shiroka, G. Lamura, S. Sanna, G. Prando, R. De Renzi, M. Tropeano, M. R. Cimberle, A. Martinelli, C. Bernini, A. Palenzona, R. Fittipaldi, A. Vecchione, P. Carretta, A. S. Siri, C. Ferdeghini, and M. Putti, Long- to short-range magnetic order in fluorine-doped CeFeAsO, Phys. Rev. B 84, 195123 (2011).
- (17) In magnetically ordered polycrystalline samples with isotropically distributed domains, statistically 1/3 of the implanted muons probe a local field parallel to their initial polarization, whereas 2/3 of them sense a local field orthogonal to their initial polarization.
- Isnard et al. (2016) O. Isnard, C. Rusu, R. Dudric, D. Andreica, A. Amato, and B. Chevalier, Low-temperature and high-pressure SR study of the strongly correlated CeNiSnHx compounds, Phys. Rev. B 93, 224424 (2016).
- Möller et al. (2013) J. S. Möller, P. Bonfà, D. Ceresoli, F. Bernardini, S. J. Blundell, T. Lancaster, R. De Renzi, N. Marzari, I. Watanabe, S. Sulaiman, and M. I. Mohamed-Ibrahim, Playing quantum hide-and-seek with the muon: localizing muon stopping sites, Phys. Scr. 88, 068510 (2013).
- Bernardini et al. (2013) F. Bernardini, P. Bonfà, S. Massidda, and R. De Renzi, Ab initio strategy for muon site assignment in wide band gap fluorides, Phys. Rev. B 87, 115148 (2013).
- Bonfà et al. (2015) P. Bonfà, F. Sartori, and R. De Renzi, Efficient and reliable strategy for identifying muon sites based on the double adiabatic approximation, J. Phys. Chem. C 119, 4278 (2015).
- Bonfà and De Renzi (2016) P. Bonfà and R. De Renzi, Toward the computational prediction of muon sites and interaction parameters, J. Phys. Soc. Jpn. 85, 091014 (2016).
- Cheung et al. (2018) S. C. Cheung, Z. Guguchia, B. A. Frandsen, Z. Gong, K. Yamakawa, D. E. Almeida, I. J. Onuorah, P. Bonfà, E. Miranda, W. Wang, D. W. Tam, Y. Song, C. Cao, Y. Cai, A. M. Hallas, M. N. Wilson, T. J. S. Munsie, G. Luke, B. Chen, G. Dai, C. Jin, S. Guo, F. Ning, R. M. Fernandes, R. De Renzi, P. Dai, and Y. J. Uemura, Disentangling superconducting and magnetic orders in NaFe1-xNixAs using muon spin rotation, Phys. Rev. B 97, 224508 (2018).
- Bernhard et al. (2011) B. H. Bernhard, B. Coqblin, and C. Lacroix, Frustration in the kondo lattice model: Local versus extended singlet phases, Phys. Rev. B 83, 214427 (2011).
- (25) Bilbao Crystallogr. Server, Maxmagn: Maximal magnetic space groups for a given propagation vector and resulting magnetic structural models: https://www.cryst.ehu.es/cgi-bin/cryst/programs/msglist2.pl . see also ref. [26] for further details.
- Perez-Mato et al. (2015) J. M. Perez-Mato, S. V. Gallego, E. S. Tasci, L. Elcoro, G. de la Flor, and M. I. Aroyo, Symmetry-based computational tools for magnetic crystallography, Annu. Rev. Mater. Res. 45, 217 (2015).
- Momma and Izumi (2008) K. Momma and F. Izumi, VESTA: a three-dimensional visualization system for electronic and structural analysis, J. Appl. Crystallogr. 41, 653 (2008).
- Doniach (1977) S. Doniach, The Kondo lattice and weak antiferromagnetism, Physica B+C 91, 231 (1977).
- Bauer et al. (2003) E. Bauer, S. Berger, S. Gabani, G. Hilscher, H. Michor, C. Paul, M. Giovannini, A. Saccone, C. Godart, P. Bonville, Y. Aoki, and H. Sato, Non-fermi-liquid features of novel Yb2Pd2In, Acta Physica Polonica B 34, 367 (2003).
- Giovannini (2018) M. Giovannini, (2018), private communications.
- Flouquet and Harima (2012) J. Flouquet and H. Harima, Heavy fermion material: Ce versus Yb case, Kotai Butsuri 2, 47 (2012), and arXiv:0910.3110.
- Braithwaite et al. (2013) D. Braithwaite, A. Fernandez-Pañella, E. Colombier, B. Salce, G. Knebel, G. Lapertot, V. Balédent, J.-P. Rueff, L. Paolasini, R. Verbeni, and J. Flouquet, (,,) Phase diagram of heavy fermion systems: Some systematics and some surprises from ytterbium, J. Supercond. Novel Magn. 26, 1775 (2013).
- Fernandez-Pañella et al. (2011) A. Fernandez-Pañella, D. Braithwaite, B. Salce, G. Lapertot, and J. Flouquet, Ferromagnetism in YbCu2Si2 at high pressure, Phys. Rev. B 84, 134416 (2011).
- Knebel et al. (2006) G. Knebel, R. Boursier, E. Hassinger, G. Lapertot, P. G. Niklowitz, A. Pourret, B. Salce, J. P. Sanchez, I. Sheikin, P. Bonville, H. Harima, and J. Flouquet, Localization of state in YbRh2Si2 under magnetic field and high pressure: Comparison with CeRh2Si2, J. Phys. Soc. Jpn. 75, 114709 (2006).
- Ashcroft and Mermin (1976) N. W. Ashcroft and N. D. Mermin, Solid State Physics (Saunders College Publishing, Philadelphia, 1976).
- Gegenwart et al. (2005) P. Gegenwart, J. Custers, Y. Tokiwa, C. Geibel, and F. Steglich, Ferromagnetic quantum critical fluctuations in YbRh2(Si0.95Ge0.05)2, Phys. Rev. Lett. 94, 076402 (2005).
- Giannozzi et al. (2017) P. Giannozzi, O. Andreussi, T. Brumme, O. Bunau, M. B. Nardelli, M. Calandra, R. Car, C. Cavazzoni, D. Ceresoli, M. Cococcioni, N. Colonna, I. Carnimeo, A. D. Corso, S. de Gironcoli, P. Delugas, R. A. D. Jr., A. Ferretti, A. Floris, G. Fratesi, G. Fugallo, R. Gebauer, F. G. U. Gerstmann, T. Gorni, J. Jia, M. Kawamura, H.-Y. Ko, A. Kokalj, E. Küçükbenli, M. Lazzeri, M. Marsili, N. Marzari, F. Mauri, N. L. Nguyen, H.-V. Nguyen, A. O. de-la Roza, L. Paulatto, S. Poncé, D. Rocca, R. Sabatini, B. Santra, M. Schlipf, A. P. Seitsonen, A. Smogunov, I. Timrov, T. Thonhauser, P. Umari, N. Vast, X. Wu, and S. Baroni, Advanced capabilities for materials modelling with quantum espresso, J. Phys.: Condens. Matter 29, 465901 (2017), and references therein.
- Perdew et al. (1996) J. P. Perdew, K. Burke, and M. Ernzerhof, Generalized gradient approximation made simple, Phys. Rev. Lett. 77, 3865 (1996).
- Blöchl (1994) P. E. Blöchl, Projector augmented-wave method, Phys. Rev. B 50, 17953 (1994).
- Dal Corso (2014) A. Dal Corso, Pseudopotentials periodic table: From H to Pu, Comp. Mater. Sci. 95, 337 (2014).
- Vanderbilt (1990) D. Vanderbilt, Soft self-consistent pseudopotentials in a generalized eigenvalue formalism, Phys. Rev. B 41, 7892 (1990).
- Garrity et al. (2014) K. F. Garrity, J. W. Bennett, K. M. Rabe, and D. Vanderbilt, Pseudopotentials for high-throughput DFT calculations, Comp. Mater. Sci. 81, 446 (2014).
- (43) These values compare well with the convergence tests available at https://www.materialscloud.org/discover/sssp/table/efficiency and described in Ref. Küçükbenli et al.; Lejaeghere and et al. 2016.
- (44) E. Küçükbenli, M. Monni, B. I. Adetunji, X. Ge, G. A. Adebayo, N. Marzari, S. de Gironcoli, and A. Dal Corso, Projector augmented-wave and all-electron calculations across the periodic table: A comparison of structural and energetic properties, arXiv:1404.3015.
- Lejaeghere and et al. (2016) K. Lejaeghere and et al., Reproducibility in density functional theory calculations of solids, Science 351, aad3000 (2016).