See pages - of cover-vol-physics.pdf
This document was prepared by the DUNE collaboration using the resources of the Fermi National Accelerator Laboratory (Fermilab), a U.S. Department of Energy, Office of Science, HEP User Facility. Fermilab is managed by Fermi Research Alliance, LLC (FRA), acting under Contract No. DE-AC02-07CH11359.
The DUNE collaboration also acknowledges the international, national, and regional funding agencies supporting the institutions who have contributed to completing this Technical Design Report. See pages - of tdr-authors.pdf
A Roadmap of the DUNE Technical Design Report
The DUNE FD TDR describes the proposed physics program, detector designs, and management structures and procedures at the technical design stage.
The TDR is composed of five volumes, as follows:
- •
Volume I (Introduction to DUNE) provides an overview of all of DUNE for science policy professionals.
- •
Volume II (DUNE Physics) describes the DUNE physics program.
- •
Volume III (DUNE Far Detector Technical Coordination) outlines DUNE management structures, methodologies, procedures, requirements, and risks.
- •
Volume IV (The DUNE Far Detector Single-Phase Technology) and Volume V (The DUNE Far Detector Dual-Phase Technology) describe the two FD LArTPC technologies.
The text includes terms that hyperlink to definitions in a volume-specific glossary. These terms appear underlined in some online browsers, if enabled in the browser’s settings.
Chapter 1 Introduction and Executive Summary
The Physics volume of the DUNE FD Technical Design Report (TDR) presents the science program of DUNE. Within, we describe the array of identified scientific opportunities and key goals. Crucially, we also report our best current understanding of the capability of DUNE to realize these goals, along with the detailed arguments and investigations on which this understanding is based.
In the context of the complete set of DUNE TDR volumes, a central role for this volume is to document the scientific basis underlying the conception and design of the LBNF/DUNE experimental configurations. As a result, it is the description of DUNE’s experimental capabilities that constitutes the bulk of the document. Key linkages between requirements for successful execution of the physics program and primary specifications of the experimental configurations are drawn and summarized.
This document also serves a wider purpose as a statement on the scientific potential of DUNE as a central component within a global program of frontier theoretical and experimental particle physics research. Thus, the presentation also aims to serve as a resource for the particle physics community at large.
In this chapter, the scientific goals, the methodologies utilized to obtain sensitivity projections, the corresponding results for selected elements of the scientific program, and the demands placed on the experiment design and performance are presented in summary form. Together with the two chapters that follow, this summary establishes the context for the detailed descriptions specific to each area of research that comprise the remaining chapters.
1.1 Overview of DUNE and its Science Program
The Deep Underground Neutrino Experiment (DUNE) will be a world-class neutrino observatory and nucleon decay detector designed to answer fundamental questions about the nature of elementary particles and their role in the universe. The international DUNE experiment, hosted by the U.S. Department of Energy’s Fermilab, will consist of a far detector to be located about underground at the Sanford Underground Research Facility (SURF) in South Dakota, USA, at a distance of from Fermilab, and a near detector to be located at Fermilab in Illinois. The far detector will be a very large, modular liquid argon time-projection chamber (LArTPC) with a total mass of nearly (fiducial mass of at least ). This LAr technology will make it possible to reconstruct neutrino interactions with image-like precision.
The far detector will be exposed to the world’s most intense neutrino beam originating at Fermilab. A high-precision near detector, located in a hall from the neutrino source on the Fermilab site, will be used to characterize the intensity and energy spectrum of this wide-band beam in real time. Over the long term, the near detector will also enable many strategies for mitigating systematic errors, both through direct cancellation of errors common to both near and far detectors, as well as through dedicated studies of exclusive neutrino interaction channels, beam line characteristics, and reconstructed neutrino energy uncertainties, to name a few.
In this section, the goals of the DUNE science program are presented. Assumptions and methods utilized in determining DUNE’s capabilities to meet these goals are summarized, with more detail appearing in Chapter 4. Finally, experimental sensitivities for selected physics measurements are shown to illustrate the achieved level of performance demonstrated.
1.1.1 Key Goals of the DUNE Science Program
The LBNF/DUNE strategy has been developed to meet the requirements set by the U.S. Particle Physics Project Prioritization Panel (P5) in 2014. It also takes into account the recommendations of the European Strategy for Particle Physics (ESPP) adopted by the CERN Council in 2013, which classified the LBL neutrino program as one of the four scientific objectives requiring significant resources, sizable collaborations, and sustained commitment.
As a benchmark, the P5 report [p5report2014] set the goal of reaching a sensitivity to charge-parity symmetry violation (CPV) of better than three standard deviations () over more than of the range of possible values of the unknown CP-violating phase . Based partly on this goal, it stated that “the minimum requirements to proceed are the identified capability to reach an exposure of by the 2035 time frame, the far detector situated underground with cavern space for expansion to at least LAr fiducial volume, and beam power upgradeable to multi-megawatt power. The experiment should have the demonstrated capability to search for SNBs and for proton decay, providing a significant improvement in discovery sensitivity over current searches for the proton lifetime.” These requirements are discussed below and in the sections that follow.
To summarize, the DUNE experiment will combine the world’s most intense neutrino beam, a deep underground site, and massive LAr detectors to enable a broad science program addressing some of the most fundamental questions in particle physics. This program is articulated in brief form below.
The primary science goals of DUNE are to:
- •
Carry out a comprehensive program of neutrino oscillation measurements using and beams from Fermilab. This program includes measurements of the charge parity (CP) phase, determination of the neutrino mass ordering (the sign of ), measurement of the mixing angle and the determination of the octant in which this angle lies, and sensitive tests of the three-neutrino paradigm. Paramount among these is the search for CPV in neutrino oscillations, potentially offering insight into the origin of the matter-antimatter asymmetry, one of the fundamental questions in particle physics and cosmology.
- •
Search for proton decay in several decay modes. The observation of proton decay would represent a ground-breaking discovery in physics, satisfying a key requirement of the grand unification of the forces.
- •
Detect and measure the flux from a core-collapse supernova within our galaxy, should one occur during the lifetime of the DUNE experiment. Such a measurement would provide a wealth of unique information about the early stages of core-collapse, and could even signal the birth of a black hole.
The intense neutrino beam from LBNF, the massive DUNE LArTPC far detector, and the high-resolution DUNE near detector will also provide a rich ancillary science program, beyond the primary goals of the experiment. The ancillary science program includes:
- •
Other accelerator-based neutrino flavor transition measurements with sensitivity to beyond the standard model (BSM) physics, such as non-standard interactions (NSIs), Lorentz invariance violation, charge, parity, and time reversal symmetry (CPT) violation, sterile neutrinos, large extra dimensions, heavy neutral leptons, and tests with measurements of tau neutrino appearance;
- •
Measurements of neutrino oscillation phenomena using atmospheric neutrinos;
- •
Searches for dark matter utilizing a variety of signatures in both near and far detectors, as well as non-accelerator searches for BSM physics such as neutron-antineutron oscillation.
- •
A rich neutrino interaction physics program utilizing the DUNE near detector, including a wide-range of measurements of neutrino cross sections and studies of nuclear effects.
Further advancements in the LArTPC technology during the course of the far detector construction may enhance DUNE’s capability to observe very low-energy phenomena such as solar neutrinos or even the diffuse supernova neutrino flux.
1.1.2 Summary of Assumptions and Methods Employed
Scientific capabilities are determined assuming DUNE is configured according to the general parameters described above. Further assumptions regarding the neutrino beam and detector systems, and their deployment, are stated here in Sections 1.1.2 and 1.1.2. More detail is given in later chapters as appropriate.
Determination of experimental sensitivities relies on the modeling of the underlying physics and background processes, as well as the detector response, including calibration and event reconstruction performance and the utilization of data analysis techniques and tools. While a brief discussion of the strategies employed is given below in Sec. 1.1.2, a dedicated chapter (4) is devoted to the presentation of this material. Considerations specific to individual elements of the science program are presented in detail in the corresponding chapters.
Beam and Detector
This document presents physics sensitivities using the optimized design of the 1.2 MW neutrino beam and corresponding protons on target (POT) per year assumed to be 1.1 POT. These numbers assume a combined uptime and efficiency of the Fermilab accelerator complex and the LBNF beamline of 56%.11 1 This projection, from which one year of LBNF beam operations can be expressed as , is based on extensive experience with intense neutrino beams at Fermilab, and in particular the NuMI beam line, which incorporates elements like those in the proposed LBNF beamline design and faces similar operating conditions. The beam design, simulation and associated uncertainties are described in Sec. 5.3.
For the neutrino oscillation physics program, it is assumed that equal exposures (time-integrated beam power times fiducial mass) are obtained with both horn current polarities, and therefore with the corresponding mix of primarily and data samples (see Sec. 5.2).
It is assumed that the DUNE far detector will include some combination of the different fiducial volume implementations (single or dual-phase) of the LArTPC concept for which technical designs have been developed. For much of the science program, it is expected that the capabilities of the two proposed far detector module implementations will be comparable. As a result of the current state of reconstruction and analysis software development (see Sec. 1.1.2), the physics sensitivity studies reported in this TDR are based on the single-phase LArTPC implementation, documented in full in Volume IV.
It is also assumed that validation of the DUNE far detector designs will come from data and operational experience acquired with the large-scale ProtoDUNE detectors staged at CERN, including single-particle studies of data obtained in test-beam running. Although this program is in early stages, beam data has already been collected with the ProtoDUNE-SP detector. Where possible, preliminary results from initial analyses of these data are presented in this document (see Chapter 4).
The near detector for DUNE has been under active development, and a Conceptual Design Report is in preparation. Correspondingly, the descriptions utilized in this TDR are consistent with this level of development. As the beam-based neutrino oscillation program depends strongly on the capabilities of the near detector systems, a brief summary of these systems and their expected performance is given in Chapter 5.
Deployment Scenario
Where presented as a function of calendar year, sensitivities are calculated with the following assumed deployment plan, which is based on a technically limited schedule.
- •
Start of beam run: Two FD module volumes for total fiducial mass of 20 kt, 1.2 MW beam
- •
After one year: Add one FD module volume for total fiducial mass of 30 kt
- •
After three years: Add one FD module volume for total fiducial mass of
- •
After six years: Upgrade to 2.4 MW beam
Simulation, Reconstruction and Data Analysis Tools
The development of algorithms and software infrastructure needed to carry out physics sensitivity studies has been an active effort within DUNE and the associated scientific community. As demonstrated in Chapter 4, significant progress has been made: event reconstruction codes can be run on fully simulated neutrino interaction events in DUNE far detector modules; the DUNE computing infrastructure allows high-statistics production runs; and end-user interfaces are functioning. Robust end-to-end analyses not possible a year ago have now been done and are being reported in this document.
For some aspects – for example, beamline modeling and GeV-scale neutrino interaction simulations – well-developed and validated (with data) software packages have been available throughout much of DUNE’s design phase. For others, corresponding tools did not exist and needed to be either developed from scratch or adapted with substantial modifications from other experimental programs. Concurrent with these development efforts, interim descriptions such as parametric detector response modeling, necessarily simple but based on reasonable extrapolation from experience and dedicated studies, were employed to assess physics capabilities. Even for the case of the better-developed tools – again, neutrino interaction modeling is a good example – significant incremental improvements have been made as data from neutrino experiments and other sources have become available and as theoretical understandings have advanced.
As a result of the rapid pace of development as well as practical considerations including human resource availability, different levels of rigor have been applied in the evaluation of physics capabilities for different elements of the program. The strategy adopted for this TDR has been to hold the primary elements of the program to the highest standard of rigor, involving direct analysis of fully simulated data, utilizing actual event reconstruction codes and analysis tools that could be applied to real data from DUNE far detector modules. For other elements of the program, sensitivities utilize realistic beam and physics simulations, but employ parametric detector response models in place of full reconstruction.
The implementation of this strategy comes with caveats and clarifications that are discussed in the corresponding chapters. Some of these are mentioned here.
- •
In the case of the long-baseline oscillation physics program, this approach requires a combination of the fully end-to-end analysis of simulated far detector data with the concurrent analysis of simulated data from near detector systems to capture in a realistic way the level of control over systematic errors. Given the current state of development in the DUNE near detector design and corresponding analysis tools, it has been necessary to employ parametric detector response modeling for near detector components, as described in Sec. 5.5.
- •
In the case of the nucleon decay searches (Sec. 6.1), reconstruction and analysis tools dedicated toward addressing the particular challenges presented are not as well developed as in the case of the beam-based oscillation physics program. Effort is ongoing to improve the performance of these tools.
- •
The supernova neutrino burst program (Sec. ) relies on reconstruction of event signatures from LArTPC signals generated by low-energy (MeV-scale) particles (electrons and de-excitation gammas). Full simulation and reconstruction is used for some studies, such as for the directionality study described in Sec . For other studies, a modified strategy is employed in order to efficiently explore model space: reconstruction metrics (resolution smearing matrices, for example) are derived from analysis of fully simulated and reconstructed low-energy particles and events in the far detector, and applied to understand mean detector response over a range of signal predictions.
- •
It should be noted that for scientific program elements where analysis of fully reconstructed simulated data has not yet been performed, the parametric response models used for the analyses presented here have been well characterized with dedicated studies and incorporation of results from other experiments. The demonstration of sensitivities for the long-baseline oscillation physics program (with full reconstruction) that are comparable to those previously obtained based on parametric response provides validation for this approach.
1.1.3 Selected Results from Sensitivity Studies
In this section, selected sensitivity projections from the central elements of the DUNE science program are presented. This selection is intended to convey just the headlines from what is an extensive and diverse program of frontier science.
DUNE can discover CPV in the neutrino sector and precisely measure oscillation parameters
The key strength of the DUNE design concept is its ability to robustly measure the oscillation patterns of and over a range of energies spanning the first and second oscillation maxima (see, e.g., Fig. 5.1 in Chapter 5). This is accomplished by a coordinated analysis of the reconstructed , , , and energy spectra in near and far detectors, incorporating data collected with forward (neutrino-dominated) and reverse (antineutrino-dominated) horn current polarities.
The statistical power of DUNE relative to the current
generation of long-baseline oscillation experiments
is a result of many factors including
(1) on-axis operations, (2) the LBNF beam power,
(3) long baseline and correspondingly high energy
oscillation maxima and strong separation of
normal and inverted neutrino mass ordering scenarios,
(4) detector mass, and (5) event
reconstruction and selection capabilities.
Tables and
(reproduced later as Tables and
)
give the expected event
yields for the appearance ( and )
and disappearance ( and ) channels, respectively,
after seven years of operation, assuming and
nufit [Esteban:2018azc, nufitweb]
values (given in Table 5.1) for other parameters.
{dunetable}
[ and appearance rates]
lrr
tab:execsumm-apprates
and appearance rates: Integrated rate of selected charged current (CC)-like events between 0.5 and 8.0 GeV assuming -year (staged) exposures in the neutrino-beam and antineutrino-beam modes. The signal rates are shown for both normal mass ordering (NO) and inverted mass ordering (IO), and all the background rates assume normal mass ordering. All the rates assume , and NuFIT 4.0 [Esteban:2018azc, nufitweb]
values for other parameters.
Expected Events (3.5 years staged per mode)
\toprowrule mode mode
\colhline Signal NO (IO) 1092 (497) 76 (36)
Signal NO (IO) 18 (31) 224 (470)
\colhlineTotal Signal NO (IO) 1110 (528) 300 (506)
\colhlineBeam CC background 190 117
neutral current (NC) background 81 38
CC background 32 20
CC background 14 5
\colhlineTotal background 317 180
[ and disappearance rates]
lr
tab:execsumm-disrates
and disappearance rates: Integrated rate of selected CC-like events between 0.5 and 8.0 GeV assuming a -year (staged) exposure in the neutrino-beam mode and antineutrino-beam mode. The rates are shown for normal mass ordering and .
Expected Events (3.5 years)
\toprowrule mode
\colhline Signal 6200
\colhline CC background 389
NC background 200
CC background 46
CC background 8
\toprowrule mode
\colhline Signal 2303
\colhline CC background 1129
NC background 101
CC background 27
CC background 2
[Significance of the DUNE determination of
CP-violation]fig:cpv_staging_execsum
Significance of the DUNE determination of CP-violation (i.e.: or ) for the case when =, and for 50% and
75% of possible true values, as a function of time in calendar
years. True normal ordering is assumed. The width of the band shows the
impact of applying an external constraint on .
![[Uncaptioned image]](2002.03005v2/graphics/cpv_exp_staging_varyconstr_nh_2019_v4.png)
Fig. (reproduced later as Fig. 5.10) illustrates DUNE’s ability to distinguish the value of the CP phase from CP-conserving values (0 or ) as a function of time in calendar year. These projections incorporate a sophisticated treatment of systematic error, as described in detail in Chapter 5. Strong evidence () for CPV is obtained for favorable values (half of the phase space) of after five years of running, leading to a determination after ten years.
A summary of representative sensitivity milestones for neutrino mass ordering and CPV discovery, as well as precision on and is given in Table . The ultimate level of precision that can be obtained on oscillation parameters highlights the point that DUNE will provide crucial input for flavor physics: Patterns required by particular symmetries underlying fermion masses and mixing angles may appear. The unitarity of the neutrino mixing matrix can be tested directly through comparisons of with the value obtained from reactor experiments. In conjunction with and other parameters, the precise value of can constrain models of leptogenesis that are leading candidates for explanation of the baryon asymmetry of the Universe.
[Projected DUNE oscillation physics milestones]
lcc
tab:milestones_execsumm
Exposure in years, assuming true normal ordering and equal
running in neutrino and antineutrino mode, required to reach
selected physics milestones in the nominal analysis, using the
NuFIT 4.0 [Esteban:2018azc, nufitweb] best-fit values for the oscillation parameters. As
discussed in Section 5.9.4, there are
significant variations in sensitivity with the value of
, so the exact values quoted here
(using = 0.580) are strongly dependent on that choice.
The staging scenario described in
Section 1.1.2 is assumed. Exposures
are rounded to the nearest year.
Physics Milestone Exposure (staged years)
5 Mass Ordering 1
( = -)
\colhline5 Mass Ordering 2
(100% of values)
\colhline3 CP Violation 3
( = -)
\colhline3 CP Violation 5
(50% of values)
\colhline5 CP Violation 7
( = )
\colhline5 CP Violation 10
(50% of values)
\colhline3 CP Violation 13
(75% of values)
\colhline Resolution of 10 degrees 8
( = 0)
\colhline Resolution of 20 degrees 12
( = -)
\colhline Resolution of 0.004 15
DUNE can discover proton decay and other baryon-number violating processes
By virtue of its deep underground location and large fiducial mass, as well as its excellent event imaging, particle identification and calorimetric capabilities, the DUNE far detector will be a powerful instrument for discovery of baryon-number violation. As described in Chapter 6, DUNE will be able to observe signatures of decays of protons and neutrons, as well as the phenomenon of neutron-antineutron mixing, at rates below the limits placed by the current generation of experiments.
Many nucleon decay modes are accessible to DUNE. As a benchmark, a particularly compelling discovery channel is the decay of a proton to a positive kaon and a neutrino, . In this channel, the kaon and its decay products can be imaged, identified, and tested for kinematic consistency with the full decay chain, together with precision sufficient to reject backgrounds due to atmospheric muon and neutrino interactions. Preliminary analysis of single-particle beam and cosmic ray tracks in the pdsp LArTPC is already demonstrating the particle identification capability of DUNE, as illustrated in Fig. . The signature of the kaon track and its observable decay particles is sufficiently rich that a credible claim of evidence for proton decay could be made on the basis of just one or two sufficiently well-imaged events, for the case where background sources are expected to contribute much less than one event (see Chapter 6 for a more complete discussion).
[Reconstructed of protons and muons in ProtoDUNE-SP]fig:pdsp_dedx_execsum Energy loss of protons (left) and muons (right) in 1-GeV running with the ProtoDUNE-SP LArTPC at CERN, as a function of residual range. The protons are beam particles identified from beamline instrumentation; the muons are reconstructed stopping cosmic rays collected concurrently. The red curves represent the mean of the corresponding expected signature. Note the difference in the vertical scale of the two plots. The kaon curve will lie between the two curves shown.
Projecting from the current analysis of in the DUNE far detector, with a detection efficiency of % as described in Chapter 6, the expected 90% CL lower limit on lifetime divided by branching fraction is for a - exposure, assuming no candidate events are observed. This is roughly twice the current limit of from Super–Kamiokande [Abe:2014mwa], based on an exposure of . Thus, should the rate for this decay be at the current Super–Kamiokande limit, five candidate events would be expected in DUNE within ten years of running with four far detector modules. Ongoing work is aimed at improving the efficiency in this and other channels.
DUNE can probe galactic supernovae via measurements of neutrino bursts
As has been demonstrated with SN1987a, the observation of neutrinos [Bionta:1987qt, Hirata:1987hu] from a core-collapse supernova can reveal much about these phenomena that is not accessible in its electromagnetic signature. Correspondingly, there is a wide range of predictions from supernova models for even very basic characteristics of the neutrino bursts. Typical models predict that a supernova explosion in the center of the Milky Way will result in several thousand detectable neutrino interactions in the DUNE far detector occurring over an interval of up to a few tens of seconds. The neutrino energy spectrum peaks around , with appreciable flux up to about .
LAr based detectors are sensitive to the component of the flux, while water Cherenkov and organic scintillator detectors are most sensitive to the component. Thus DUNE is uniquely well-positioned to study the neutronization burst, in which ’s are produced during the first few tens of milliseconds. More generally, measurements of the (flavor-dependent) neutrino flux and energy spectrum as a function of time over the entirety of the burst can be sensitive to astrophysical properties of the supernova and its progenitor, and distortions relative to nominal expectations can serve as signatures for phenomena such as shock wave and turbulence effects, or even black hole formation.
The sensitivity of the DUNE far detector to these phenomena is discussed in Chapter . An illustration of one element of the program is given in Fig. , which indicates a pointing resolution of better than that can be obtained by analysis of both subdominant highly-directional - elastic scattering events and dominant weakly-directional CC events within a supernova burst, based on full reconstruction and analysis. The DUNE results can be combined with corresponding measurements in other neutrino detectors to provide supernova localization from neutrinos alone in real time. {dunefigure}[Supernova direction determination from elastic scattering events]fig:fullSN_execsumLeft: Log likelihood values as a function of direction for a supernova sample with 260 - elastic scattering (ES) events. Right: Distribution of angular differences for directions to 10-kpc supernova using a maximum likelihood method.
1.2 Science Drivers for LBNF/DUNE Design Specifications
The scientific case summarized in the sections above is predicated on the suitability of the experimental configuration of LBNF/DUNE. In this section we summarize the ways in which the primary physics goals drive key features of this configuration. Further elaboration of the impacts of physics goals on specific high-level performance needs of the experimental systems is presented in the corresponding chapters that follow. Translation of performance needs into the corresponding LBNF/DUNE design specifications is addressed within the appropriate TDR volume.
1.2.1 General LBNF/DUNE Operating Principles
Worldwide scientific and technical planning for the ambitious next-generation deep underground long-baseline neutrino oscillation experiment that LBNF/DUNE now represents has been under way for more than a decade. Much development preceded the formation of the DUNE science collaboration in 2015 (see, for example, Refs. [Adams:2013qkq] and [LAGUNA-LBNO-deliv]).
Extensive study and discussion within the community have led to the principal elements of the LBNF/DUNE configuration:
- •
High-intensity conventional wide-band beam
The current generation of long-baseline neutrino experiments have benefited from narrow-band beam characteristics associated with off-axis detector deployment. The principal advantage is a low background rate in both appearance and disappearance channels from misidentified neutral current interactions of high energy neutrinos. However, this advantage comes at a cost of flux and spectral information relative to an on-axis detector configuration [Adams:2013qkq, Agarwalla:2014tca]. The DUNE concept builds on the notion that a highly-performant detector technology with excellent neutrino energy reconstruction and background rejection capabilities can optimize sensitivity and cost with an on-axis exposure to an intense conventional (magnetic horn-focused) beam. - •
Far detector site selection for long baseline
The baseline offered by locating the DUNE far detector at the Sanford Underground Research Facility in Lead, South Dakota is well-optimized for the neutrino oscillation physics goals of the program [Bass:2013vcg]. - •
Deep underground location for far detector modules
Early studies (see, e.g., Ref. [homestake:depth]) demonstrated that to realize the non-accelerator based elements of the DUNE science program, a deep underground far detector location is required. These studies also indicate that the 4850 Level of Sanford Lab provides sufficient attenuation of cosmic rays in the rock above, conclusions that have been supported by more recent studies (see, e.g., Refs. [bib:docdb3384, bib:docdb1752]). - •
LArTPC technology for far detector modules
Combining intrinsic scalability with high-performance event imaging, calorimetry and particle identification capabilities, the concept of large LArTPC detectors was developed for the broad-based underground science program of DUNE. This design choice integrates well with the other basic design elements described above. For example, the excellent neutrino energy reconstruction capability of LArTPC’s is especially important for the long-baseline program with a wide-band neutrino beam. Additionally, the LArTPC technology choice provides valuable complementarity to other existing and planned detectors pursuing many of the same goals. As an example of this complementarity, the sensitivity of DUNE to the component of supernova neutrino flux, prevalent in the neutronization phase of the explosion, provides distinct information relative to that provided by water or organic scintillator-based detectors in which interactions dominate.
The scientific basis for the above foundational experimental design choices has been examined and validated through extensive review, undertaken at all stages of DUNE concept development. Recent experimental and theoretical developments have only strengthened the scientific case for DUNE and its basic configuration. The technical underpinnings for these choices have also been strengthened over time through a worldwide program of R&D and engineering development, as described in a suite of LBNF/DUNE project documents including this TDR, as well as in sources describing independent experiments and development activities.
1.2.2 Far Detector Performance Requirements
The number of detector design parameters that have direct or indirect impact on performance is large. These design parameters have been studied over the years by past LArTPC experiments, by DUNE during early detector optimization work, through the successful construction and now operation of ProtoDUNE-SP, and through continuing studies within the DUNE consortia and physics groups.
High-level Observables in the Far Detector
DUNE’s suite of physics measurements relies on a relatively small number of event observables, through which the physics of interest can be accessed. Foremost are:
- •
Particle energies
Examples include the total visible energy in a supernova neutrino interaction; the reconstructed energy of a beam neutrino for oscillation measurements; the reconstructed energy of a muon track in a nucleon decay candidate event. - •
Particle identification
This comes from spatial patterns and energy depositions. Examples include photon/electron separation in the appearance analysis; proton/kaon separation in certain nucleon decay channels. - •
Event time
This allows for fiducialization in the TPC, drift corrections, and macroscopic timing for beam neutrinos and SNB physics.
Physics Case Studies
CP violation search
The primary demonstration that the detector design meets the physics needs is the full simulation and analysis being documented in this TDR volume. As described in Sec. 1.1.3, Figure presents the time-evolution of the CPV sensitivity obtained in this way.
To break the measurement apart into the three observables above, we start with neutrino energy. The charged lepton and hadronic shower energies are reconstructed separately and then summed. In electron neutrino events, the leptonic energy resolution (spectrum averaged) is 8%, the hadronic energy resolution is 49%, and the neutrino energy resolution is 13%. Note that a significant portion of the energy smearing comes from the physics of neutrino-nucleus scattering and hadronic shower production rather than from detector performance. In the impossible case that the lepton energy could be perfectly reconstructed, the electron neutrino (muon neutrino) energy resolution would only change by approximately (). Equivalently, small degradations in detector response have minimal leverage to affect the final neutrino energy resolution.
Particle identification is critical for the oscillation analysis
in that it enables neutrino flavor identification.
For appearance in particular, one
must positively identify the presence of a high-energy
electron while avoiding misclassification of high energy
photons as electrons. The LArTPC design meets this challenge
by having spatial resolution that is much smaller than the
radiation length () to make
visible the gaps between an event’s reconstructed vertex
and any photon conversions, and charge resolution that
provides additional separation based on pre-EM-shower
depositions, as demonstrated in an operating detector by
ArgoNeuT [Acciarri:2016sli] and with DUNE simulation
in Figure . The DUNE study [bib:docdb3384]
also shows alternative detector designs for the
single-phase LArTPC implementation. As long as
the signal-to-noise ratio is high on the readout wires,
minor adjustments to the wire angle and pitch have negligible
impact on separation power.
{dunefigure}
[Separation of photons and electrons by
in the pre-shower region]
fig:emdedx
Separation of photons and electrons by
in the pre-shower region. Alternative wire angles and wire
pitches are also shown.
![[Uncaptioned image]](2002.03005v2/graphics/emdedx.png)
In the analysis presented in Chapter 5, and in the preliminary CPV sensitivity in Figure , neutrino flavor classification is accomplished using a modern convolutional neural network technique that takes directly as input the TPC wire hits in the three detector views.
Event timing requirements for beam events flow from the need to establish the fiducial volume. This is discussed generally in the section on light yield below.
Supernova burst neutrinos. A core-collapse supernova at 10 kiloparsecs will provide 1000 neutrino interactions in the FD over the course of 10 seconds with typical energies between 5 and 30 MeV. Charged current events make up the majority of these. Much of the desired astrophysical information comes via the time-dependent energy spectrum of these neutrinos. As shown earlier in Sec. 1.1.3 and later in more detail in Chapter , DUNE capabilities are quantified through sensitivities both to generic pinched-thermal spectral parameters and to specific phenomena within the star.
Figure shows the precision with which DUNE can measure two of the spectral parameters, , related to the binding energy of the neutron star remnant, and , the average energy of the component, for the time-integrated spectrum. The assumed measured spectrum takes into account some degradation from the neutrino interaction process itself (e.g., energy lost to neutrons), via the Model of Argon Reaction Low Energy Yields (MARLEY) event generator. The colored contours show increasing levels of energy smearing. A 10% resolution is noticeable but insignificant, and the overall precision on the spectral parameters up to 30% resolution does not change dramatically As shown later, the additional smearing introduced by the detector’s response falls within the resolution envelope suggested here, and according to detector simulation is closest to the 20% level. In an eventual detailed analysis, the spectral fits will be done in time slices to study the evolution of the supernova, so the minimum contour size in each time slice will be larger due to reduced event counts in each slice.
[90% C.L. contours for spectral parameters for a supernova
at 5 kpc.]
fig:specpars
90% C.L. contours for the luminosity and average energy
spectral parameters for a supernova
at 5 kpc. The contours are obtained using the time-integrated
spectrum. As discussed in the text, the allowed regions
change noticeably but not drastically as one moves from
no detector smearing (pink) to various realistic resolutions (wider regions).
![[Uncaptioned image]](2002.03005v2/graphics/TDRPlot_Interpolated_Resolutions_5kpc.png)
Given the dominance of charged current events in the supernova neutrino sample, particle identification is not a requirement for the primary physics measurements. However, additional capability may be possible by identifying separately neutral current and elastic scattering interactions. Studies are on-going, and these possibilities are discussed in Chapter .
Timing for SNB events is provided by both the TPC and the photon detector system. Basic timing requirements flow from event vertexing and fiducialization needs. These are discussed generally for DUNE in the light yield section, but here we note a few supernova-specific design considerations. During the first 50 ms of a 10-kpc-distant supernova, the mean interval between successive neutrino interactions is depending on the model. The TPC alone provides a time resolution of 0.6 ms (at 500 V/cm), commensurate with the fundamental statistical limitations at this distance. However nearly half of galactic supernova candidates lie closer to Earth than this, so the rate can be tens or (less likely) hundreds of times higher. A resolution of , as already provided by the photon detector system, ensures that DUNE’s measurement of the neutrino burst time profile is always limited by rate and not detector resolution. The hypothesized oscillations of the neutrino flux due to standing accretion shock instabilities would lead to features with a characteristic time of 10 ms, comfortably greater than the time resolution. The possible neutrino trapping notch at the start of the burst has a width of . Observing the trapping notch could be possible for the closest progenitors.
Key High-level Detector Design Specifications
With the discussion above and in later chapters of this
document, it is possible to identify several high-level
detector design parameters that together characterize the
overall function of DUNE single-phase LArTPC modules. These
parameters and specified operating points are given in
Table .
{dunetable}[High-level DUNE single-phase far detector design specifications]
lll
tab:exec-fd-specs
High-level DUNE single-phase far detector design parameters
and specifications
Parameter Specification Goal
\toprowruleDrift field 500 V/cm
Electron lifetime 10 ms
System noise enc —
Light yield (at cathode)
Time resolution 100 ns
The column headings in the table are defined as follows:
Specification:
This is the intended value for the parameter or, more often, the upper or lower limit for the parameter. Fixed values are given for parameters that are not intrinsically dynamic (e.g., wire pitch). Limits are set by the more stringent driver, either the physics or engineering needs.
Goal:
This is an improved value that offers some benefit, and the collaboration aims to achieve this value where it is cost effective to do so. While in some cases the goal offers potential physics benefit directly, more often the goal provides risk mitigation, since improving the performance on one parameter can mean relaxing the requirements on other correlated parameters, thus protecting against unforeseen performance issues.
The first three parameters (drift field, electron lifetime, and TPC system noise) in Table enter directly into the ability to discriminate between ionization signals due to physics events and noise. Physics capability degrades if readout noise is not small compared to the ionization signal expected for minimum-ionizing particles located anywhere within the active volume of the detector. The remaining parameters (light yield for events at the cathode, and timing resolution) pertain to the ability of the scintillation photon detection system to enable localization of events within the TPC, needed for the non-accelerator based far detector physics program, both for fiducialization and for corrections to TPC charge attenuation. The general arguments for the specifications listed for each parameter are given below.
Drift field
The basic operating principle of the TPC involves the transport of ionization electrons out of the argon volume and to the detection plane. A higher drift field reduces electron transport time and thus electron loss due to impurities; reduces ion-electron recombination (increasing ionization signal at the expense of reduced scintillation photon yield); increases induction signals due to increased electron velocity; and reduces electron diffusion.
The argon volume in the FD single phase design is divided into four separate drift regions, each with a maximum drift distance of 3.5 m. The design goal of 500 V/cm field implies a voltage across the drift region of approximately 180 kV. At this field, the electron drift velocity is 1.6 mm/s , implying a maximum drift time . This drift time can be compared with the electron lifetime set by the argon purity. At , signals originating near the cathode will be attenuated to of their original strength. For the minimum field of 250 V/cm, this transmission becomes 23%. Additionally, electron/ion recombination happens more readily at lower field. From 500 V/cm to 250 V/cm, an additional signal loss of 11% (taking 23% to 20%) is introduced due to recombination. The lowered field also reduces the drift velocity and, in proportion, signal pick-up on the induction wires. Moving from 500 V/cm to 250 V/cm drops the induction signal by an additional 34% to an effective transmission for low-field depositions near the cathode (relative to “500 V/cm near the anode”) of 14%.
These signal attenuations are acceptable as long as the readout maintains good signal-to-noise (S/N) and charge resolution. High S/N for minimum ionizing particle (MIP) signals has been demonstrated at ProtoDUNE-SP – S/N =30 (collection), 15 (induction) – and the minimum transmissions above would not significantly damage the ability to identify wire hits. The charge resolution on individual wires, while not a driver of overall event resolution, feeds into the estimation for short segments of tracks and thus into particle identification. Studies of selection efficiencies at varied signal levels continue, but notably the selection efficiency exhibits no dependence on drift distance in the default simulation, which is based on a 3 ms electron lifetime. As mentioned below, ProtoDUNE readily achieved higher lifetimes.
Electrons drifting across the full 3.5 m will experience transverse diffusion of 1.7 mm (2.0 mm) at 500 V/cm (250 V/cm). The change in diffusion with field strength is insignificant in comparison to the wire pitch of 5 mm.
The reduced recombination at higher field results in smaller scintillation photon yields. At 500 V/cm, the yield is 60% of that at zero field. Thus any reduction in field strength will improve this detection channel. However, the incremental nature of this improvement and the more critical dependence of successful execution of the science program on the TPC performance together make optimization with respect to scintillation a secondary consideration.
ProtoDUNE-SP is currently operating at 500 V/cm.
Electron lifetime
Electronegative impurities (e.g., , ) within the liquid argon must be kept at low levels to prevent the capture of drifting electrons after ionization. Electron lifetime is inversely proportional to the level of these impurities.
The values in Table correspond to contamination levels of of 100 ppt -equivalent for 3 ms and 30 ppt for 10 ms. The influence of electron lifetime on physics capabilities has been discussed in the section on drift field above. Indeed, one can largely trade off purity for field. Note that the lower lifetime of 3 ms was assumed versus the goal of 10 ms. ProtoDUNE-SP has achieved electron lifetimes exceeding 5 ms.
Electronics system noise
Noise in the electronics system can limit the ability to identify and correctly associate wire hits and can worsen charge resolution. From engineering considerations, the noise level in the front-end electronics drives the specification. All other pieces of the electronics chain are to be kept well below this level. The specification is given in units of equivalent noise charge (enc).
At current gain settings, 1000 enc corresponds to 6.5 ADC counts. Initial ProtoDUNE analyses are showing 3.5 (4.5) ADC counts on collection (induction) channels. The current FD simulation assumes a noise level similar to ProtoDUNE performance, but higher noise levels are being explored. It is not expected that these relatively small adjustments (factor of 2) will impact physics analysis in any significant way. Noise assumptions (level and correlations) do influence DAQ design choices.
Light yield and photon-based timing
The photon detector system provides an event time based on the scintillation light produced in the liquid argon. In conjunction with the TPC ionization signal, this allows one to determine where the event occurred along the drift direction for event vertexing, fiducialization, and electron attenuation corrections. The specifications here are given for the worst-case event location in the fiducial volume, typically near the cathode and thus far from any photon detector on the anode planes.
A photon-based time resolution of 1 s corresponds to the time resolution for single TPC wire hits, allowing for useful event matching between the TPC and photon detector systems. Given the drift velocity, 1 s also corresponds to an effective spatial granularity in the drift direction (2 mm) that is similar to the wire pitch. The resulting three-dimensional event vertex provided by combining TPC and photon detector information has essential uses in DUNE physics analyses. A fiducial volume must be defined at the level for the accelerator-based neutrino oscillation measurements and for nearby supernovas, and at less stringent levels for other measurements. Additionally, most cosmogenic and environmental backgrounds for non-accelerator measurements (e.g., neutral particles produced by cosmic rays in the surrounding rock) have tell-tale distributions in the active volume and can thus be mitigated or eliminated through event localization.
The precise event time, and thus event location, also allows a correction for electron attenuation, which otherwise could have a large effect on energy resolutions due to the non-uniformity of response across the drift volume. The minimum TPC performance considered (with , ) would correspond to an energy smearing of 22% due to electron loss. This effect is made negligible at 1 s time resolution.
This attenuation correction is only possible when photon signals can be successfully associated with a TPC-recorded event. For low energy supernova neutrino events, this association is not
100% efficient. Figure shows the smearing on visible energy in the TPC for supernova neutrino events with and without a drift correction based on different photon detector system performance. The difference between no correction and any correction is dramatic. The small differences between different light levels (cast as effective photodetector area in the figure) stem not from improved spatial resolution but from a higher efficiency at reconstructing and associating light signals with the TPC signals. An effective area of 23 corresponds roughly to a light yield of 0.5 p.e./MeV at the cathode, i.e. the minimum specification.
{dunefigure}
[Dependence of reconstructed SNB event energy on timing-based drift correction]
fig:tpcres
Energy residuals for supernova neutrino events without (black)
and with (color) a timing-based drift correction to the
reconstructed energy. The red histogram assumes the event
vertex is known perfectly, and the realistic cases approach that
ideal quickly. The histogram roughly corresponds
to the specification of 0.5 p.e./MeV.
![[Uncaptioned image]](2002.03005v2/graphics/tpcres.png)
The use of photon signals for direct event calorimetry in supernova neutrino events is under study. Initial tests suggest resolutions around 25% are possible at 0.5 p.e./MeV, which is competitive with the TPC resolution at these energies.
Two light-collection bar designs and one segmented design (ARAPUCA) are operating in ProtoDUNE-SP. Initial performance evaluation is excellent, and a full quantitative assessment, described in Volume IV is in progress.
Detector Design Driver Summary
The above discussion provides the basic guidelines for key far detector performance specifications in the context of the single-phase module design. Further elaboration is given in the chapters devoted to science capabilities in this document. Discussion of other significant detector specifications and their impact on physics sensitivity is given in Volumes IV and V. While it is not practical to carry out comprehensive physics sensitivity studies comprehensively, in which every major detector parameter is varied individually or in conjunction with others, such studies have been done for a few significant parameters (such as anode wire pitch for the single-phase LArTPC design). These are reported in the corresponding detector volume.
1.3 Scope and Organization of this Document
The scope and organization of this document follow from both programmatic and practical considerations.
First, while this volume is strongly interconnected with the other TDR volumes, it is written so as to stand on its own to be of best use to the community outside DUNE. To accomplish this, some duplication of material presented in other volumes is unavoidable. At the same time, the full utility of this volume is as just one element within an integrated set of TDR volumes. Thus, explicit and implicit reference to material presented in other volumes is made freely.
Second, while two volumes describe the technical designs for far detector modules based on the single-phase and dual-phase liquid argon TPC technologies, the exact configuration of all four modules is not yet established. As of this writing, it is understood that the first two modules will likely be one of each technology. Practical considerations, including the current state of development of event reconstruction and other software tools, have led the DUNE science collaboration to undertake a rigorous evaluation of capabilities for a DUNE program consisting solely of single-phase far detector modules. Based on the considerable progress already made toward the realization of effective reconstruction software for the dual-phase far detector implementation, current understanding is that its capabilities are at least as well optimized for the key physics goals as those of the single-phase implementation.
Thus it should be understood that the studies and results reported in this document were undertaken with the specification of single-phase detector modules. Where possible, comments on how performance and/or capabilities of dual-phase modules might differ are provided.
Chapter 2 Introduction to LBNF and DUNE
The DUNE will be a world-class neutrino observatory and nucleon decay detector designed to answer fundamental questions about elementary particles and their role in the universe. The international DUNE experiment, hosted by the U.S. Department of Energy’s Fermilab, will consist of a FD located about underground at the SURF in South Dakota, USA, from Fermilab, and a ND located on site at Fermilab in Illinois. The far detector will be a very large, modular LArTPC with a total mass of nearly of LAr, at least () of which is fiducial. The LAr technology has the unique capability to reconstruct neutrino interactions with image-like precision and unprecedented resolution.
The DUNE detectors will be exposed to the world’s most intense neutrino beam originating at Fermilab. A high-precision near detector, from the neutrino source on the Fermilab site, will be used to characterize the intensity and energy spectrum of this wide-band beam. The ability to compare the energy spectrum of the neutrino beam between the ND and FD is crucial for discovering new phenomena in neutrino oscillations. The LBNF, also hosted by Fermilab, provides the infrastructure for this complex system of detectors at the Illinois and South Dakota sites. LBNF is responsible for the neutrino beam, the deep-underground site, and the infrastructure for the DUNE detectors.
2.1 The LBNF Facility
The LBNF project is building the facility that will house and provide infrastructure for the first two DUNE FD modules in South Dakota and the ND in Illinois. Figure shows a schematic of the facilities at the two sites, and Figure shows a diagram of the cavern layout for the FD. The organization and management of LBNF is separate from the DUNE collaboration. LBNF is also hosted by Fermilab and its design and construction are organized as a DOE/Fermilab project incorporating international partners.
[ LBNF/DUNE project: beam from Illinois to South Dakota]fig:lbnf LBNF/DUNE project: beam from Illinois to South Dakota.
![[Uncaptioned image]](2002.03005v2/graphics/lbnf_dune_graphic_miles_km-15-0031-01.jpg)
[ Underground caverns for DUNE in South Dakota]fig:cavernsUnderground caverns for DUNE FD and cryogenics systems at SURF, in South Dakota. The drawing, which looks towards the northeast, shows the first two far detector modules in place.
![[Uncaptioned image]](2002.03005v2/graphics/caverns_full_assembly.png)
The LBNF project provides to DUNE
- •
the technical and conventional facilities for a powerful neutrino beam utilizing the Proton Improvement Plan II (PIP-II) upgrade [pip2-2013] of the Fermilab accelerator complex. The PIP-II project will deliver between of proton beam power from Fermilab’s Main Injector in the energy range at the start of DUNE operations and provide a platform for extending beam power to DUNE to . A further planned upgrade of the accelerator complex will enable it to provide up to of beam power by 2030.
- •
the civil construction, or CF, for the ND systems at Fermilab; (see Figure );
- •
the excavation of three underground caverns at SURF to house the DUNE FD. The north and south caverns will each house two cryostats with a minimum fiducial mass of liquid argon, while the central utility cavern (CUC) will house cryogenics and data acquisition facilities for all four detector modules;
- •
surface, shaft, and underground infrastructure to support the outfitting of the caverns with four free-standing, steel-supported cryostats and the required cryogenics systems to enable rapid deployment of the first two FD modules. The intention is to install the third and fourth cryostats as rapidly as funding will allow.
[Neutrino beamline and DUNE near detector hall in Illinois
]fig:beamlineNeutrino beamline and DUNE near detector hall at Fermilab in Illinois
![[Uncaptioned image]](2002.03005v2/graphics/beamline-sideview.jpg)
2.2 DUNE: Far Detector Modules
The DUNE FD consists of four LArTPC detector modules, each contained in a cryostat that holds of LAr. Each module, installed approximately underground, has a fiducial mass of at least . The LArTPC technology provides excellent tracking and calorimetry performance, making it an ideal choice for the DUNE FD. Each of the LArTPCs fits inside a cryostat of internal dimensions (W) (H) (L) that contains a total LAr mass of about . The four identically sized modules provide flexibility for staging construction and for evolution of LArTPC technology.
DUNE is planning for and is prototyping two LArTPC technologies:
- •
SP: In the SP technology, ionization charges are drifted horizontally in LAr and read out on wires in the liquid. The maximum drift length in the first DUNE SP module is , and the nominal drift field is , corresponding to a cathode HV of . This design requires very low-noise electronics to achieve readout with good S/N because no signal amplification occurs in the liquid. This technology was pioneered by the icarus project, and after several decades of worldwide R&D, is now a mature technology. It is the technology used for Fermilab’s currently operating MicroBooNE detector, as well as the SBND detector, which is under construction.
- •
DP: This technology was pioneered at a large scale by the wa105 collaboration at CERN. It is less established than the SP technology but offers a number of potential advantages. Here, ionization charges drift vertically in LAr and are transferred into a layer of gas above the liquid. Devices called LEMs amplify the signal charges in the gas phase. The gain achieved in the gas reduces stringent requirements on the electronics, and increases the possible drift length, which, in turn, requires a correspondingly higher voltage. The nominal drift field is , as for the SP detector, but in this case corresponds to a cathode HV of . The maximum drift length in the dpmod is .
In both technologies, the drift volumes are surrounded by a FC that defines the volume(s) and ensures uniformity of the E field to 1% within the volume.
LAr is an excellent scintillator at a wavelength of . This fast scintillation light, once shifted into the visible spectrum, is collected by photon detectors (PDs) in both designs. The PDs provide a time for every event, indicating when the ionization electrons begin to drift. Comparing the time at which the ionization signal reaches the anode relative to the allows reconstructing event topology in the drift coordinate; the precision of the measured , therefore, directly corresponds to the precision of the spatial reconstruction in this direction.
Two key factors affect the performance of the DUNE LArTPCs. First, the LAr purity must be high enough to achieve minimum charge attenuation over the longest drift lengths in a given detector module. Thus, the levels of electro-negative contaminants (e.g., oxygen and water) must be maintained at ppt levels. The SP and DP designs have slightly different purity requirements (expressed in minimum electron lifetimes of versus , respectively) due to the different drift lengths.
Second, the electronic readout of the LArTPC requires very low noise levels to allow the signal from the drifting electrons to be clearly discernible over the baseline of the electronics. This requires using low-noise cryogenic electronics, especially in the case of the SP design.
The plans for the SP and DP TPCs are described briefly in the following sections. The DUNE collaboration is committed to deploying both technologies. For planning purposes, we assume that the first detector module will be SP and the second will be DP. Studies are also under way toward a more advanced detector module design that could be realized as the fourth module, for example. The actual sequence of detector module installation will depend on results from the prototype detectors, described below, and on available resources.
2.2.1 Single-phase Technology
Figure shows the general operating principle of the SP LArTPC, as has been previously demonstrated by ICARUS [Icarus-T600], MicroBooNE [microboone], argoneut [Anderson:2012vc], lariat [Cavanna:2014iqa], and ProtoDUNE [Abi:2017aow]. Figure shows the configuration of a DUNE SP module. Each of the four drift volumes of LAr is subjected to a strong electric field (E field) of . Charged particles passing through the TPC ionize the argon, and the ionization electrons drift in the E field to the anode planes.
[The SP LArTPC operating principle]fig:LArTPC1ch1
The general operating principle of the SP LArTPC.
![[Uncaptioned image]](2002.03005v2/graphics/TheBoPicture.png)
[A DUNE far detector SP module]fig:DUNESchematic1ch1
Schematic of a DUNE FD SP module, showing the alternating anode (A) and cathode (C) planes that divide the LArTPC into four separate drift volumes. The red arrows point to one top and one bottom FC module and to the rear endwall field cage.
![[Uncaptioned image]](2002.03005v2/DUNESchematic.png)
A SP module is instrumented with three module-length anode planes constructed from high by wide APA s, stacked two APA s high and 25 wide, for 50 APA s per plane, or 150 total. Each APA is two-sided with three layers of active wires forming a grid on each side of the APA. The relative voltage between the layers is chosen to ensure the transparency to the drifting electrons of the first two layers ( and ). These layers produce bipolar induction signals as the electrons pass through them. The final layer () collects the drifting electrons, resulting in a unipolar signal. The pattern of ionization collected on the grid of anode wires provides the reconstruction in the remaining two coordinates perpendicular to the drift direction.
Scintillation photons are detected in novel PD modules, based on a light-trap concept known as ARAPUCA [arapuca_jinst, arpkLNLS, Segreto:2018jdx] that utilizes dichroic filters, wavelength-shifting plates and SiPM read-out. The variant of this technology in the DUNE baseline design (X-ARAPUCA) is described in Volume IV. The PD modules are placed in the inactive space between the innermost wire planes of the APA s, installed through slots in a pre-wound APA frame. There are ten PD modules per APA for a total of per SP module. Of these, are mounted in central APA frames and must collect light from both directions, and are mounted in frames near the cryostat walls and collect light from only one direction.
2.2.2 Dual-phase Technology
The DP operating principle, illustrated in Figure , is very similar to that of the SP. Charged particles that traverse the active volume of the LArTPC ionize the medium while also producing scintillation light. The ionization electrons drift along an E field towards a segmented anode where they deposit their charge. Scintillation light is measured in PDs that view the volume from below.
[The DP LArTPC operating principle]fig:DPprinciplech1The general operating principle of the DP LArTPC.
![[Uncaptioned image]](2002.03005v2/graphics/dualphase-principle.png)
In this design, shown in Figure , electrons drift upward toward an extraction grid just below the liquid-vapor interface. After reaching the grid, an E field stronger than the drift field extracts the electrons from the liquid up into the gas phase. Once in the gas, electrons encounter micro-pattern gas detectors, called LEMs, with high-field regions. The LEMs amplify the electrons in avalanches that occur in these high-field regions. The amplified charge is then collected and recorded on a 2D anode consisting of two sets of gold-plated copper strips that provide the and coordinates (and thus two views) of an event.
[A DUNE far detector DP module]fig:DPdet1ch1
Schematic of a DUNE FD DP detector module with cathode, photomultiplier tubes (PMTs), FC, and anode plane with signal feedthrough chimneys (SFT chimneys). The drift direction is vertical in the case of a DP module.
![[Uncaptioned image]](2002.03005v2/graphics/DUNE-CDR-detectors-volume-optim.png)
The extraction grid, LEM, and anode are assembled into three-layered sandwiches with precisely defined inter-stage distances and inter-alignment, which are then connected horizontally into m2 modular detection units. These detection units are called charge-readout planes (CRPs).
The precision tracking and calorimetry offered by the DP technology provides excellent capabilities for identifying interactions of interest while mitigating sources of background. Whereas the SP design has multiple drift volumes, the DP module design allows a single, fully homogeneous LAr volume with a much longer drift length.
A simple array of PMTs coated with a wavelength-shifting material is located below the cathode. The PMTs record the time and pulse characteristics of the incident light.
2.2.3 ProtoDUNEs: Far Detector Prototypes
The DUNE collaboration has constructed two large prototype detectors (ProtoDUNEs), ProtoDUNE-SP and pddp, located at CERN. Each is approximately one-twentieth the size of a DUNE detector module and uses components identical in size to those of the full-scale module. ProtoDUNE-SP has the same maximum drift length as the full SP module. ProtoDUNE-DP has a maximum drift length, half that planned for the DP module. See the photos in Figures and .
[ProtoDUNE cryostats at the CERN Neutrino Platform]
fig:protodunes_northarea
ProtoDUNE-SP and ProtoDUNE-DP cryostats in the CERN Neutrino Platform in CERN’s North Area. The view is from the downstream end of the hall with respect to the beam lines. At front and center is the top of the ProtoDUNE-SP cryostat. The ProtoDUNE-DP cryostat with its painted red steel support frame visible is located at the rear of the photo on the right side of the hall.
![[Uncaptioned image]](2002.03005v2/graphics/neutrinoplatform.jpg)
[Interior views of the ProtoDUNEs]
fig:protodunes_interior
Interior views of ProtoDUNE-SP (left) and ProtoDUNE-DP (right). For ProtoDUNE-SP, one of two identical drift volumes is shown.
![[Uncaptioned image]](2002.03005v2/graphics/ProtoDUNE-sp-interior.jpg)
![[Uncaptioned image]](2002.03005v2/graphics/protodune-dp-interior.jpg)
These large-scale prototypes allow us to validate key aspects of the TPC designs, test engineering procedures, and collect valuable calibration data using a hadron test beam.
The construction phase of ProtoDUNE-SP was finished in July 2018, and the detector was filled with LAr in August 2018. The detector collected hadron beam data and cosmic rays during the fall of 2018 and continues to collect cosmic-ray data. The construction of the ProtoDUNE-DP detector was completed in June of 2019, and started operations in September 2019.
Data taken with the ProtoDUNE-SP detector demonstrates its excellent performance and has already provided valuable information on the design, calibration, and simulation of the DUNE FD. In all, of the 15360 TPC electronics channels are responsive in the LAr. The equivalent noise charge amounts to on the collection wires and on the induction wires. An average S/N of 38 for the collection plane is measured using cosmic-ray muons, while for the two induction planes, the S/N is 14 (U) and 17 (V), exceeding the requirement for the DUNE FD. The ProtoDUNE-SP photon detection system has also operated stably, demonstrating the principle of effective collection of scintillation light in a large-volume LArTPC with detectors embedded within the anode plane assemblies.
2.3 Near Detector Complex
The DUNE ND is crucial for the success of the DUNE physics program. It is used to precisely measure the neutrino beam flux and flavor composition. Comparing the measured neutrino energy spectra at the near and far site allows us to disentangle the different energy-dependent effects that modulate the beam spectrum and to reduce the systematic uncertainties to the level required for discovering CP violation. In addition, the ND will measure neutrino-argon interactions with high precision using both gaseous and liquid argon, which will further reduce the systematic uncertainties associated with the modeling of these interactions.
The ND hall will be located downstream from the target and will include three primary detector components, shown in Figure and listed in Table . Two of them can move off beam axis, providing access to different neutrino energy spectra. The movement off axis, called DUNE Precision Reaction-Independent Spectrum Measurement (DUNE-PRISM), provides a crucial extra degree of freedom for the ND measurement and is an integral part of the DUNE ND concept.
[DUNE near detector]
fig:neardetectors
DUNE Near Detector. The beam enters from the right and encounters
the LArTPC, the MPD, and the SAND on-axis beam monitor.
![[Uncaptioned image]](2002.03005v2/graphics/ND_Detectors.jpg)
The three detector components – a LArTPC called ArgonCube; a high-pressure gaseous argon TPC (HPgTPC) within a magnet surrounded by an ECAL, together called multi-purpose detector (MPD); and an on-axis beam monitor called System for on-Axis Neutrino Detection (SAND)– serve important individual and overlapping functions in the mission of the ND. The DUNE ND is shown schematically in the DUNE ND hall in Figure . Table provides a high-level overview of the three components of the DUNE ND along with the off-axis capability.
[Components of the DUNE ND]
p.22p.22p.22p.22
tab:NDsummThis table gives a high-level breakdown of the three major detector components and the capability of movement for the DUNE ND along with function and primary physics goals.
Component Essential Features Primary function Select physics aims
\toprowruleLArTPC (ArgonCube) Mass Experimental control for the Far Detector () CC
Target nucleus Ar Measure unoscillated spectra -e- scattering
Technology FD-like Flux determination CC
Interaction model
\colhlineMultipurpose detector (MPD) Magnetic field Experimental control for the LArTPCs () CC
Target nucleus Ar Momentum analyze liquid Ar CC,
Low density Measure exclusive final states with low momentum threshold Interaction model
\colhlineOn-axis beam monitor (SAND)
On-axis Beam flux monitor On-axis flux stability
Mass Neutrons Interaction model
Magnetic field A dependence
CH target -e- scattering
\colhline\colhline
DUNE-PRISM (capability) LArTPCMPD move off-axis Change flux spectrum Deconvolve xsec*flux
Energy response
Provide FD-like energy spectrum at ND
ID mismodeling
\colhline
The ArgonCube detector contains the same target nucleus and shares some aspects of form and functionality with the FD. The differences are necessitated by the expected high intensity of the neutrino beam at the ND. This similarity in target nucleus and, to some extent, technology, reduces sensitivity to nuclear effects and detector-driven systematic uncertainties in extracting the oscillation signal at the FD. The ArgonCube LArTPC is large enough to provide high statistics (), and its volume is sufficiently large to provide good hadron containment. The tracking and energy resolution, combined with the mass of the LArTPC, will allow measurement of the flux in the beam using several techniques, including the rare process of -e- scattering.
[DUNE ND Hall with component detectors]
fig:NDHallconfigs
DUNE ND hall shown with component detectors all in the on-axis configuration (left) and with the LArTPC and MPD in an off-axis configuration (right). The on-axis monitor SAND is shown in position on the beam axis.
![[Uncaptioned image]](2002.03005v2/graphics/NDHall_onaxis.jpg)
![[Uncaptioned image]](2002.03005v2/graphics/NDHall_offaxis.jpg)
The LArTPC begins to lose acceptance for muons with a measured momentum higher than 0.7 GeV/c because the muons will not be contained in the LArTPC volume. Because the muon momentum is a critical component of determining the neutrino energy, a magnetic spectrometer is needed downstream of the LArTPC to measure the charge sign and momentum of the muons. In the DUNE ND concept, this function is accomplished by the MPD, which consists of a HPgTPC surrounded by an ECAL in a magnetic field. The HPgTPC provides a lower density medium with excellent tracking resolution for the muons from the LArTPC.
In addition, neutrinos interacting with the argon in the gas TPC constitute a sample of -argon events that can be studied with a very low charged-particle tracking threshold and excellent resolution superior to LAr. The high pressure yields a sample of for these studies. These events will be valuable for studying the charged particle activity near the interaction vertex because this detector can access lower momenta protons than the LAr detector and can better identify charged pions. The lack of secondary interactions in these samples will be helpful for identifying the particles produced in the primary interaction and modeling secondary interactions in denser detectors.
The ECAL adds neutral particle (mainly ’s and neutrons) detection capability otherwise lacking in the MPD. NC- backgrounds to CC interactions can be studied, for example. Additionally, neutron production in neutrino-nucleus interactions is poorly understood: the presence of the ECAL opens the possibility of identifying neutrons via time-of-flight.
The LArTPC and MPD can be moved sideways up to 33 m to take data in positions off the beam axis. This capability is referred to as DUNE-PRISM. As the detectors move off-axis, the incident neutrino flux spectrum changes, with the mean energy dropping and the spectrum becoming more monochromatic. Though the neutrino interaction rate drops off-axis, the intensity of the beam and the size of the LArTPC combine to yield ample statistics even in the off-axis positions. The DUNE concept is based on reconstructing the energy-dependent neutrino spectrum and comparing the far and near sites. The ability to modify the energy spectrum at the near site by measuring at the off-axis locations will allow disentangling otherwise degenerate effects due to systematic biases of the energy reconstruction.
The final component of the DUNE ND suite (SAND) is the on-axis beam monitor that remains in fixed position at all times and serves as a dedicated neutrino spectrum monitor. It can also provide an excellent on-axis neutrino flux determination that can be used as an important point of comparison and a systematic crosscheck for the flux as determined by ArgonCube.
Chapter 3 Scientific Landscape
The aim of this chapter is to set the stage for the discussions of DUNE’s scientific capabilities that are presented in the chapters that follow. This is implemented as a series of brief descriptions of the theoretical and experimental contexts relevant for key areas of the DUNE physics program.
It is important to state at the outset that a fully comprehensive review is not possible here. Rather, the descriptions presented in this chapter are intended to be illustrative, so as to convey broadly the array of scientific opportunities for which DUNE is designed to realize. Furthermore, the supporting literature is vast, and it is not within the scope or purpose of this chapter to provide an exhaustive list of references. More details, including concrete references to the literature, are provided in subsequent chapters.
3.1 Neutrino Oscillation Physics
The first positive hint for neutrino flavor-change was uncovered in the 1960’s with the first measurement of the flux of neutrinos from the sun. The hint compounded in the late 1980’s, with high-statistics measurements of the differential flux of muon-type neutrinos produced by the collisions of cosmic rays with the earth’s atmosphere. Both hints were ultimately confirmed in the late 1990’s and early 2000’s by the Super-Kamiokande and SNO experiments. Concurrently, neutrino oscillations were confirmed as the dominant physics behind neutrino flavor change.
Neutrino oscillations imply nonzero neutrino masses and flavor-mixing in the leptonic charged-current interactions. That the neutrino masses are not zero is among the most important discoveries in fundamental particle physics of the twenty-first century. Understanding the mechanism behind nonzero neutrino masses is among the unresolved mysteries that drive particle physics today; they remain one of the few unambiguous facts that point to the existence of new particles and interactions, beyond those that make up the remarkable standard model of particle physics. Learning more about the properties of neutrinos is a very high priority for particle physics, and neutrino oscillations remain, as of today, the only phenomenon capable of observing the neutrino masses and lepton mixing in action. Precision measurements of neutrino oscillations have the potential to play a leading role in shaping particle physics in the next few decades.
Almost all neutrino data can be understood within the three-flavor paradigm with massive neutrinos, the simplest extension of the standard model capable of reconciling theory with observations. A handful of intriguing results, including those from the LSND, MiniBooNE, and short-baseline reactor experiments, remain unexplained and are currently the subject of intense experimental and theoretical scrutiny. If confirmed as the manifestation of new physics involving neutrinos – e.g., new neutrino states – these will open the door to more neutrino-related questions, many of which can be further explored with DUNE. We will return to those later but assume, conservatively, that the resolutions to these so-called short-baseline anomalies lie outside of neutrino-related particle physics.
3.1.1 Oscillation Physics with Three Neutrino Flavors
The three-flavor paradigm with massive neutrinos consists of introducing distinct, nonzero, masses for at least two neutrinos, while maintaining the remainder of the standard model of particle physics. Hence, neutrinos interact only via the standard model charged-current and neutral-current weak interactions. The neutrino mass eigenstates – defined as with masses, , respectively – are distinct from the neutrino charged-current interaction eigenstates, also referred to as the flavor eigenstates – , , , labeled according to the respective charged-lepton to which they couple in the charged-current weak interaction. The flavor eigenstates can be expressed as linear combinations of the mass eigenstates (and vice-versa). The coefficients of the respective linear combinations define a unitary mixing matrix, referred to as the neutrino mixing matrix, the leptonic mixing matrix, or the Pontecorvo-Maki-Nakagawa-Sakata (PMNS) matrix, as follows:
| (3.1) |
The PMNS matrix is the leptonic-equivalent of the Cabibbo-Kobayashi-Maskawa (CKM) matrix that describes the charged-current interactions of quark mass eigenstates. If the neutrinos are Dirac fermions, taking advantage of the unitary nature of the matrix and the ambiguity in defining the relative phases among the standard model lepton fields, the neutrino mixing matrix, like the CKM matrix, can be unambiguously parameterized with three mixing angles and one complex phase. If, however, the neutrinos are Majorana fermions, there are fewer field-redefinitions available and one ends up with at most two other physical complex phases.11 1 Majorana phases can also be interpreted as complex phases of the neutrino mass eigenvalues and need not be considered as part of the neutrino mixing matrix. Strictly speaking, these so-called Majorana phases can manifest themselves in “neutrino–antineutrino” oscillations [deGouvea:2002gf] and could be observed in neutrino oscillation experiments. These effects, however, are expected to be unobservably small and will be henceforth ignored, along with the Majorana phases. For all practical purposes, neutrino oscillation experiments cannot distinguish Majorana from Dirac neutrinos. Majorana phases are expected to play a significant role in experiments that are sensitive to the Majorana versus Dirac nature of the neutrinos, including searches for neutrinoless double-beta decay.
The PDG-parameterization [Tanabashi:2018oca], used throughout this report, makes use of three mixing angles , , and , defined as
| (3.2) | |||||
| (3.3) | |||||
| (3.4) |
and one phase , which in the conventions of [Tanabashi:2018oca], is given by
| (3.5) |
For values of , and assuming none of the vanish (, ), the neutrino mixing matrix is complex and CP-invariance is violated in the lepton sector. This, in turn, manifests itself as different oscillation probabilities, in vacuum, for neutrinos and antineutrinos: , , .22 2 For neutrino disappearance, in vacuum, the relation is a consequence of the CPT-theorem.
Information on the values of the neutrino masses comes from measurements of the neutrino oscillation frequencies, which are proportional to the differences of the squares of the neutrino masses, . Since all positive evidence for nonzero neutrino masses comes from measurements of neutrino oscillations, there is no direct information concerning the values of the masses themselves, only the mass-squared differences. As far as neutrino oscillation data are concerned, the hypothesis that the lightest neutrino mass is exactly zero is just as valid as the hypothesis that all neutrino masses are nonzero and almost degenerate. Three neutrino masses allow for two independent mass-squared differences and the existing neutrino data point to two hierarchically different , one whose magnitude is of order eV2, the other with magnitude of order eV2.
With this information, it is possible to unambiguously define the neutrino masses in a convenient way, as follows.33 3 Equivalently, one can use the neutrino mixing matrix to define the neutrino mass eigenstates. could be defined as the state associated to the largest (), to the second largest , and to the smallest : . The mass-squared difference with the smallest magnitude is defined to be , positive-definite so . The third mass eigenvalue is such that , of order eV2 while the sign of defines the neutrino mass ordering, or the neutrino mass hierarchy. If , the neutrino mass ordering is defined to be ‘normal’ and . If , the neutrino mass ordering is defined to be ‘inverted’ and . This definition allows one to change from a normal to an inverted ordering without having to change the relationship between the neutrino mixing matrix and the various experimental results. The distinct neutrino mass orderings are illustrated in Figure . {dunefigure}[Mass Ordering Illustration]massordering Fractional flavor content, () of the three mass eigenstates , based on the current best-fit values of the mixing angles. is varied from 0 (bottom of each colored band) to (top of colored band), for normal and inverted mass ordering on the left and right, respectively. The different colors correspond to the fraction (red), (green) and (blue).
Synthesis of Experimental Inputs
The world’s neutrino data significantly constrain all of the oscillation parameters in the three-flavor paradigm. The results of a recent global fit [Esteban:2018azc] to all neutrino data, except those associated to the short-baseline anomalies, are depicted in Fig. . The magnitudes of both mass-squared differences are known at better than 3%, while, at the one sigma level, , , are known at better than the 5% level. Note, however, that the error bars are rather non-Gaussian, especially for . At the three sigma level, according to [Esteban:2018azc], is constrained to lie between 0.43 and 0.62 so values of and are allowed. {dunefigure}[Nufit 4.0 global fit]nufit40Global three-neutrinos-oscillation analysis from [Esteban:2018azc]. Each panel depicts the two-dimensional projection of the allowed six-dimensional region after marginalization with respect to the undisplayed parameters. The different contours correspond to the two-dimensional allowed regions at 1, 90%, 2, 99%, 3 CL (2 dof). Note that the top panel refers to in the case of the normal mass-ordering and in the case of the inverted one. The regions in the lower four panels are defined using relative to minimum value of obtained for a fixed choice of the mass ordering, normal ordering on the left-hand-side, inverted ordering on the right-hand-side.
Critical questions remain open. The neutrino mass ordering is unknown. Current data prefer the normal ordering but the inverted one still provides a decent fit to the data. The octant of (whether [] or []) remains unknown. The value of is only poorly constrained. While positive values of are disfavored, all values between and , including the CP-conserving values , are consistent with the world’s neutrino data.44 4 It should be noted that recent results from the T2K experiment [Abe:2019vii] show only marginal consistency with CP-conserving values of . That the best fit to the world’s data favors large CPV is intriguing, providing further impetus for experimental input to resolve this particular question. It is central to the DUNE mission that all of the questions posed here can be addressed by neutrino oscillation experiments.
Other fundamental questions, including the nature of the neutrino – Majorana versus Dirac – and the determination of the values of the neutrino masses – oscillation experiments only measure mass-squared differences – are not accessible to oscillation experiments and must be addressed using different experimental tools.
At a more fundamental level, the three-flavor paradigm is yet to be significantly challenged by precision experiments. The overall picture described briefly above, while minimalistic and appealing, may turn out to be incomplete. While we don’t know what new neutrino physics, if any, lies beyond the three-flavor paradigm, many possibilities have been identified and are currently the subject of intense phenomenological and theoretical scrutiny. We list a few here; these and a few others are discussed in more detail in this report. There may be more neutrino-like states and hence new oscillation frequencies and mixing parameters. This is true regardless of the solution to the short-baseline anomalies. New neutrino-like states are often a “side-effect” of the physics responsible for nonzero neutrino masses and serve as a natural connection between the standard model and would-be dark sectors that may contain the elusive dark matter particle. Indeed, new neutrino states may, themselves, be a component of the dark matter. Neutrinos may also participate in new, currently, unknown interactions. These can be mediated by new heavy gauge bosons or new, weakly coupled, light particles. The heavier of the known neutrinos may also be much more short-lived than what is expected of the standard model interactions. The neutrino lifetimes are only poorly constrained, and some are best constrained by existing neutrino oscillation data. The quantum interferometric nature of the neutrino oscillation phenomenon also allows searches for new phenomena that manifest themselves as violations of -invariance or violations of the law that governs the time-evolution of quantum states.
Currently, the information that goes into determining the parameters of the three-flavor paradigm comes from a large variety of experiments that make use of different neutrino sources, neutrino flavors, and neutrino energies. Different parameters are determined by different experiments in such a way that there is only limited information on whether the formalism is complete. For example, is best constrained by measurements of the differential flux of solar neutrinos – mostly electron neutrinos with energies between 100 keV and 10 MeV – while is best constrained by the KamLAND experiment – electron antineutrinos from nuclear reactors and baselines around 100 km. While solar experiments are also sensitive to and KamLAND to , the respective uncertainties are not relatively competitive. Another example, the mixing parameters is best constrained by reactor experiments with baselines around 1 km. Long-baseline experiments sensitive to oscillations – baselines between 100 km and 1000 km, neutrino energies between a few 100 MeV and a few GeV – are also sensitive to , but the associated uncertainties cannot compete with those from the reactor experiments. It is, therefore, not possible to compare, in any effective way, the reactor measurement of with the long-baseline measurement of and perform a simple, non-trivial check of the three-flavor paradigm, which predicts those two numbers to be the same.
Opportunities for DUNE
The DUNE experiment is well positioned to over-constrain the three-flavor paradigm and reveal what may potentially lie beyond. The high-statistics of DUNE is, for example, capable of extracting via the electron neutrino appearance channel, , with precision that approaches that of the reactor electron antineutrino disappearance measurements, . If the three-flavor paradigm is incomplete, these two independent values for need not agree. The high-statistics of DUNE also allow one to directly determine whether CP-invariance is violated by comparing how neutrinos and antineutrinos -- after matter effects are taken into account -- oscillate. The neutrino energies and the baseline of LBNF-DUNE imply that the oscillation probabilities will be significantly impacted by matter effects. These, in turn, allow DUNE to establish the neutrino mass ordering independent from the results of other neutrino oscillation experiments.55 5 The current hint for the normal ordering relies on the reactor measurement of , the atmospheric neutrino sample from Super-Kamiokande, and the results from the beam experiments T2K and NOA. The presence of significant matter effects make DUNE sensitive to new neutrino interactions, which can modify neutrinos oscillation probabilities in a way that cannot be constrained by other experiments. The broadband character of the LBNF-DUNE neutrino beam allow one to “see” the oscillations and hence ultimately measure the ( is the baseline and is the neutrino energy) behavior of the oscillation probabilities in a way that is outside the capabilities of off-axis experimental setups and with better control of systematics than what can be expected of high-statistics measurements of atmospheric neutrinos. Measurements of the oscillation probabilities as a function of performed within the same experimental setup are, for example, sensitive to new oscillation frequencies -- and hence new neutrino mass eigenstates -- and provide excellent tests of Lorentz-invariance in the neutrino sector.66 6 is proportional to the neutrino proper time. Lorentz-invariance dictates that oscillation probabilities, once matter effects are accounted for, only depend on , not on or independently. This is true for a large class of phenomena, including allowing for the possibility that the neutrinos decay. Finally, DUNE energies are high enough that one can start to more seriously explore the dominant oscillations via the charged-current production and subsequent detection of -leptons.
DUNE may also reveal that the three-flavor paradigm provides a complete description of the neutrino oscillation phenomenon. In this case, the impact of DUNE, as far as neutrino oscillation physics is concerned, can be quantified mostly via (i) precision measurements of the neutrino oscillation parameters and (ii) information on CP-invariance in the lepton sector. We comment on those in turn in the section below.
3.1.2 Fermion Flavor Physics: Masses, Mixing Angles and CP-odd Phases
The patterns defined by the fermion masses and mixing parameters have been the subject of intense theoretical activity for the last several decades. The values of masses and mixing parameters, and potential relations among them, may contain invaluable information for physics beyond the standard model and may reveal more fundamental structures and symmetries. The discovery of neutrino masses and lepton mixing provided more and different information that is still being deciphered. Progress depends on how well masses and mixing parameters are known, and one can define, in a mostly model-independent way, useful goals and guidelines.
Grand unified theories posit that quarks and leptons are different manifestations of the same fundamental entities so their masses and mixing parameters are related. While it is very clear that the CKM and PMNS matrices are very different, they may come from the same seed processed in different ways. Different models make different predictions but, in order to compare different possibilities, it is important that lepton mixing parameters be known as precisely as quark mixing parameters. Currently, the precision with which quark mixing parameters are known [Tanabashi:2018oca] varies from 0.2% (for ) to 5% (for ). The unitarity-triangle phase (or ) is known at the 10% level. Future Belle II data are expected to reduce this uncertainty to one or two percent [Kou:2018nap]. These naively indicate that equal-footing comparisons between quark and lepton mixing require that the mixing angles be determined at the few percent level while should be measured at the 10% level or better.
There are other well-motivated scenarios that relate the values of the different lepton mixing parameters in such a way that knowledge of a subset of parameters is enough to determine the entire set. These relations can often be expressed as mathematical constrains of the form:
| (3.6) |
where is some model-dependent function. The ability to test these relations is limited by how well the different mixing parameters – sometimes all of them – are constrained. Optimal power requires all mixing parameters to be known equally well. Right now, is the least well measured mixing parameter other than the CP-odd phase , which is virtually unconstrained. Improving, very significantly, the uncertainty on both of these is among the neutrino-oscillation goals of DUNE. Note that sometimes these relations among mixing parameters are guided by the physics responsible for nonzero neutrino masses and may include the mass-squared differences (or even the masses themselves).
A concrete example was discussed in Ref. [Antusch:2007rk] (for many other examples and details, see, for example Ref. [Ballett:2013wya]). For a large subclass of phenomenological models aimed at explaining the structure of the neutrino mixing matrix, one can derive the following relation (in the limit ):
where is a parameter that characterizes the model (e.g., , etc), i.e., different models make different quantitative predictions for . While is rather well constrained experimentally, the uncertainty in and – we currently only suspect that and, at the three sigma level, – practically prevents one from testing whether the sum rule is obeyed for most values of . Indeed, it is challenging to use the sum rule to, for example, predict the value of because of the large current error on .
The neutrino mass ordering also contains invaluable clues concerning the pattern of fermion masses and mixing matrices. If the neutrino mass ordering is “normal,” the pattern of neutrino masses may mirror that of the charged-fermions: , barring the possibility, which cannot be tested in oscillation experiments, that . If, however, the mass ordering were inverted, we would learn that at least the two heavier neutrinos are almost degenerate in mass. No other matter particles with nonzero masses are quasi-degenerate; quasi-degenerate neutrino masses would inevitably be interpreted as evidence of an internal symmetry that lurks deep inside the neutrino sector and would invite vigorous new research efforts to tease out the nature of this new symmetry.
Even within the three-flavor paradigm, the CP-odd Dirac phase is a new source of CP-invariance violation. Indeed, if the neutrinos are Majorana fermions, the standard model accommodates at most five independent CP-odd parameters. Three of these – the majority – “live” in the neutrino sector and one of them can only be probed, at least for the foreseeable future, in neutrino oscillations. If we are to ever understand how and why nature chooses to distinguish matter from antimatter, we will need to explore, in as much detail as possible, CP-violation in the neutrino sector.
3.1.3 Impacts of DUNE for other Experimental Programs
The information on neutrino properties obtained with DUNE data will also serve as invaluable input for other experiments in fundamental physics, including those beyond the realm of neutrino properties. We highlight some of these here.
Long-baseline neutrino oscillation experiments are sensitive to the neutrino mass ordering via matter effects. Information on the mass ordering will also be obtained in atmospheric neutrino experiments and by looking for the – interference in reactor neutrino oscillations in vacuum. Given the importance of this measurement, it is critical to have multiple techniques to corroborate the findings. As DUNE will be able to achieve a 5 determination of the ordering in a very controlled environment, this input will allow the study of subdominant effects in atmospheric neutrino oscillations, which depend on the Earth matter profile, and in supernova neutrinos.
The predictions for the decay rate of neutrinoless double beta decay critically depend on the neutrino mass ordering, via the effective Majorana mass parameter . If DUNE determines that the neutrino mass ordering is inverted, is predicted to be bigger than , within reach of the next generation of neutrinoless double beta decay experiments. Further conclusions could be obtained depending on future experimental results. For concreteness, let us first assume that the ordering is established to be inverted and consider a few relevant possibilities. (i) If is measured, one would conclude that neutrinos are Majorana particles and that Majorana neutrino exchange is, most likely, the dominant mechanism behind neutrinoless double-beta decay. In principle, if a very precise measurement of the masses is derived from, for example, cosmic surveys and neutrino oscillation experiments, these data combined with a very accurate determination of might allow one to search for CP-violating effects due to the Majorana phases. (ii) If, on the other hand, is experimentally constrained to be smaller than , the simplest conclusion would be that neutrinos are Dirac particle unless a cancellation with other sources of lepton-number violation suppresses the decay rate of neutrinoless double beta decay. It would be critical to test this second hypothesis by looking for new particles and interactions which could provide sizable contributions to neutrinoless double beta decay. Second, let us consider the scenario in which DUNE establishes that the ordering is normal, as first hints from current neutrino data seem to indicate. In this case, expectations for range from the current upper bounds to exactly zero. Information from cosmic surveys on the sum of neutrino masses, combined with data from DUNE, would help evaluate whether is just around the corner or whether it might be severely suppressed. In the latter case, vigorous research towards multi-ton-scale ultralow-background neutrinoless double beta decay experiments will be required.
Neutrinos have a strong impact on the evolution of the universe as their presence suppresses the growth of cosmological structures such as galaxies and clusters of galaxies at the small scales. This is due to the fact that, being light, they free-streamed from high-density to low-density regions, weakening the effects of the gravitational pull of high-density regions. The effect is greater the larger the neutrino mass. As it is a gravitational effect, it does not depend on the flavor and the relevant parameter is, given current and future expected sensitivities, the sum . If DUNE establishes that the ordering is inverted, this implies that eV, while for normal ordering the sum can be as low as 0.06 eV. Future cosmological observations claim to be able to distinguish these two possibilities, under the assumption of the standard cosmological model. A precise measurement from cosmology would allow an accurate determination of the values of neutrino masses, with implications for neutrinoless double beta decay as discussed above. There is also the possibility that incompatibilities are observed. For instance, if DUNE finds that the ordering is inverted and cosmological observations constrain eV, one would have to conclude that there are new cosmological or particle physics effects which reduce the impact of neutrino masses in the formation of large scale structures or which counter them.
3.1.4 Neutrino Masses, CP-violation and Leptogenesis
The information which can be obtained in neutrino experiments, in particular DUNE, is essential to understand the origin of neutrino masses and possibly of the baryon asymmetry of the universe. The latter can be explained in the context of neutrino mass models, invoking the leptogenesis mechanism [Fukugita:1986hr]. The simplest extension of the Standard Model for neutrino masses requires right-handed (RH) neutrinos, which are singlets with respect to the Standard Model gauge group. They can couple to the Higgs doublet and the leptonic doublet via Yukawa couplings. Dirac masses arise for neutrinos as they do for all the other known fermions. This mechanism, although minimal, requires the promotion of the lepton-number symmetry from an accidental to a fundamental one and does not provide any insight on the smallness of neutrino masses or a rationale for the very different leptonic and quark mixing matrices.
If lepton-number is not imposed as a fundamental symmetry, Majorana masses for the RH neutrinos are also allowed and their magnitudes are unrelated to the scale of electroweak symmetry breaking. Once the Higgs gets a vacuum expectation value, both the Majorana and Dirac mass terms need to be included. If the RH-neutrino Majorana masses are much larger than the Dirac masses, this leads to small Majorana masses for the mostly-active neutrinos (those in the lepton-doublets) that manifest themselves via the Weinberg operator. This is the so-called seesaw mechanism and a strong suppression, without requiring very small Yukawa couplings, can be obtained if the RH neutrino masses are much heavier than the weak scale.
Models for nonzero neutrino masses, including the seesaw models, offer an explanation of the baryon asymmetry of the universe via the leptogenesis mechanism. This problem is one of the most compelling questions in cosmology. The baryon asymmetry of the universe has been measured precisely by Planck [Aghanim:2018eyx]
| (3.7) |
where is the baryon to photon ratio at recombination. These results are in good agreement with data on big bang nucleosynthesis. Assuming that the universe initially had the same amount of baryons and antibaryons,77 7 A period of inflation in the early universe implies that this assumption is effectively unavoidable. the baryon asymmetry can be generated dynamically if the Sakharov conditions [Sakharov:1967dj] are satisfied: lepton or baryon number violation, for instance in presence of RH neutrino Majorana masses, C and CP violation, and out-of-equilibrium dynamics, satisfied by the expansion of the universe.
We restrict the discussion here to high-energy, type-I seesaw models in which RH neutrinos are introduced with very heavy Majorana masses. These models can satisfy all of the Sakharov conditions because of the Majorana nature of the RH neutrinos and of the presence of complex Yukawa couplings. The basic picture is the following. In the early universe, RH neutrinos were in thermal equilibrium for large temperatures. Once the temperature dropped below their mass, the bath does not have sufficient energy to keep them in equilibrium and they decouple, decaying into leptons and Higgs bosons. If there is CP violation, the decays of this channel and of the conjugated one can proceed with different rates, controlled by the CP-violating phases in the Yukawa couplings. This asymmetry is partially washed out by inverse processes and the remaining lepton asymmetry is converted into a baryon asymmetry later on by non-perturbative SM effects.
The question of whether and how the CP-violation involved in leptogenesis and that observable in DUNE and other long-baseline experiments are related has been debated extensively in the literature. Restricting the discussion to high-energy seesaw models only, for simplicity, the link is provided by the complex Yukawa couplings which control on one side the baryon asymmetry and on the other neutrino masses and consequently the PMNS matrix which diagonalizes them. In general, relationships are rather complex and very indirect because the high-energy theory contains more parameters – including more CP-odd phases – than are measurable at low-energy experiments. In a completely model-independent way, it is not possible to draw a direct link between the two. However, in many models that have a reduced number of parameters, for instance because of flavor symmetries, experimentally accessible CP-odd phases can be directly connected to the baryon asymmetry generated via leptogenesis.
Even without resorting to a restriction of the number of parameters, rather general models present such connection if in the Early universe the thermal bath distinguished between charged lepton flavors in the so-called flavored leptogenesis. It is possible to show that, in these circumstances, the PMNS mixing matrix and specifically the CP-violating phase does explicitly contribute to the CP asymmetry, and consequently the baryon asymmetry, and can even generate enough CP-violation to reproduce the observed baryon asymmetry. This is a highly non-trivial statement since its CP-violating effects are suppressed by and hence enough early-universe CP-violation relies crucially on the relatively large observed value of .
The consensus in the community is that one should be able to conclude that, generically, the observation of lepton-number violation (e.g., neutrinoless double beta decay) combined with that of CP-violation in long-baseline neutrino oscillation experiments (or, possibly, neutrinoless double beta decay) constitutes strong circumstantial evidence – albeit not a proof – of the leptogenesis mechanism as the origin of the baryon asymmetry of the universe.
3.2 Nucleon Decay and B=2 Physics
Are protons stable? Few questions within elementary particle physics can be posed as simply and at the same time have implications as immediate. In more general terms, the apparent stability of protons suggests that baryon number is conserved in nature, although no known symmetry requires it to be so. Indeed, baryon number conservation is implicit in the formulation of the SM Lagrangian, and thus observation of baryon-number violating (BNV) processes such as nucleon decay or neutron-antineutron oscillation would be evidence for physics beyond the SM.88 8 Non-perturbative effects that involve tunneling between vacua with differing baryon number do allow for BNV processes within the SM, but at rates many orders of magnitude below directly observable levels (see, e.g., Ref. [Nath:2006ut]). On the other hand, continued non-observation of BNV processes will demand an answer to what new symmetry is at play that forbids them.
Especially compelling is that the observation of BNV processes could be the harbinger for grand unified theories (GUTs), in which strong, weak and electromagnetic forces are unified. Numerous GUT models have been proposed, each with distinct features. Yet, BNV processes are expected on general grounds, and it is a feature of many models that nucleon decay channels can proceed at experimentally accessible rates (see, e.g., Refs. [Nath:2006ut, Babu:2013jba] and references therein).
The theoretical literature on nucleon decay, and BNV processes in general, is vast, and has been well summarized in recent reviews [Nath:2006ut, Babu:2013jba]. It may be sufficient here to simply note that the theoretical motivations for baryon number non-conservation give strong arguments for the discovery potential of experimental searches, and that the existing array of null results from highly sensitive experiments provides hard constraints that models of new physics must abide by. Some additional theoretical context is provided in Chapter 6. The remainder of the discussion in this section focuses on the experimental landscape so as to illustrate the scientific opportunities for DUNE in BNV physics.
3.2.1 Experimental Considerations for Nucleon Decay Searches
The articulation of early GUT ideas led to the development of large-scale
detectors located deep underground dedicated toward the search for proton and BNV bound-neutron decay. Illustrating the present context, the limits on a subset
of possible nucleon decay modes, from a succession of sensitive experimental searches,
are plotted in Fig. .
{dunefigure}
[Summary of nucleon decay experimental limits]
fig:nucleondecay_exptsummary
Summary of nucleon decay experimental lifetime limits from past and currently
running experiments for decays to anti-lepton plus meson final states. Recently
reported improvements in limits [TheSuper-Kamiokande:2017tit] are highlighted,
indicating the ongoing nature of experimental effort in this area.
The limits shown are 90% confidence level (CL) lower limits on the partial lifetimes,
, where is the total mean life and is the branching fraction.
Updated from [Babu:2013jba].
![[Uncaptioned image]](2002.03005v2/graphics/nucleondecay_exptsummary.jpg)
Particularly sensitive limits have been obtained with water-based Cherenkov ring imaging detectors, most notably Super–Kamiokande. The strengths of this approach include the cost-effectiveness of utilizing large volumes of water ( fiducial mass in the case of Super–Kamiokande) as a source of nucleons and capabilities for particle identification, timing, energy and direction resolution. The technology is scalable to even larger masses, as in the proposed Hyper–Kamiokande [Abe:2018uyc] experiment, with a fiducial mass in its single-tank configuration. The combination of deep underground location with active shielding enables rejection of backgrounds from atmospheric muons. As a result, the dominant backgrounds are due to interactions of atmospheric neutrinos, which are suppressed by event selection on the distinctive kinematic and signal timing features of the various nucleon decay channels.
With published results (see, e.g., Refs. [Abe:2014mwa, Miura:2016krn, TheSuper-Kamiokande:2017tit]) based on exposures up to , Super–Kamiokande nucleon decay branching ratio sensitivity continues to increase linearly with exposure for many channels where background estimates are at the one-per- level. However, as exposure increases further, the rate of improvement will be diminished as backgrounds enter. Candidate events are starting to appear [TheSuper-Kamiokande:2017tit] in channels where the estimated background rate exceeds this level.
With a fiducial mass of , DUNE can capitalize on the potential for discovery of nucleon decay in channels where backgrounds can be reduced below the one-per- level thanks to the excellent imaging, calorimetric and particle identification capabilities of the LArTPC for events with 200 to of deposited energy. In a background-free analysis, sensitivity to channels with partial lifetimes in the range of to a few times may be achievable, depending on event selection efficiency. The limiting factor for DUNE is likely to be the combined impact of nucleon Fermi motion and final state interactions of decay hadrons as they escape the argon nucleus. Detailed analyses carried out for several prominent nucleon decay channels are described in Chapter 6.
Should nucleon decays occur at rates not far beyond current best limits, as predicted in numerous GUT models, a handful of candidate events could be observed by DUNE in a given decay mode. Even just one or two candidate events may be sufficient on their own to indicate evidence for nucleon decay, or provide confirmation for an excess above background observed in one of the contemporaneous large water or liquid scintillator experiments, e.g., Hyper Kamiokande (HyperK) [Abe:2018uyc] and JUNO [Djurcic:2015vqa, An:2015jdp] respectively.
3.3 Low-Energy Neutrinos from Supernovae and Other Sources
The burst of neutrinos from the celebrated core-collapse supernova 1987A in the Large Magellanic Cloud, about 50 kpc from Earth, heralded the era of extragalactic neutrino astronomy. The few dozen recorded events have confirmed the basic physical picture of core collapse and yielded constraints on a wide range of new physics [Schramm:1990pf, Vissani:2014doa]. This sample has nourished physicists and astrophysicists for many years, but has by now been thoroughly picked over. The community anticipates a much more sumptuous feast of data when the next nearby star collapses.
Core-collapse supernovae within a few hundred kiloparsecs of Earth – within our own galaxy and nearby – are quite rare on a human timescale. They are expected once every few decades in the Milky Way (within about 20 kpc), and with a similar rate in Andromeda, about 700 kpc away. However core collapses should be common enough to have a reasonable chance of occurring during the few-decade long lifetime of a typical large-scale neutrino detector. The rarity of these spectacular events makes it all the more critical for the community to be prepared to capture every last bit of information from them.
The information in a supernova neutrino burst available in principle to be gathered by experimentalists is the flavor, energy and time structure of several-tens-of-second-long, all-flavor, few-tens-of-MeV neutrino burst [Mirizzi:2015eza, Horiuchi:2017sku]. Imprinted on the neutrino spectrum as a function of time is information about the progenitor, the collapse, the explosion, and the remnant, as well as information about neutrino parameters and potentially exotic new physics. Neutrino energies and flavor content of the burst can be measured only imperfectly, due to intrinsic nature of the weak interactions of neutrinos with matter, as well as due to imperfect detection resolution in any real detector. For example, supernova burst energies are below charged-current threshold for , , and (collectively ), which represent two-thirds of the flux; so these flavors are accessible only via neutral-current interactions, which tend to have low cross sections and indistinct detector signatures. These issues make a comprehensive unfolding of neutrino flavor, time and energy structure from the observed interactions a challenging problem.
Much has occurred since 1987, both for experimental and theoretical aspects of supernova neutrino detection. There has been huge progress in the modeling of supernova explosions, and there have been many new theoretical insights about neutrino oscillation and exotic collective effects that may occur in the supernova environment. Experimentally, worldwide detection capabilities have increased enormously, such that we now expect several thousands of events from a core collapse at the center of the Galaxy.
3.3.1 Current Experimental Landscape
At the time of this writing, Super-Kamiokande is the leading supernova neutrino detector; it expects 8000 events at 10 kpc. As for the 1987A sample, these will be primarily flavor via inverse beta decay (IBD) on free protons. Super-K will soon be enhanced with the addition of gadolinium, which will aid in IBD tagging. IceCube is another water detector, with a different kind of supernova neutrino sensitivity – it cannot reconstruct individual neutrino events, given that any given interaction in the ice rarely leads to more than one photoelectron detected. However it can measure the overall supernova neutrino “light curve” as a glow of photons over background counts. Scintillator detectors, made of hydrocarbon, also have high IBD rates. There are several kton-scale scintillator detectors online currently: these are KamLAND, LVD, and Borexino. There is one small lead-based detector, HALO. Some surface or near-surface detectors will also usefully record counts even in the presence of significant cosmogenic background: these include NOvA, Daya Bay, and MicroBooNE.
In the world’s current supernova neutrino flavor sensitivity portfolio [Scholberg:2012id, Mirizzi:2015eza], the sensitivity is primarily to electron antineutrino flavor, via IBD. There is only minor sensitivity to the component of the flux, which carries with it particularly interesting information content of the burst (e.g., neutronization burst neutrinos are created primarily as ). While there is some sensitivity in other detectors via elastic scattering on electrons and via subdominant channels on nuclei, statistics are relatively small, and it can be difficult to disentangle the flavor content. Neutral-current channels are also of particular interest, given their sensitivity to the entire supernova flux; the only way to access the component is via NC. NC channels are subdominant in large neutrino detectors, and typically difficult to tag, although scintillator has some sensitivity via NC excitation of 12C as well as elastic scattering on protons. Dark matter detectors have access to the entire supernova flux via NC coherent elastic neutrino-nucleus scattering on nuclei, with statistics at the level of of 10 events per ton at 10 kpc.
3.3.2 Projected Landscape in the DUNE Era
The next generation of supernova neutrino detectors, in the era of DUNE, will be dominated by Hyper-Kamiokande, JUNO and DUNE. Hyper-K and JUNO are sensitive primarily to , and will have potentially enormous statistics. The next-generation long-string water detectors, IceCube and KM3Net, will bring their timing strengths. New tens-of-ton scale noble liquid detectors such as DARWIN will bring new full-flux NC sensitivity. DUNE will bring unique sensitivity: it will offer a new opportunity to measure the content of the burst with high statistics and good event reconstruction.
The past decade has also brought rapid evolution of multi-messenger astronomy. With the advent of gravitational waves detection, and high-energy extragalactic neutrino detection in IceCube, a broad community of physicists and astronomers are now collaborating to extract maximum information from observation in a huge range of electromagnetic wavelengths, neutrinos, charged particles and gravitational waves. This collaboration resulted in the spectacular multimessenger observation of a kilonova [kilonova]. The next core-collapse supernova will be a similar multimessenger extravaganza. Worldwide neutrino detectors are currently participants in SNEWS, the SuperNova Early Warning System [snews], which will be upgraded to have enhanced capabilities over the next few years. Information from DUNE will enhance the SNEWS network’s reach.
Neutrino pointing information is vital for prompt multi-messenger capabilities. Only some supernova neutrino detectors have the ability to point back to the source of neutrinos. Imaging water Cherenkov detectors like Super-K can do well at this, via directional reconstruction of neutrino-electron elastic scattering events. However other detectors lack pointing ability, due to intrinsic quasi-isotropy of the neutrino interactions, combined with lack of detector sensitivity to final-state directionality. Like Super-K, DUNE is capable of pointing to the supernova via its good tracking ability.
3.3.3 The Role of DUNE
Supernova neutrino detection is more of a collaborative than a competitive game. The more information gathered by detectors worldwide, the more extensive the knowledge to be gained; the whole is more than the sum of the parts. The flavor sensitivity of DUNE is highly complementary to that of the other detectors, and will bring critical information for reconstruction of the entire burst’s flavor and spectral content as a function of time [Ankowski:2016lab].
3.3.4 Beyond Core Collapse
While a core-collapse burst is a known source of a low-energy (100 MeV) neutrinos, there are other potential interesting sources of neutrinos in this energy range. Nearby thermonuclear or pair instability supernova events may create bursts as well, although they are expected to be fainter in neutrinos than core-collapse supernovae. Mergers of neutron stars and black holes will be low-energy neutrino sources, although the rate of these nearby enough to detect will be small. There are also interesting steady-state sources of low-energy neutrinos – in particular, there may still be useful oscillation and solar physics information to extract via measurement of the solar neutrino flux. DUNE will have the unique capability of measuring solar neutrino energies event by event with the CC interactions with large statistics, in contrast to other detectors primarily make use of recoil spectra. The technical challenge for solar neutrinos is overcoming radiological and cosmogenic backgrounds, although preliminary studies are promising. The diffuse supernova neutrino background neutrinos are another target which have a bit higher energy, but which are much more challenging due to very low event rate. There may also be surprises in store for us, both from burst and steady-state signals, enabled by unique DUNE liquid argon tracking technology.
3.4 Beyond-SM Searches
With the advent of a new generation of neutrino experiments which leverage high-intensity neutrino beams for precision measurements, the opportunity arises to explore in depth physics topics Beyond the Standard neutrino-related physics. Given that the realm of bsm physics has been mostly sought at high-energy regimes at colliders, such as the LHC at CERN, the exploration of BSM physics in neutrino experiments will enable complementary measurements at the energy regimes that balance those of the LHC. This, furthermore, is in concert with new ideas for high-intensity beams for fixed target and beam-dump experiments world-wide, e.g., those proposed at CERN [Beacham:2019nyx].
The combination of the high intensity proton beam facilities and massive detectors for precision neutrino oscillation parameter measurements and for CP violation phase measurements will help make BSM physics reachable even in low energy regimes in the accelerator based experiments. Large mass detectors with highly precise tracking and energy measurements, excellent timing resolution, and low energy thresholds will enable the searches for BSM phenomena from cosmogenic origin, as well. Therefore, it can be anticipated that BSM physics topics studied with the next-generation neutrino experiments may have a large impact in the foreseeable future, as the precision of the neutrino oscillation parameter and CPV measurements continues to improve. A recent review of the current landscape of BSM theory in neutrino experiments in two selected areas of the BSM topics – dark matter and neutrino related BSM– has been recently reported in [Arguelles:2019xgp].
The DUNE experiment has two important assets that will play a significant role in future searches for BSM physics. The unique combination of the high-intensity LBNF proton beams with a highly-capable precision DUNE Near Detector (ND), and massive liquid argon time-projection chamber (LArTPC) far detector modules at a baseline (FD), enables a variety of opportunities for BSM physics, either novel or with unprecedented sensitivity. The planned Near Detector can basically act as a stand alone experiment, to catch long lived particles produced in the proton target beam dump. On the other hand the Far Detector will allow for precision measurements on oscillation parameters, and for measurements cosmogenic and non-accelerator related phenomena, e.g. the detection of dark matter particles in certain scenarios.
In this section we give a few examples of particle searches in New Physics scenarios than can be conducted with the DUNE experiment, for which the sensitivities are discussed in the next chapters of this volume. For those searches for new particles in the ‘beam-dump’ mode, i.e. for searches for long-lived particles that pass through, or decay in, the Near Detector, a few scenarios have been studied in detail, but it will be important in the near future to connect with the Physics Beyond Collider study [Beacham:2019nyx] and compare the potential sensitivity of DUNE for these benchmark scenarios, especially for so called “feebly interacting particle” sensitivity projections as made for potential new beam dump experiments for the next 10-15 years. DUNE is an already planned facility, which has the potential to cover interesting regions in the coupling/mass phase space for dark photons, dark scalars and axion-like particles, for which the sensitivity has not been studied yet. In addition the precision measurements of the oscillation phenomena will allow also to search for e.g. non-standard interactions, CPT violating effects as discussed before.
3.4.1 Search for low-mass dark matter
Various cosmological and astrophysical observations strongly support the existence of dark matter (DM) representing 27% of the mass-energy of the universe, but its nature and potential non gravitational interactions with regular matter remain undetermined. The lack of evidence for weakly interacting massive particles (WIMP) at direct detection and the LHC experiments has resulted in a reconsideration of the WIMP paradigm. For instance, if dark matter has a mass which is much lighter than the electroweak scale (e.g., below GeV level), it motivates theories for dark matter candidates that interact with ordinary matter through a new vector portal mediator. High flux (neutrino) beam experiments, have been shown to provide coverage of DM+mediator parameter space which cannot be covered by either direct detection or collider experiments. In LBNF, low-mass dark matter may be produced through proton interactions in the target, and can be detected in the ND through neutral current (NC)-like interactions either with electrons or nucleons in the detector material via elastic scattering. Since these experimental signatures are virtually identical to those of neutrinos, neutrinos are a significant background that can be suppressed using timing and kinematics of the final-state electron or nucleons in the ND. Therefore, it is essential for the ND to be able to differentiate arrival time differences of the order a few ns or smaller, which determines the reachable range of the dark matter, and to measure precisely the kinematic parameters of the recoil electrons, such as the scattering angle and the energy. These capabilities will enable DUNE’s search for light dark matter to be competitive and complementary to other experiments at mass range below 1-2 GeV.
The capability has recently been demonstrated in a dedicated search by MiniBooNE [Aguilar-Arevalo:2018wea, Aguilar-Arevalo:2017mqx], which placed new limits on the well-motivated vector portal dark matter model [Pospelov:2007mp], as shown in Figure .
[Results from the MiniBooNE-DM light dark matter search]fig:MB-plot
Results from the MiniBooNE-DM search for light dark matter from Ref. [Aguilar-Arevalo:2018wea]
![[Uncaptioned image]](2002.03005v2/graphics/MB-plot.png)
More scenarios for DM detection will become accessible for DUNE, due to its improved sensitivity using LarTPC technology, and the large FD volume, These scenarios include boosted dark matter, produced in models with a multi-particle dark sector. Sensitivities of such scenarios will be examined further in Chapter of this volume.
3.4.2 Sterile neutrino search
Experimental results in tension with the three-neutrino-flavor paradigm, which may be interpreted as mixing between the known active neutrinos and one or more sterile states, have led to a rich and diverse program of searches for oscillations into sterile neutrinos. DUNE will be sensitive over a broad range of values of the sterile neutrino mass splitting by looking for disappearance of charged current (CC) and NC interactions over the long distance separating the near and far detectors, as well as over the short baseline of the ND.
The present lead in the search for sterile neutrinos, those which couple to standard neutrinos but not to the weak interaction, comes from disappearance experiments such as muon-neutrino accelerators and reactor anti-neutrino experiments, where unitarity is a necessary assumption. All the most precise measurements of the standard oscillation parameters have been made by disappearance experiments as shown in the left panel of Figure . The Liquid Scintilator Neutrino Detector (LSND) and MiniBooNE anomalies are expected to be elucidated by MicroBooNE due to its unprecedented event reconstruction capabilities. After the recent measurement from MINOS+ and IceCube are combined with unitarity constraints (see e.g. [Parke:2015goa]), most of the favored parameter space to explain LSND and MiniBooNE, with a sterile neutrino, is now disfavored as shown in the right panel of Figure . Addressing the apparent excess of electron events appearing in the muon-neutrino beam at MiniBooNE and LSND is also the main goal for the future SBN program at Fermilab, using for the first time near and far detectors with the same technology for this study. Furthermore in the next years conclusive results will become available from very short baseline reactor experiments, which measure the rate of inverse beta decay as function of length to the reactor core. These aim to see small modulations as function of distance, which could be caused by sterile neutrinos. However given the ensemble of all present data so far, if the anomalies survive it seems to indicate that a (or a few) ’standard’ sterile neutrino(s) hypothesis does not fit the data and the explanation may turn out to be much more complex, in which case certainly the capabilities of the DUNE experiment will play an important role in unraveling the exact nature of the new phenomenon.
[Exclusion limits for muon neutrino disappearance to sterile species in a 3+1 model]fig:disappearance
Left panel: Comparison of present exclusion limits from various experiments obtained through searches for disappearance of muon neutrinos into sterile species assuming a 3+1 model. The Gariazzo et al. region represents a global fit to neutrino oscillation data [Gariazzo:2015rra].
Right panel: The combined results of the disappearance measurements from minosplus, dayabay, and bugey, compared to the appearance measurements from LSND and MiniBooNE.
![[Uncaptioned image]](2002.03005v2/graphics/disappearance.png)
3.4.3 Neutrino tridents
Neutrino trident production is a rare weak process in which a neutrino, scattering off the Coulomb field of a heavy nucleus, generates a pair of charged leptons. The typical final state of a neutrino trident interaction contains two leptons of opposite charge. Measurements of muonic neutrino tridents were carried out at the CHARM-II, CCFR, and NuTeV experiments, and yielded results consistent with SM predictions, but those measurements leave ample room for potential searches for New Physics. As an example, a class of models that modify the trident cross section are those that contain an additional neutral gauge boson, , that couples to neutrinos and charged leptons. This boson can be introduced by gauging an anomaly-free global symmetry of the SM, with a particular interesting case realized by gauging Lμ–Lτ [He:1990pn, He:1991qd]. Such a is not very tightly constrained and could address [Baek:2001kca, Harigaya:2013twa] the observed discrepancy between the Standard Model prediction and measurements of the anomalous magnetic moment of the muon, (g–2)μ The DUNE ND offers an excellent environment to generate a sizable number of trident events, offering very promising prospects to both improve the above measurements, and to look for an excess of events above the SM prediction, which would be an indication of new physics.
Another category of BSM Physics models that can be probed through neutrino trident measurements are dark neutrino sectors. In these scenarios, SM neutrinos mix with heavier SM singlet fermions (dark neutrinos) with their own new interactions. Due to this mixing, neutrinos inherit some of this new interaction and may up-scatter to dark neutrinos. These heavy states in turn decay back to SM fermions, giving rise to trident signatures. These scenarios can explain the smallness of neutrino masses and possibly the MiniBooNE low energy excess of events, discussed above.
3.4.4 Heavy neutral leptons
The DUNE ND can be used to search topologies of rare event interactions and decays that originate from very weakly-interacting long-lived particles, including heavy neutral leptons – right-handed partners of the active neutrinos, vector, scalar, or axion portals to the hidden sector, and light supersymmetric particles. The high intensity of the NuMI source and the capability of production of charm mesons in the beam allow accessing a wide variety of lightweight long-lived, exotic, particles. Competitive sensitivity is expected for the case of searches for decay-in-flight of sub-GeV particles that are also candidates for dark matter, and may provide an explanation for leptogenesis in the case of charge-parity symmetry violation (CPV) indications. DUNE would probe the lighter particles of their hidden sector, which can only decay in SM particles in the form of pairs like , , qq. The parameter space explored by the DUNE ND extends to the cosmologically relevant region that is complementary to the LHC dark-matter searches through missing energy and mono-jets.
A recent study on the present limits and capabilities with future experiments for covering the coupling-mass phase space is shown in Figure , taken from [Beacham:2019nyx]. These future prospects include proposed experiments, such as SHiP, which would operate over the period of the next 10 to 15 years, hence the same period as for DUNE. While a dedicated analysis of DUNE’s sensitivity has not yet been carried out, the sensitivity from a previous study with the formerly-proposed LBNE Near Detector (shown as a dark-green dashed curve at low values of ) may give a representative indication. The FCC curve corresponds to a study aimed much further in the future.
[Sensitivities to heavy neutral leptons]fig:bc7_pbc_2
Sensitivity to Heavy Neutral Leptons with coupling to the second lepton generation only.
Current bounds (filled areas) and 10-15 years prospects for PBC projects (SHiP, MATHUSLA200, CODEX-b and FASER2) (dotted and solid lines).
Projections for the formerly-proposed LBNE near detector with protons on target (dark green dashed line starting
from lower left region of the plot) and FCC-ee with
decays (light green dashed line at higher values) also shown .
![[Uncaptioned image]](2002.03005v2/graphics/HNL_bc7_pbc_2.png)
3.5 Other Scientific Opportunities
The high rate of charged-current muon-neutrino argon interactions occurring in the near detector will provide important data samples to understand better neutrino-argon interactions in the relevant energy range for the DUNE far detector. The next chapters will give examples of scenarios where detailed understand of such interactions with precision measurements will have a significant impact on the physics reach for some topics. Effects of final state interactions, event topology and kinematics, neutron production and more can be studied in detail with such large statistics data samples.
The collection of the expected statistics and the determination of the neutrino and antineutrino fluxes to unprecedented precision would solve two main limitations of past neutrino experiments. At the same time, we can then exploit the unique properties of the neutrino probe for the study of fundamental interactions with a broad program of precision SM measurements. These potential measurements have not yet been studied in detail in this TDR, as the capabilities depend critically on the final design choice of the near detector, and this is still under discussion.
Neutrinos and anti-neutrinos are effective probes for investigating Electroweak physics. A precise determination of the weak mixing angle (sin) in neutrino scattering at the DUNE energies is twofold: (a) it provides a direct measurement of neutrino couplings to the Z boson and (b) it probes a different scale of momentum transfer than LEP did by virtue of not being at the Z boson mass peak. The unprecedented large statistics of deep inelastic scattering events will allow for significant measurements of the mixing angle. Other SM measurements include those of nucleon structure functions, the strange content of nucleons, and a precise verification of a number of sum rules. Some of these measurements would need cross section measurements on hydrogen targets. These expected sensitivity of these measurements will be addressed in future studies.
Chapter 4 Tools and Methods
Evaluation of the capabilities of DUNE/LBNF to realize the scientific program envisioned requires a detailed understanding of the experimental signatures of the relevant physical processes, the response of detection elements, and the performance of calibration systems and event reconstruction and other tools that enable analysis of data from the DUNE detectors. It is the aim of this chapter to introduce the network of calibration, simulation, and reconstruction tools that form the basis for the demonstration of science capabilities presented in the chapters that follow. The presentation here covers general components, namely those that are commonly utilized across the science program, although many of these are geared toward application to the long-baseline oscillation physics at the heart of this program. Other tools and methods developed for specific physics applications are described in the corresponding chapters that follow.
Where appropriate, the performance of reconstruction tools and algorithms is quantified. Some of these characterizations form the basis for parameterized-response simulations used by physics sensitivity studies that have not yet advanced to the level of analysis of fully reconstructed simulated data. They also serve as metrics that allow linkages to be drawn between detector configuration specifications and physics sensitivity.
Another critical role for the simulation and reconstruction tools described in this chapter, implicit above, is to enable detailed study of sources of systematic error that can affect physics capability, which can also lead to the development of mitigation strategies. Thus, where possible, assessments of systematic uncertainties in the modeling of LBNF/DUNE conditions and performance are presented.
4.1 Monte Carlo Simulations
Many physics processes are simulated in the DUNE FD; these include the interactions of beam neutrinos, atmospheric neutrinos, SNB neutrinos, proton decays and cosmogenic events. Figure shows a portion of the DUNE SP TPC consisting of APA s and CPA s.
[Schematic view of a DUNE SP TPC module]fig:dune_tpcA portion of DUNE SP TPC is shown. Four separate drift regions are separated by APA s and CPA s.
![[Uncaptioned image]](2002.03005v2/graphics/dune_sp_fd.jpg)
To save processing time, all the FD samples except the cosmogenics sample were simulated using a smaller version of the full far detector module geometry. This geometry is long, high and wide, which consists of 12 APA s and 24 CPA s. Figure shows the detailed structure of an APA. {dunefigure}
[Detailed structure of the APA]
fig:dune_apa
The detailed structure of the APA is shown. Each APA consists of four wrapped induction wire planes and two collection wire planes.
The PD is sandwiched between the two collection wire planes.
![[Uncaptioned image]](2002.03005v2/graphics/DUNE_APA.PNG)
For the simulation chain, each sample is simulated in three steps: generation (gen), geant4 tracking (g4), TPC signal simulation, and digitization (detsim). The first step is unique for each sample while the second and the third steps are mostly identical for all samples.
4.1.1 Neutrino Flux Modeling
Neutrino fluxes were generated using G4LBNF, a Geant4-based simulation of the LBNF neutrino beam. The simulation was configured to use a detailed description of the LBNF optimized beam design [optimizedbeamcdr]. That design starts with a , primary proton beam that impinges on a long, diameter cylindrical graphite target. Hadrons produced in the target are focused by three magnetic horns operated with currents. The target chase is followed by a helium-filled decay pipe and a hadron absorber. The focusing horns can be operated in forward or reverse current configurations, creating neutrino and antineutrino beams, respectively.
[Visualization of the focusing system as simulated in g4lbnf]fig:beam_vis
Visualization of the focusing system as simulated in g4lbnf.
![[Uncaptioned image]](2002.03005v2/Beamline_optimized_sept2017.png)
The optimized LBNF neutrino beam design is the result of several years of effort by LBNF and DUNE to identify a focusing system optimized to DUNE’s long-baseline physics goals. The optimization process requires scanning many parameters describing the hadron production target, focusing horns, and the decay pipe. Genetic algorithms have been used successfully in the past to scan the large parameter space to find the optimal beam design [Calviani:2014cxa]. The LBNF beam optimization process began with a genetic algorithm that scanned simulations of many different horn and target geometries to identify those that produced the optimal sensitivity to CPV. The specific metric used was estimated sensitivity to 75% of CP phase space after of exposure, taking into account the number and neutrino spectra of all neutrino flavors. The resulting beam effectively optimized flux at the first and second oscillation maxima, which also benefits measurements of other oscillation parameters. The output of the genetic algorithm was a simple design including horn conductor and target shapes. This design was transformed into a detailed conceptual design by LBNF engineers, and iterated with DUNE physicists to ensure that engineering changes had minimal impact on physics performance. Relative to the previous NuMI-like design, the optimized design reduces the time to three-sigma coverage of 75% of CP phase space by 42%, which is equivalent to increasing the mass of the far detector by 70%. It also substantially increases sensitivity to the mass hierarchy and improves projected resolution to quantities such as and [fields_doc_2901].
On-axis Neutrino Flux and Uncertainties
[Neutrino fluxes at the near detector]fig:flux_flavor_parent Predicted neutrino fluxes at the near detector for neutrino mode (left) and antineutrino mode (right). From top to bottom shown are muon neutrino, muon antineutrino, electron neutrino, and electron antineutrino fluxes.
The predicted neutrino fluxes for neutrino and antineutrino mode configurations of LBNF are shown in Figure . In neutrino (antineutrino) mode, the beams are 92% (90.4%) muon neutrinos (antineutrinos), with wrong-sign contamination making up 7% (8.6%) and electron neutrino and antineutrino backgrounds 1% (1%). Although we expect a small nonzero intrinsic tau neutrino flux, this is not simulated by G4LBNF. Nor are neutrinos arising from particle decay at rest.
[Flux uncertainties at the FD as a function of neutrino energy]fig:flux_uncertainties_flavor Flux uncertainties at the far detector as a function of neutrino energy in neutrino mode (left) and antineutrino mode (right) for, from top to bottom, muon neutrinos, muon antineutrinos, electron neutrinos and electron antineutrinos.
[Focusing and hadron production uncertainties on the mode flux]fig:flux_uncertainty_breakdown Focusing (left) and hadron production (right) uncertainties on the neutrino mode muon neutrino flux at the FD.
Uncertainties on the neutrino fluxes arise primarily from uncertainties in hadrons produced off the target and uncertainties in parameters of the beam such as horn currents and horn and target positioning (commonly called “focusing uncertainties”). Uncertainties on the neutrino fluxes arising from both of these categories of sources are shown in Figure . Hadron production uncertainties are estimated using the Package to Predict the FluX (PPFX) framework developed by the MINERvA collaboration [Aliaga:2016oaz, AliagaSoplin:2016shs], which assigns uncertainties for each hadronic interaction leading to a neutrino in the beam simulation, with uncertainties taken from thin target data (from e.g., the NA49 [NA49] experiment) where available, and large uncertainties assigned to interactions not covered by data. Focusing uncertainties are assessed by altering beamline parameters in the simulation within their tolerances and observing the resulting change in predicted flux. A breakdown of the hadron production and focusing uncertainties into various components are shown in Figure for the neutrino mode muon neutrino flux at the FD.
At most energies, hadron production uncertainties are dominated by the “NucleonA” category, which includes proton and neutron interactions that are not covered by external data. At low energies, uncertainties due to pion reinteractions (denoted “Meson Inc”) dominate. The largest source of focusing uncertainty arises from a 1% uncertainty in the horn current, followed by a 2% uncertainty in the number of protons impinging on the target. For all neutrino flavors and all neutrino energies, hadron production uncertainties are larger than focusing uncertainties. However, hadron production uncertainties are expected to decrease in the next decade, as more thin target data becomes available. Hadron production measurements taken with a replica target are also being considered and would substantially reduce the uncertainties.
[Correlation of flux uncertainties]fig:flux_uncertainty_correlation
Correlation of flux uncertainties. Each block of neutrino flavor corresponds to bins of energy with bin boundaries of
[0.0, 0.2, 0.4, 0.6, 0.8, 1.0, 1.2, 1.4, 1.6, 1.8, 2.0, 2.2, 2.4, 2.6, 2.8, 3.0, 3.2, 3.4, 3.6, 3.8, 4.0, 4.5, 5.0, 5.5, 6.0, 6.5, 7.0, 8.0, 9.0, 10.0, 12.0, 15.0, 20.0] GeV for right sign muon neutrinos, [0.0, 0.2, 0.4, 0.6, 0.8, 1.0, 1.5, 2.0, 2.5, 3.0, 4.0, 5.0, 6.0, 8.0, 10.0, 20.0] GeV for wrong sign muon neutrinos, and [0.0, 0.75, 1.5, 2.5, 3.5, 5.0, 7.5, 10.0, 20.0] for electron neutrinos and antineutrinos.
![[Uncaptioned image]](2002.03005v2/FluxOnAxisCorrMatrix.png)
Figure shows correlations of the total flux uncertainties. In general, the uncertainties are highly correlated across energy bins. However, the flux in the very high energy, coming predominantly from kaons, tends to be uncorrelated with flux at the peak, arising predominantly from pion decays. Flux uncertainties are also highly correlated between the near and far detectors and between neutrino-mode and antineutrino-mode running. The focusing uncertainties do not affect wrong-sign backgrounds, which reduces correlations between e.g., muon neutrinos and muon antineutrinos in the same running configuration in the energy bins where focusing uncertainties are significant.
The unoscillated fluxes at the ND and FD are similar but not identical. Figure shows the ratio of the near and far neutrino-mode muon neutrino unoscillated fluxes and the uncertainties on the ratio. The uncertainties are approximately 1% or smaller except at the falling edge of the focusing peak, where they rise to 2%, but are still much smaller than the uncertainty on the absolute fluxes. And unlike the case for absolute fluxes, the uncertainty on the near-to-far flux ratio is dominated by focusing rather than hadron production uncertainties. This ratio and its uncertainty are for the fluxes at the center of the near and far detectors, and do not take into account small variations in flux across the face of the ND.
[Ratio of neutrino-mode muon neutrino fluxes at the near and far detectors]fig:flux_nearfar Ratio of neutrino-mode muon neutrino fluxes at the near and far detectors (left) and uncertainties on the ratio (right).
Off-axis Neutrino Flux and Uncertainties
The neutrino flux has a broad angular distribution and extends outward at the ND hall. At an “off-axis” angle relative to the initial beam direction, the subsequent neutrino energy spectrum is narrower and peaked at a lower energy than the on-axis spectrum. The relationship between the parent pion energy and neutrino energy is shown in Figure . At , the location of the ND hall, a lateral shift of corresponds to approximately a change in off-axis angle. The DUNE-PRISM concept, in which the near detector LArTPC can be moved to enable off-axis measurements, relies on this feature to help constrain systematic errors for the LBL oscillation program as described in Section 5.5.2.
[ energy as function of parent pion energy for off-axis angles] fig:OAAFluxFigs (left) The neutrino energy as a function of parent pion energy for different angles away from the pion momentum vector. Figure from Ref. [Duffy:2016owt]. (right) The DUNE near detector flux predictions over a range of off-axis positions for a near detector at downstream of the target station.
The intrinsic neutrino flavor content of the beam varies with off-axis angle. Figure shows the neutrino-mode and anti-neutrino-mode predictions for the four neutrino flavors at the on-axis position, and a moderately off-axis position. At the position, a second, smaller energy peak at approximately is due to the charged kaon neutrino parents.
[The predicted ND energy spectra, on axis and off axis]fig:OffAxisFluxes_1D_AllSpec The predicted muon neutrino energy spectra at two ND positions, on axis and off axis. (a) The predicted neutrino flavor-content of the neutrino-mode (FHC) and anti-neutrino-mode (RHC) beam. (b) The neutrino-mode, muon-flavor predicted flux, separated by the particle that decayed to produce the neutrino. The off-axis spectrum displays a double peak structure due to charged kaon parent decay kinematics. The on-axis kaon-peak occurs at higher neutrino energy and will have a significantly broader energy spread. Top: Beam neutrino flavor content, middle: Beam neutrino flavor content; bottom: Beam neutrino decay-parent species
The same sources of systematic uncertainty that affect the on-axis spectra also modify the off-axis spectra. Figure shows the on-axis and off-axis hadron production and focusing uncertainties. Generally, the size of the off-axis uncertainties is comparable to the on-axis uncertainties and the uncertainties are highly correlated across off-axis and on-axis positions. While the hadron production uncertainties are similar in size, the focusing uncertainties are smaller for the off-axis flux. The systematic effects have different shapes as a function of neutrino energy at different off-axis locations, making off-axis flux measurements useful to diagnose beamline physics. Measuring on-axis and off-axis flux breaks degeneracy between various systematics and allows better flux constraint.
[On-axis and off-axis flux uncertainties]fig:onvsoff_flux_uncertainty
The flux uncertainty for the on-axis flux, and several off-axis positions. Shown is the total hadron production uncertainty and several major focusing uncertainties.
![[Uncaptioned image]](2002.03005v2/graphics/onaxis_vs_offaxis_uncertainties.png)
Alternate Beamline Configurations
Although the LBNF beamline is expected to run for many years in a CP-optimized configuration, it could potentially be modified in the future for other physics goals. For example, it could be altered to produce a higher-energy spectrum to measure tau neutrino appearance. In the standard CP-optimized configuration, we expect about 130 tau neutrino CC interactions per year at the FD, before detector efficiency and assuming beam power. However, replacing the three CP-optimized horns with two NuMI-like parabolic horns can raise this number to approximately tau neutrinos per year. Figure shows the muon neutrino flux for one such configuration. Although the flux in the region critical to measurements is much smaller, the flux above , where the tau neutrino interaction cross section becomes significant, is much larger. Many other energy distributions are possible by modifying the position of the targets and horns. Even altering parameters of the CP-optimized horns offers some variablity in energy spectrum, but the parabolic NuMI horns offer more configurability. Because the LBNF horns are not expected to be remotely movable, such reconfigurations of the beamline would require lengthy downtimes to reconfigure target chase shielding and horn modules.
[Comparison of standard and tau-optimized neutrino fluxes]fig:tau-optimized Comparison of standard and tau-optimized neutrino fluxes. The tau optimized flux was simulated with a proton beam and two NuMI parabolic horns, with the second horn starting downstream from the start of the first horn, and a long, wide carbon fin target starting from the upstream face of the first horn.
4.1.2 Neutrino Interaction Generators
Supernova Neutrinos
The SNB neutrino events were generated using custom code wrapped in a Liquid Argon Software (LArSoft) module. This code simulates CC -40Ar interactions. For each electron neutrino it calculates probabilities to produce a 40K nucleus in different excited states (using a model from [Bhattacharya:1998hc]), randomly selects one, and (with energy levels from [Cameron:2004myb]) produces several de-excitation s and an electron carrying the remaining energy. All particles are produced isotropically, and there is no delay between the electron and corresponding de-excitation s (in this model the 40K nucleus de-excites instantaneously) and they share a vertex, which is simulated with equal probability anywhere in the active volume. The primary neutrino energy distribution used in these samples is the cross-section-weighted energy spectrum obtained from SNOwGLoBES [snowglobes] (using the “GKVM” flux [GKVM]). The SNB neutrino generator also allows to simulate a Poisson-distributed random number of neutrino interactions per event. These samples were simulated with, on average, 2 or 20 neutrinos. In addition, one of the samples was generated with Bq/kg of 39Ar background.
GENIE
The DUNE Monte Carlo (MC) simulation chain is interfaced to the Generates Events for Neutrino Interaction Experiments (GENIE) event generator [Andreopoulos:2009rq]. This is an open-source product of the GENIE collaboration11 1 www.genie-mc.org that provides state-of-the-art modeling of neutrino-nucleus interactions, as well as simulation of several other non-neutrino processes (nucleon decay, neutron-antineutron oscillation, boosted dark matter interactions, hadron and charged lepton scattering off nuclei). The generator product also includes off-the-shelf components (flux drivers and interfaces to outputs of detailed neutrino beamline simulations, detector geometry drivers, and several specialized event generation applications) for the simulation of realistic experimental setups. The GENIE collaboration performs an advanced global analysis of neutrino scattering data, and is leading the development and characterization of comprehensive interaction models. The GENIE comprehensive models and physics tunes which are developed using its proprietary Comparisons and Tuning products, are fully integrated in the GENIE Generator product. Finally, the open-source GENIE Reweight product provides means for propagating modeling uncertainties.
At the time of the TDR writing, the DUNE simulation uses a version in the v2 series of the GENIE generator, which includes empirical comprehensive models, based on home-grown hadronic simulations (AGKY model [Yang:2009zx] for neutrino-induced hadronization and INTRANUKE/hA model [Dytman:2015taa] for hadronic re-interactions) and nuclear neutrino cross sections calculated within the framework of the simple relativistic Fermi gas model [Bodek:1981wr]. Several processes are simulated within that framework with the most important ones, in terms of the size of the corresponding cross section at a few GeV, being: (1) quasi-elastic scattering, simulated using an implementation of the Llewellyn Smith model [LlewellynSmith:1971uhs], (2) multi-nucleon interactions, simulated with an empirical model motivated by the Lightbody model [Lightbody:1988gcu] and using a nucleon cluster model for the simulation of the hadronic system, (3) baryon resonance neutrino-production simulated using an implementation of the Rein-Sehgal model [Rein:1980wg], and (4) deep-inelastic scattering, simulated using the model of Bodek and Yang [Bodek:2002ps]. These comprehensive models, as well as the GENIE procedure for tuning the cross section model in the transition region, have been used for several years and are well understood and documented [Andreopoulos:2009rq]. The actual tune used is the one produced for the analysis of data from the MINOS experiment and, as was already known at that time, it has several caveats as it emphasizes inclusive data and does not address tensions with exclusive data. The future DUNE simulation will be done using the v3 GENIE Generator where improved models and tunes are available.
Besides simulation of neutrino-nucleus interactions, GENIE provides simulation of several BSM physics channels:
BSM: The implementation of a BSM MC simulation has been motivated by several theory studies [Agashe:2014yua, Berger:2014sqa, Kong:2014mia, Cherry:2015oca, Kopp:2015bfa, Necib:2016aez, Alhazmi:2016qcs, Kim:2016zjx]. The current implementation focuses on two models presented in [Berger:2014sqa]. The first has a fermionic DM candidate, a mediator, and velocity independence of the spin-dependent cross section in the non-relativistic limit. The second model has a scalar DM candidate, a mediator, and a velocity dependence of the spin-dependent cross section in the non-relativistic limit.
Nucleon decay: GENIE simulates several nucleon decay topologies. For the initial nuclear state environment and intranuclear hadron transport, it uses the same modeling as it does for neutrino event simulation. In the nucleon decay simulation, the nucleon binding and momentum distribution is simulated using one of the nuclear models implemented in GENIE (typically a Fermi gas model), and it is decayed to one of many topologies using a phase space decay. The decay products are produced within the nucleus and further re-interactions of hadrons are simulated by the GENIE hadron transport models. The simulated nucleon decay topologies are given in Table 6.1, presented in Sec. 6.1.1.
Neutron-antineutron oscillation: GENIE simulates several event topologies that may emerge following the annihilation of the antineutron produced from a bound neutron to antineutron transition. For the initial nuclear state environment and intranuclear hadron transport, the simulation, as in the case of nucleon decay, uses the same modeling as it does for the neutrino event simulation. The simulated reactions are listed in Table in Sec. .
4.1.3 Detector Simulation
The detector simulation consists of particle propagation in the liquid argon using geant and the TPC and photon detector response simulation. This step is done in the common framework LArSoft and is validated by other LArTPC experiments such as ArgoNeuT, MicroBooNE, LArIAT and ProtoDUNE.
LArG4
The truth particles generated in the event generator step are passed to a geant4 v4_10_1_p03-based detector simulation. In this step, each primary particle from the generator and its decay or interaction daughter particles are tracked when they traverse LAr. The energy deposition is converted to ionization electrons and scintillation photons. Some electrons are recombined with the positive ions [Acciarri:2013met, Amoruso:2004dy] while the rest of the electrons are drifted towards the wire planes. The number of electrons is further reduced due to the existence of impurities in the LAr, which is commonly parameterized as the electron lifetime. Unless otherwise specified, an electron lifetime of is assumed in the simulations. The longitudinal diffusion smears the arrival time of the electrons at the wires and the transverse diffusion smears the electron location among neighboring wires. More details regarding the recent measurements of diffusion coefficients can be found in [Li:2015rqa, larpropertiesbnl].
Photon Simulation
When ionization is calculated, the amount of scintillation light is also calculated. The response of the PDs is simulated using a “photon library,” a pre-generated table giving the likelihood that photons produced within a voxel in the detector volume will reach any of the PDs. The photon library is generated using geant4’s photon transport simulation, including Rayleigh scattering length, attenuation length, and reflections off of the interior surface detectors. The library also incorporates the response versus location of the PDs, capturing the attenuation between the initial conversion location of the photon and the SiPMs.
TPC Detector Signal Simulation
When ionization electrons drift through the induction wire planes toward the collection wire plane, current is induced on nearby wires. The principle of current induction is described by the Ramo theorem [Shockley1938, Ramo:1939vr]. For an element of ionization charge, the instantaneous induced current is proportional to the amount of drifted charge :
| (4.1) |
The proportionality factor is a product of the weighting field at the location of the charge and
the charge’s drifting velocity . The weighting field depends on the geometry of
the electrodes. The charge’s drifting velocity is a function of the external E field, which
also depends on the geometry of the electrodes as well as the applied drifting and bias voltages. The current induced at a given electrode and electron drift path ()
sampled over a period of time () is called a “field response function” .
{dunefigure}
[Garfield configuration for simulating the field response functions]
field_resp_geometry
Garfield configuration for simulating the field response functions.
![[Uncaptioned image]](2002.03005v2/graphics/apa_cell.png)
The field response functions for a single ionization electron are simulated with Garfield [garfield].
In the Garfield simulation, a (along the E field or drift direction)
(perpendicular to the field direction and wire orientation) region is configured.
Figure shows a part of the region close to the anode wire planes. There are five wire planes with spacing, referred to as G, U, V, X, and
M with operating bias voltages of , , , , , respectively.
These bias voltages ensure 100% transmission of electrons through the grid plane (G) and the
first two induction planes (U and V) and complete collection by the collection plane X with the main drift
field at . In the simulation, each wire plane contains 101 wires with diameter
separated at wire pitch. The electron drift velocity as a function of electric
field is taken from recent measurements [Li:2015rqa, larpropertiesbnl]. In this simulation, the motion of the positive ions is not included as their drift velocity is about five orders of magnitude slower than that of ionization electrons. In the underground condition, the distortion in E-field caused by the space charge (accumulated positive ions) is expected to be a factor of 100 smaller than that in the surface-operating ProtoDUNE detectors. This leads the maximal position distortion to be less than 3 mm.
{dunefigure}
[Position-dependent (long-range) field response simulated with the Garfield program]
field_resp
Position-dependent (long-range) field response simulated with the Garfield program
for two induction and one collection planes.
The -axis scale is logarithmic (.
The wire of interest
is assumed to locate at position zero. When a cloud of ionization electrons are drifting through a particular transverse position, the waveform on the wire of interest is shown in z-axis along the x-axis (drift time). Obviously, as the magnitude of transverse positions are large, the induced signal becomes small.
![[Uncaptioned image]](2002.03005v2/graphics/field_response_data.png)
Given the above configuration, the field response function can then be calculated in Garfield for each individual wire for an electron starting from any position within the region of simulation. The field response functions for a range 10 wires on both sides of the central wire (covering 21 wires in total) are recorded and stored for later application in the TPC detector signal simulation. Figure shows the simulated field response.
Following the earlier work in MicroBooNE [Adams:2018dra], the TPC detector signal simulation is implemented in the software package Wire-Cell Toolkit [ref:wire_cell_toolkit, ref:full_simulation], which is further interfaced with LArSoft. This simulation procedure has been validated in the MicroBooNE experiment [Adams:2018gbi]. In the following, we summarize the major features. The TPC signal simulation takes input from the Geant4-simulated energy deposition when particles traverse the detector, and outputs digitized waveforms on the FE electronics. A data-driven, analytical simulation of the inherent electronics noise is also performed. Figure shows the example waveform for minimum ionizing particles traveling parallel to the wire plane, but perpendicular to the wire orientation.
[Waveform for minimum ionizing particles traveling parallel to the wire plane]
fig:simevent
Waveform for minimum ionizing particles traveling parallel to the wire plane. For different
wire plane, the corresponding track is assumed to travel perpendicular to the wire orientation.
![[Uncaptioned image]](2002.03005v2/graphics/DUNE_line_source_wf.png)
The signal simulation, i.e., the ADC waveform on a given channel,
| (4.2) |
is conceptually a convolution of five functions:
-
represents the initial distribution of the ionization electrons created by energy depositions in space and time as discussed in Section 4.1.3.
-
represents a function that transforms an initial charge cloud to a distribution of electrons arriving at the wires. Physical processes related to drifting, including attenuation due to impurities, diffusion and possible distortions to the nominal applied E field, are applied in this function.
-
is a family of functions, each is a convolution of the field response functions associated with the sense wire and the element of drifting charge and the electronics response function corresponding to the shaping and amplification of the FE electronics. More details can be found in Section 4.1.4.
-
models the digitization electronics according to a given sampling rate, resolution, and dynamic voltage range and baseline offset resulting in an ADC waveform.
-
simulates the inherent electronics noise by producing a voltage level waveform from a random sampling of a Rayleigh distributed amplitude spectrum and uniformly distributed phase spectrum. The noise spectra used are from measurements with the ProtoDUNE-SP detector after software noise filters, which have excess (non-inherent) noise effects removed.
These functions are defined over broad ranges and with fine-grained resolution. The resolutions are set by the variability (sub millimeter) and extent (several centimeters) of the field response functions and the sampling rate of the digitizer (). Their ranges are set by the size of the detector (several meters) and the length of time over which one exposure is digitized (several milliseconds).
4.1.4 Data Acquisition Simulations and Assumptions
The electrons (5300 electrons per mm for MIP signals) on each wire are converted into raw wire signal (ADC vs time) by convolution with the field response and electronics response, which is implemented in the Wire-Cell Toolkit software package [ref:wire_cell_toolkit]. The ASIC electronics response was simulated with the BNL SPICE [spice] simulation. For most samples, the ASIC gain was set to and the shaping time was set to . There are several considerations in choosing the shaping time setting (out of 0.5, 1.0, 2.0, 3.0 ):
- •
Since the digitization frequency is at 2 MHz, an anti-aliasing filter to ensure the satisfaction of the Nyquist theorem is required. This essentially excludes the shaping time, which is not enough to ensure complete anti-aliasing.
- •
A smaller shaping time in principle leads to a slightly better two-peak separation. However, since the drifting time of ionization electrons through one wire plane is about , the difference between and shaping time is limited.
- •
The electronics noise, as parameterized by the standard deviation of the ADC values on each sample, is slightly lower for the and shaping-time settings than that of the (by about 10% or so).
Te digitization is performed by a 12-bit ADC, which covers a range of about . The number of bits is chosen so that the intrinsic noise introduced by the digitization is negligible. The intrinsic noise level was set to around 2.5 ADC RMS, based on extrapolation from the MicroBooNE experiment [Acciarri:2017sde]. This value was further validated in ProtoDUNE-SP. Figure shows the expected electronics shaping functions.
[ASIC’s electronics shaping functions]
elec_resp
The shaping functions of the Front-End ASIC, shown for the four shaping
time settings at gain.
![[Uncaptioned image]](2002.03005v2/graphics/elec.png)
The PD electronics simulation separately generates waveform for each channel (SiPM) of a PD that has been hit by photons. Every detected photon appears as a single photoelectron pulse (with the shape taken from [http://lss.fnal.gov/archive/2015/pub/fermilab-pub-15-488-nd-ppd.pdf:2015gov]) on a randomly selected channel (belonging to the PD in which the photon was registered). Then dark noise (with the rate of ) and line noise (Gaussian noise with the RMS of ADC counts) are added. Each photon (or a dark-noise pulse) has a probability of appearing as photoelectrons on a waveform (the cross-talk probability is ). The final step of the digitization process is recording only fragments of the full simulated waveform that have a signal in them. This is accomplished by passing the waveform through a hit finder described in Sec. 4.2.2 and storing parts of the waveform corresponding to the hits found.
4.2 Event Reconstruction in the FD
This section describes various reconstruction algorithms used to reconstruct events in the FD TPC. A successful LArTPC reconstruction needs to deliver reconstructed tracks and showers, particle and event identification, particle momentum and event energy. The reconstruction starts with finding signals on each wire above a threshold and building “hits” out of each pulse. All the LArTPC 3D reconstruction algorithms share the same principle. The coordinate is determined by the drift time and the and coordinates are determined by the intersection of two wires on different planes with coincident hits. There are currently three different reconstruction approaches in the DUNE reconstruction package. The 2D 3D reconstruction approach starts with clustering together nearby hits on each plane, followed by the use of time information to match 2D clusters between different planes to form 3D tracks and showers. Examples of this approach include TrajCluster and pandora. The direct 3D approach reconstructs 3D points directly from hits and then proceeds to perform pattern recognition using those 3D points. Examples of this approach include SpacePointSolver and wirecell. The third approach uses a deep-learning technique, known as a convolutional neural network (CNN). There are several tools needed to complete the task of LArTPC reconstruction. These tools include track fitter (Projection Matching Algorithm (PMA) or KalmanFilter), calorimetry, particle ID (PID) and track momentum reconstruction using range for contained tracks or multiple Coulomb scattering for exiting tracks. In addition to the TPC reconstruction, the PD reconstruction provides trigger and information for non-beam physics.
4.2.1 TPC Signal Processing
The raw data are in the format of ADC counts as a function of TPC ticks ( on each channel. The signal has a unipolar shape for a collection wire and a bipolar shape for an induction wire. The first step in the reconstruction is to reconstruct the distribution of ionization electrons arriving at the anode plane. This is achieved by passing the raw data through a deconvolution algorithm. In real detectors, excess noise may exist and require removal through a dedicated noise filter [Acciarri:2017sde].
The deconvolution technique was introduced to LArTPC signal processing in the context ArgoNeuT data analysis [Baller:2017ugz]. The goal of the deconvolution is to “remove” the impact of field and electronics responses from the measured signal along the time dimension in order to reconstruct the number of ionized electrons. This technique has the advantages of being robust and fast, and is an essential step in the overall drifted-charge profiling process. This 1D deconvolution procedure was improved to a 2D deconvolution procedure by the MicroBooNE collaboration [Adams:2018dra, Adams:2018gbi], which further took into account the long-range induction effects in the spatial dimension. Two-dimensional software filters (channel and time) are implemented to suppress high-frequency noise after the deconvolution procedure. For induction plane signals, regions of interest (ROIs) are selected to minimize the impact of electronics noise. More details of this algorithm can be found in [Adams:2018dra].
This procedure, implemented in the Wire-Cell toolkit software package [ref:wire_cell_toolkit], has been used in the TPC signal processing in ProtoDUNE-SP. Figure shows an example induction U-plane waveform before and after the signal processing procedure. The bipolar shape is converted into a unipolar shape after the 2D deconvolution. Figure shows the full 2D image of induction U-plane signal from a ProtoDUNE-SP event [ref:pdune_signal_processing]. The measured signal (left) has a bipolar shape with red (blue) color representing positive (negative) signals. The deconvolved signal after the 2D deconvolution procedure (right) represents the reconstructed distribution of ionization electrons arriving at the anode wire plane. The deconvolved signal becomes unipolar, and the long-range induction effect embedded in the field response is largely removed.
[Measured and deconvolved waveform from an induction U-plane channel of ProtoDUNE-SP] pDUNE_sp_wf An example of measured (black) and deconvolved waveform from an induction U-plane channel of ProtoDUNE-SP before and after the signal processing procedure. For the measured waveform, the unit is ADC. For the deconvolved waveform, the unit is number of electrons after scaling down by a factor of 125. Bipolar signal shapes are converted into unipolar signal shapes after 2D deconvolution.
[Raw and deconvolved induction U-plane signals from a ProtoDUNE-SP event]
pDUNE_sp_example
Comparison of raw (left) and deconvolved induction U-plane signals (right) before and after
the signal processing procedure from a ProtoDUNE-SP event. The bipolar shape with red (blue) color representing
positive (negative) signals is converted to the unipolar shape after the 2D deconvolution.
![[Uncaptioned image]](2002.03005v2/protodune_raw_u.png)
![[Uncaptioned image]](2002.03005v2/protodune_decon_u.png)
4.2.2 Hit and Space-Point Identification
Gaussian Hit Finder
The reconstruction algorithms currently employed by LArSoft are based on finding hits on the deconvolved waveforms for each plane. A key assumption is that the process of deconvolution will primarily result in Gaussian-shaped charge deposits on the waveforms and this drives the design of the Gaussian hit finder module. Generally, the module loops over the input deconvolved waveforms and handles each in three main steps: first it searches the waveforms for candidate pulses, it then fits these candidates to a Gaussian shape and, finally, it places the resulting hit in the output hit collection. Not all charge deposits will be strictly Gaussian shaped, for example a track can emit a delta ray and it can take several wire spacings before the two charge depositions are completely separated. Alternatively, a track can have a trajectory at large angles to the sense wire plane creating a charge deposition over a large number of waveform ticks. The candidate peak-finding stage of the hit finder attempts to resolve the individual hits in both of these cases, still under an assumption that the shape of each individual charge deposition is Gaussian. If this results in candidate peak trains that are “too long” then special handling breaks these into a number of evenly-spaced hits and bypasses the hit-fitting stage.
Figure displays the results of the Gaussian hit finder for the case of two or three hits only barely separated in ProtoDUNE-SP data. In this figure the deconvolved waveform is shown in blue, the red line represents the fit of the candidate peak to two or three Gaussian shapes, the crosses represent the centers of the fit peaks, the pulse heights above the waveform baseline and their fit widths.
[An example of reconstructed hits in ProtoDUNE-SP data]
pDUNE_sp_hits
An example of reconstructed hits in ProtoDUNE-SP data. The deconvolved waveform is shown in blue, the red line represents the fit of the candidate peak to two or three Gaussian shapes, the crosses represent the centers of the fit peaks, the pulse heights above the waveform baseline and their fit widths.
![[Uncaptioned image]](2002.03005v2/graphics/hits.png)
Space Point Solver


(a) All coincidences
(b) Without regularization

 (c) With regularization
(d) True charge distribution
(c) With regularization
(d) True charge distribution
The SpacePointSolver algorithm aims to transform the three 2D views provided by the wire planes into a single collection of 3D “space points.”
First, triplets of wires are found with hits that are coincident in time within a small window (corresponding to in the drift direction) and where the crossing positions of the wires are consistent within . In some cases a collection wire hit may have only a single candidate pair of induction hits and the space point can be formed immediately. Often though, there are multiple candidate triplets, for example when two tracks are overlapped as seen in one view.
SpacePointSolver resolves these ambiguities by distributing the charge from each collection wire hit between the candidate space points so as to minimize the deviations between the expected and observed charges of the induction wire hits
| (4.3) |
where is the charge observed in the induction hit, is the solved charge at space point , and encodes whether space point is coincident in space and time with wire hit .
The minimization is subject to the condition that each predicted charge , and that the total predicted charge for each collection wire hit exactly matches observations:
| (4.4) |
where is the charge observed on the collection wire, and encodes the coincides of space point charges with the collection wires.
The problem as formulated is convex and can thus be solved exactly in a deterministic fashion. A single extra term can be added to the expression while retaining this property:
| (4.5) |
By setting larger for neighboring points this term acts as a regularization such that solutions with a denser collection of space points are preferred. The function is chosen empirically to have an exponential fall-off with constant .
Figure 4.1 shows the performance of this algorithm on a sample FD MC event, demonstrating good performance at eliminating spurious coincidences, and the importance of the regularization term.
SpacePointSolver was developed with the intention of acting as the first stage of a fully 3D reconstruction for FD neutrinos, but it has been successfully put to use in a more restricted role to solve the disambiguation problem in ProtoDUNE. The full problem is solved, but for this application the information retained is restricted to the drift volume to which the corresponding space points for each induction hit are assigned. This technique correctly resolves more than 99% of hits while requiring less CPU time than the standard disambiguation algorithm.
The outcome of the SpacePointSolver reconstruction, which associates a 3D point with three hits on three wire planes, is used in the process of disambiguation for ProtoDUNE and has been tested and used as well for FD. This process of disambiguation determines which wire segment corresponds to the energy deposited by the particle in the TPC, since the induction wires are wrapped in the FD TPC design in order to save cost on electronics and minimize dead regions between APA s, which as a consequence produces that multiple induction wire segments will be read out by the same electronic channel.
4.2.3 Hit Clustering, Pattern Recognition and Particle Reconstruction
There are different approaches for hit clustering, pattern recognition and particle reconstruction that are being explored in the context of DUNE FD interactions. The main ones are described in this section.
Line Cluster
The intent of the Line Cluster algorithm is to construct 2D line-like clusters using local information. The algorithm was originally known as Cluster Crawler. The “Crawler” name is derived from the similarity of this technique to “gliders” in 2D cellular automata. The concept is to construct a short line-like “seed” cluster of proximate hits in an area of low hit density where hit proximity is a good indication that the hits are indeed associated with each other. Additional nearby hits are attached to the leading edge of the cluster if they are similar to the hits already attached to it. The conditions are that the impact parameter between a prospective hit and the cluster projection is similar to those previously added and the hit charge is similar as well. These conditions are moderated to include high charge hits that are produced by large fluctuations and the rapid increase in at the end of stopping tracks while rejecting large charge hits from -rays. Seed clusters are formed at one end of the hit collection so that crawling in only one direction is sufficient. LineCluster uses disambiguated hits as input and produces a new set of refined hits. More details on the Line Cluster algorithm can be found in [ref:linecluster].
TrajCluster
TrajCluster reconstructs 2D trajectories in each plane. It incorporates elements of pattern recognition and Kalman Filter fitting. The concept is to construct a short “seed” trajectory of nearby hits. Additional nearby hits are attached to the leading edge of the trajectory if they are similar to the hits already attached to it. The similarity requirements use the impact parameter between the projected trajectory position and the prospective hit, the hit width and the hit charge. This process continues until a stopping condition is met such as lack of hits, an abnormally high or low charge environment, or encountering a 2D vertex or a Bragg peak.
2D vertices are found between trajectories in each plane. The set of 2D vertices is matched between planes to create 3D vertices. A search is made of the “incomplete” 3D vertices, those that are only matched in two planes, to identify trajectories in the third plane that were poorly reconstructed.
Two recent additions to TrajCluster are matching trajectories in 3D and tagging of shower-like trajectories. More details on the TrajCluster algorithm can be found in [ref:trajcluster].
Pandora
The Pandora software development kit [Marshall:2015rfa] was created to address the problem of identifying energy deposits from individual particles in fine-granularity detectors, using a multi-algorithm approach to solving pattern-recognition problems. Complex and varied topologies in particle interactions, especially with the level of detail provided by LArTPCs, are unlikely to be solved successfully by a single clustering algorithm. Instead, the Pandora approach is to break the pattern recognition into a large number of decoupled algorithms, where each algorithm addresses a specific task or targets a particular topology. The overall event is then built up carefully using a chain of many tens of algorithms. The Pandora multi-algorithm approach has already been applied to LArTPC detectors, and has been successfully used in different analyses for the automated reconstruction of cosmic-ray muons and neutrino interactions in the MicroBooNE experiment [Acciarri:2017hat] as well as test beam interactions in the ProtoDUNE-SP detector (see Section 4.3.3).
The input to the Pandora pattern recognition is a list of reconstructed and disambiguated 2D hits, alongside detector information (such as dimensions, unresponsive or dead material regions). The specified chain of pattern-recognition algorithms is applied to these input hits (once translated into native Pandora 2D hits). The results of the pattern recognition are persisted in the art/LArSoft framework, with the major output being a list of reconstructed 3D particles (termed particle flow particles (PFParticles)). A PFParticle corresponds to a distinct track or shower in the event, and has associated objects such as collections of 2D hits for each view (Clusters), 3D positions (SpacePoints) and a reconstructed Vertex position that defines its interaction point or first energy deposit. Navigation along PFParticle hierarchies is achieved using the PFParticle interface, which connects parent and daughter PFParticle s, providing a particle flow description of the interaction. The identity of each particle is currently not reconstructed by Pandora, but PFParticle s are instead characterized as track-like or shower-like based on their topological features.
The main stages of the Pandora pattern recognition chain are outlined below, and are illustrated in Figure . Note that both the individual pattern recognition algorithms and the overall reconstruction strategy are under continual development and will evolve over time, with a current emphasis on the inclusion of machine-learning approaches to drive decisions in some key algorithms. The current chain of pattern-recognition algorithms has largely been tuned for neutrino interactions from the Fermilab Booster Neutrino Beam; however, the algorithms are designed to be generic and easily reusable, and they are in the process of being adapted for neutrino interactions in the energy regime of DUNE. A more detailed description of the algorithms can be found in [Acciarri:2017hat].
- 1.
Input hits: The input list of reconstructed and disambiguated 2D hits are translated into native Pandora 2D hits and separated into the different views and into “drift volumes”, defined as the regions of the detector with a common drift readout.
- 2.
2D track-like clusters: The first phase of the Pandora pattern recognition is track-oriented 2D clustering, creating “proto-clusters” that represent continuous, unambiguous lines of 2D hits. This early clustering phase is careful to ensure that the proto-clusters have high purity (i.e., represent energy deposits from exactly one true particle) even if this means they are initially of low completeness (i.e., only contain a small fraction of the total hits within a single true particle). A series of cluster-merging and cluster-splitting algorithms then examine the 2D proto-clusters and try to extend them, making decisions based on topological information, aiming to improve completeness without compromising purity.
- 3.
3D vertex reconstruction: The neutrino interaction vertex is an important feature point. Once identified, any 2D clusters can be split at the projected vertex position, reducing chances of merging particles in any view. Cluster-merging operations also take proximity to the vertex into account, in order to protect primary particles emerging from the vertex region, and ensure good reconstruction performance for interactions with many final-state particles. Pairs of 2D clusters from different views are first used to produce lists of possible 3D vertex positions. These candidate vertices are examined and scored, and the best vertex is selected. Pandora has developed different algorithms for the selection of the neutrino vertex, including the use of machine-learning approaches in MicroBooNE. Similar approaches can be harnessed in the future for interactions in the FD, where a score-based approach is currently used.
- 4.
3D track reconstruction: The aim of the 3D track reconstruction is to identify the combinations of 2D clusters (from the different views) that represent the same true, track-like particle. These 2D clusters are formally associated by the construction of a 3D track particle. During this process, 3D information can also be used to improve the quality of the 2D clustering. A Pandora algorithm considers all possible combinations of 2D clusters, one from each view, and builds (what is loosely termed) a rank-three tensor to store a comprehensive set of cluster-consistency information. This tensor can be queried to identify and understand any cluster-matching ambiguities. 3D track particles are first built for any unambiguous combinations of 2D clusters. Cases of cluster-matching ambiguities are then addressed, with iterative corrections to the 2D clustering being made to resolve the ambiguities and so enable 3D particle creation.
- 5.
2D and 3D shower reconstruction: A series of topological metrics (additional use of some calorimetric information would be desirable in the future) are used to characterize each 2D cluster as track-like or shower-like. This information is analyzed to identify the longest shower-like clusters, which form the “seeds” or “spines” for 2D and 3D shower reconstruction. A recursive algorithm is used to add shower branches onto each top-level shower seed, then branches onto branches, etc. The 2D showers are then matched between views to form 3D showers, reusing ideas from the 3D track-matching procedure.
- 6.
2D and 3D particle refinement and event building: Following the 3D track and shower reconstruction, a series of algorithms is used to improve the completeness of the reconstructed particles by merging together any nearby particles that are just fragments of the same true particle. Both 2D and 3D approaches are used, where a typical approach uses combinations of 2D clusters (from different views) to identify features in 3D, or projects 3D features into each of the 2D views. This is a powerful demonstration of the Pandora rotational coordinate transformation system, which allows seamless use of 2D and 3D information to drive pattern-recognition decisions. Finally, 3D space points are created for each 2D input hit, and the 3D particle trajectories are used to organize the reconstructed particles into a hierarchy. Final-state particles can be navigated via parent-daughter links, thus reconstructing their subsequent interactions or decays. For neutrino interactions, a top-level reconstructed neutrino particle is created; it represents the primary particle in the hierarchy linking together the daughter final-state particles and provides the information about the neutrino interaction vertex.
[Main stages of the PANDORA pattern recognition chain] reco_steps Illustration of the main stages of the Pandora pattern recognition chain: (1) Input Hits; (2) 2D track-like cluster creation and association; (3) 3D vertex reconstruction; (4) 3D track reconstruction; (5) Track/Shower separation; (6) 2D and 3D particle refinement and event building.
The algorithms forming the stages described above can be used in different ways, thanks to the multi-algorithm approach. Currently, two Pandora reconstruction paths (Pandora Cosmic and Pandora Neutrino) have been created, using chains of tens of algorithms each (note that over 130 algorithms and tools are used in total). Although many algorithms are shared between the two paths, the overall algorithm selection results in different key features:
- 1.
Pandora Cosmic: Strongly track-oriented, optimized for the reconstruction of cosmic-ray muons and their daughter (shower-like) delta rays.
- 2.
Pandora Neutrino: Optimized for the reconstruction of neutrino or test beam particle interactions, carefully building the event using the reconstructed interaction vertex (protecting particles emerging from it) and including a careful treatment of tracks versus showers.
These two chains of algorithms are harnessed together to provide a consolidated output in the case of surface detectors exposed to cosmic rays, such as MicroBooNE and ProtoDUNE-SP (without significant cosmic-ray background, only the Pandora Neutrino algorithm chain is necessary for the FD). The overall reconstruction strategy in such detectors is illustrated in Figure . It starts by running the Pandora Cosmic reconstruction on the entire collection of input hits, then identifies “clear” cosmic rays. This identification uses a geometrical approach to tag through-going cosmic rays and examines the consistency of the cosmic rays with the appropriate to the neutrino beam spill. Clear cosmic rays are output at this stage. For the remaining ambiguous hits, however, additional stages are required. A slicing process is applied to the remaining hits, dividing them into smaller regions (slices) that represent separate, distinct interactions. Each slice is reconstructed using both the Pandora Neutrino and Pandora Cosmic reconstruction chains and the results are compared directly to identify whether the slice corresponds to a cosmic ray or a neutrino interaction (in the case of MicroBooNE) or test beam interaction (in the case of ProtoDUNE-SP). The consolidated event output is formed of three classes of reconstructed particles: (1) clear cosmic rays, (2) cosmic rays that are spatially and temporally consistent with being a neutrino interaction in the detector (remaining cosmic-rays) and (3) candidate neutrino or test beam interactions.
[Schema of PANDORA consolidated output and reconstruction strategy for surface LArTPCs]
consolidated_reco
Schema of the Pandora consolidated output and overall reconstruction strategy for surface LArTPCs such as MicroBooNE and ProtoDUNE-SP. See text for more details.
![[Uncaptioned image]](2002.03005v2/graphics/./Pandora/NewConsolidatedDiagram.png)
Of particular importance in this overall reconstruction strategy is the neutrino (MicroBooNE) or test beam particle (ProtoDUNE-SP) identification tool. This tool is responsible for deciding whether to output the cosmic ray or neutrino (or test beam) reconstruction outcomes for a given slice. For ProtoDUNE-SP, this decision is based on the output from adaptive boosted decision trees (BDTs), trained to distinguish between cosmic-ray and test beam particles, which has proved to be highly efficient across the momentum range of ProtoDUNE-SP data (see Section 4.3.3).
The performance obtained with the current algorithms are shown in Section 4.3, both for the FD and ProtoDUNE-SP. As previously mentioned, both the individual pattern recognition algorithms and the overall reconstruction strategy are under continual development. Many algorithms still require explicit tuning for the DUNE energy ranges, and new algorithms, designed specifically for DUNE, will be added to the multi-algorithm pattern recognition. The performance presented in this document therefore represents a current snapshot and is expected to improve with future dedicated work.
Projection Matching Algorithm
PMA was primarily developed as a technique of 3D reconstruction of individual particle trajectories (trajectory fit) Ref [Antonello:2012hu]. PMA was designed to address a challenging issue of transformation from a set of independently reconstructed 2D projections of objects into a 3D representation. Reconstructed 3D objects are also providing basic physics quantities like particle directions and evolution along the trajectories. PMA uses as its input the output from 2D pattern recognition: clusters of hits. For the purposes of the DUNE reconstruction chain the Line Cluster algorithm (Section 4.2.3) is used as input to PMA, however the use of hit clusters prepared with other algorithms may be configured as well. As a result of 2D pattern recognition, particles may be broken into several clusters of 2D projections, fractions of particles may be missing in individual projections, and clusters obtained from complementary projections may not cover corresponding sections of trajectories. Such behavior is expected since ambiguous configurations of trajectories can be resolved only if the information from multiple 2D projections is used. Searching for the best matching combinations of clusters from all 2D projections was introduced to the PMA implementation in the LArSoft framework. The algorithm also attempts to correct hit-to-cluster assignments using properties of 3D reconstructed objects. In this sense PMA is also a pattern-recognition algorithm. The underlying idea of PMA is to build and optimize objects in 3D space (formed as polygonal lines with the number of segments iteratively increased) by minimizing the cost function calculated simultaneously in all available 2D projections. Several features were developed in LArSoft’s PMA implementation to address detector-specific issues like stitching the particle fragments found in different TPCs or performing disambiguation at the 3D reconstruction stage. Since algorithms existing within or interfaced to the LArSoft framework (see Section 4.2.3) can provide pattern reconstruction results that include the particle hierarchy description, the mode for applying PMA to calculate trajectory fits alone was developed. In this mode the collections of clusters forming particles are taken from the “upstream” algorithm and hit-to-cluster associations remain unchanged.
Wire Cell
[Overview of wire-cell reconstruction paradigm]
wire-cell-overview
Overview of the Wire-Cell reconstruction paradigm, taken from [ref:wc_talk].
See text for more details.
![[Uncaptioned image]](2002.03005v2/graphics/wire-cell-overview.png)
Wire-Cell is a new reconstruction package under development. The current status of this reconstruction paradigm is shown in Figure . The simulation of the induction signal in a LArTPC and the overall signal processing process, which are general to all reconstruction methods, are described in Sections 4.1.3 and 4.2.1, respectively. The subsequent reconstruction in Wire-Cell adopts a different approach from the aforementioned algorithms. Instead of directly performing pattern recognition on each of the 2D views (drift time versus wire number), 3D imaging of events is obtained with time, geometry, and charge information. This step is independent from the event topologies, and the usage of the charge information takes advantage of a unique feature of the projection views, as each of the wire plane detects the same amount of the ionization electrons under transparency condition. The strong requirement of the time, geometry, and charge information provides a natural way to suppress electronic noise while combining with successful signal processing maintains high hit efficiency. Details of this step is described in [Qian:2018qbv]. The subsequent reconstruction involves the object clustering and TPC and light matching, which has been crucial for selecting neutrino interactions in the MicroBooNE experiment [uboone_wc_note]. The current focus of the Wire-Cell algorithm development is on the trajectory and fitting, which aims at enabling precision particle identification in a LArTPC. Development of 3D pattern recognition also needs to be revisited before reaching a complete reconstruction chain.
[3D display of interaction in ProtoDUNE-SP]
wire-cell-bee
This 3D display shows the full size of the ProtoDUNE-SP detector (gray box) and
the direction of the particle beam (yellow arrow). Particles from other sources (such as cosmic rays)
can be seen throughout the white box, while the red box highlights the region of interest:
in this case, an interaction resulting from the 7 GeV beam particle through the detector.
The 3D points are obtained using the Space Point Solver reconstruction algorithm. This event
can be accessed through interactive web-based event display Bee at https://www.phy.bnl.gov/twister/bee/set/protodune-gallery/event/0/.
![[Uncaptioned image]](2002.03005v2/graphics/bee_event.png)
The Wire-Cell team also created an advanced web-based 3D event display, “Bee” [wire-cell-bee], to aid the reconstruction development and provide interactive visualizations to end users. Bee, together with 2D Magnify event display tools, have played important roles in the development of various reconstruction algorithms, including signal processing, 3D event imaging, object clustering, TPC and light matching, and trajectory and fitting. The Bee event display was also used during the ProtoDUNE data-taking period to stream real-time reconstructed events to the users. Figure shows an example of a data event from the ProtoDUNE-SP detector [ref:wc_bee]. The full video of this event can be found in [ref:bee_video].
Deep Learning
Deep learning methods are used in two main areas of the DUNE event reconstruction. Both of these algorithms are based on CNNs. In recent years CNNs have become the method of choice for many image recognition tasks in commerce and industry, and lately have been applied to high energy physics. The CNNs contain a series of filters that are applied to the input detector data images in order to extract the features required to classify the images.
CNN for track and shower separation
The hit-level CNN aims to classify each reconstructed hit as either track-like or shower-like by looking at the local region surrounding the hit in (charge, time) coordinates. The CNN is trained using a large number of simulated images with the known true origin of the energy deposits. Once trained, the CNN provides the track-like or shower-like classification for each hit object in the event. This algorithm is applied to each readout view in each TPC separately.
CNN for event selection
The algorithm used for the classification of neutrino interaction types is called the convolutional visual network (CVN) and is based on a CNN. The primary goal of the CVN is to provide a probability for each neutrino interaction to be CC , CC , CC or NC. The CVN takes three pixel images of the neutrino interactions as input, one from each view. The images contain the charge and the peak time of the reconstructed hits and does not use any information beyond the hit reconstruction. The CVN is discussed in more detail in Chapter 5.
4.2.4 Calorimetric Energy Reconstruction and Particle Identification
As charged particles traverse a LAr volume, they deposit energy through ionization and scintillation. It is important to measure the energy deposition, as it provides information on particle energy and species. The algorithm for reconstructing the ionization energy in LArSoft is optimized for line-like tracks and is being extended to more complicated event topology such as showers. The algorithm takes all the hits associated with a reconstructed track and for each hit, it converts the hit area or amplitude, in ADC counts, to the charge , in units of , on the wire using an ADC-to- conversion factor that was determined by muons or test stand measurements. To account for the charge loss along the drift due to impurities, a first correction is applied to to get the free charge after recombination , where is the electron drift time for the hit and is the electron lifetime measured by the muons or purity monitors. The charge is divided by the track pitch , which is defined as wire spacing divided by the cosine of the angle between the track direction and the direction normal to the wire direction in the wire plane, to get the for the hit. Finally, to account for charge loss due to recombination, also known as “charge quenching,” a second correction is applied to convert to based on the modified Box’s model [Acciarri:2013met] or the Birks’s model [Amoruso:2004dy]. The total energy deposition from the track is obtained by summing the from each hit: .
If the incident particle stops in the LArTPC active volume, the energy loss as a function of the residual range (), the path length to the endpoint of the track, is used as a powerful method for particle identification. There are two methods in LArSoft to determine particle species using calorimetric information. The first method calculates four values for each track by comparing measured versus to hypotheses for the proton, charged kaon, charged pion and muon, and identifies the track as the particle that gives the smallest value. The second method calculates the quantity [Acciarri:2013met], which is defined to be the average of over all track points where the residual range is less than . The particle species can be determined by making a selection on the value.
4.2.5 Optical Reconstruction
Optical Hit Finder
The first step of the DUNE optical reconstruction is reading individual waveforms from the simulated PD electronics and finding optical hits – regions of the waveforms containing pulses. The optical hit contains the optical channel (SiPM) that the hit was found on, time corresponding to the hit, its width, area, amplitude, and number of photoelectrons.
The current DUNE optical-hit-finder algorithm then searches for regions of the waveform exceeding a certain threshold ( ADC counts), checking whether that region is wider than optical time ticks22 2 The current simulation assumes a digitizer like that used in ProtoDUNE, though the final far detector electronics will use an digitizer., and, if it is, calculating the aforementioned optical-hit parameters for the region (including parts of the waveform around it that have ADC values greater than ) and recording it as an optical hit. The number of photoelectrons is calculated by dividing the full area of the hit by the area of a single-photoelectron pulse. The pedestal is assumed to be constant and is specified in the hit finder as ADC counts (always correct for the MC).
Optical Flash Finder
After optical hits are reconstructed, they are grouped into higher-level objects called optical flashes. The optical flash contains the time and time width of the flash, its approximate and coordinates (and spatial widths along those axes), its location and size in the wire planes, the distribution of photoelectrons across all PDs, and the total number of photoelectrons in the flash, among other parameters.
The flash-finding algorithm searches for an increase in PD activity (the number of photoelectrons) in time using information from optical hits on all photon detectors. When a collection of hits with the total number of photoelectrons greater than or equal to is found, the algorithm begins creating an optical flash. It starts with the largest hit and adds hits from the found hit collection that lie closer than half the combined widths of the flash under construction a nd the hit being added to it. The flash is stored after no more hits can be added to it and if it has more than two photoelectrons.
The algorithm also estimates spatial parameters of the optical flash by calculating the number-of-photoelectron-weighted mean and root mean square of locations of the optical hits (defined as centers of PDs where those hits were detected) contained in the flash.
4.3 Reconstruction Performance
An automated reconstruction of the neutrino interaction events in DUNE, often complex topologies with multiple final state particles, is a significant challenge. The current chain of Pandora pattern recognition algorithms has been tuned for neutrino interactions from the Fermilab Booster Neutrino Beam, and is in the process of being adapted for the wide range of energies of the DUNE FD. Despite this, and thanks to the reusability of Pandora algorithms for different single phase LArTPC detectors, good performance is already achieved with this first-pass pattern recognition, and output from Pandora is used in the computation of the energy reconstruction in the oscillation analysis. Significant improvements are expected in the upcoming years with a more dedicated tune of the current algorithms, and the development of new ones, as needed.
The current reconstruction performance, evaluated using metrics introduced in 4.3.1, is presented for simulated neutrino interactions in a SP FD module in 4.3.2, and for simulated and real data test beam events in ProtoDUNE-SP in 4.3.3. These results outline the baseline performance on which improvements will continue to be made in the next years. In addition, examples of current high-level reconstruction performance are presented in 4.3.4.
4.3.1 Pandora Performance Assessment
The performance of the Pandora pattern recognition is assessed by matching reconstructed PFParticle s to the simulated Monte Carlo Particle (MCParticle) s. These matches are used to evaluate the efficiency with which MCParticle s are reconstructed as PFParticle s, and to calculate the completeness and purity of each reconstructed PFParticle.
The following procedure is used to match reconstructed PFParticle s with simulated MCParticle s:
- •
Selection of MCParticle s: The full hierarchy of true particles is extracted from the simulated neutrino interaction. A list of “target” particles is then compiled by navigating through this hierarchy and selecting the final-state “visible” particles producing a minimum number of reconstructed hits (allowed to be: , , , , , )33 3 A minimum number of 15 reconstructed hits, with at least two views with 5 or more hits, is required in the definition of “target” MCParticle. This corresponds to true momentum thresholds of approximately 60 MeV for muons and 250 MeV for protons in the MicroBooNE simulation [Acciarri:2017hat]. Note that this selection is purely for performance assessment purposes, and that particles with fewer hits might still be created by Pandora.. Any downstream daughter particles are folded in these target particles.
- •
Matching of reconstructed 2D hits to MCParticle s: Each reconstructed 2D hit is matched to the target MCParticle responsible for depositing the most energy within the region of space covered by the hit. The collection of 2D hits matched to each target MCParticle is known as its “true hits”.
- •
Matching of MCParticle s to reconstructed PFParticle s: The reconstructed PFParticle s are matched to target MCParticle s by analyzing their shared 2D hits. A PFParticle and MCParticle will be matched if the MCParticle contributes the most hits to the PFParticle, and if the PFParticle contains the largest collection of hits from the MCParticle. The matching procedure is iterative, such that once each set of matched particles has been identified, these PFParticle s and MCParticle s are removed from consideration when making the next set of matches.
Using the output of this matching scheme, the following performance metrics can be calculated:
- •
Efficiency: Fraction of MCParticle s with a matched PFParticle,
- •
Completeness: The fraction of 2D hits in a MCParticle that are shared with its matched reconstructed PFParticle, and
- •
Purity: The fraction of 2D hits in a PFParticle that are shared with its matched MCParticle.
4.3.2 Reconstruction Performance in the DUNE FD
The performance of the Pandora pattern recognition has been evaluated using a sample of accelerator neutrino and antineutrino interactions simulated using the reference DUNE neutrino energy spectrum and the detector module geometry. The breakdown of the different interaction channels as a function of the true neutrino energy in the samples used is presented in Fig. , for the events in the neutrino mode in which at least one “target” reconstructable MCParticle is created and therefore evaluated. The following plots show that a good efficiency has already been achieved, and indicate particular regions and channels in which improvements can be made.
[Interaction channels vs true energy; simulated events used to assess performance]
breakdown_nuenergy
Breakdown of the different interaction channels as a function of the true neutrino energy in the samples used in the assessment of reconstruction performance, for the simulated events in the neutrino mode in which at least one “target” reconstructable MCParticle particle is created and therefore evaluated. Percentages indicate the fraction of each channel in the total number of events.
![[Uncaptioned image]](2002.03005v2/graphics/./Pandora/MCC11_NuE.png)
[Reconstruction efficiency of PANDORA pattern recognition for a range of final-state particles at the FD]
pandora_particle_efficiency
The reconstruction efficiency of the Pandora pattern recognition obtained for a range of final-state particles produced in all types of accelerator neutrino interactions except deep inelastic ones at DUNE FD. The efficiency is plotted as a function of the total number of 2D hits associated with the final-state MCParticles (summed across all views) on the top row, and as a function of the true momentum of the particle on the bottom row. Plots are shown for track-like particles (left) and shower-like particles (right) of each type leading in the event.
![[Uncaptioned image]](2002.03005v2/graphics/./Pandora/MCC11_ALL_BUT_DIS_HitsEff_Tracks_new.png)
![[Uncaptioned image]](2002.03005v2/graphics///Pandora/MCC11_ALL_BUT_DIS_HitsEff_Showers_new.png)
![[Uncaptioned image]](2002.03005v2/graphics/./Pandora/MCC11_ALL_BUT_DIS_MomentumEff_Tracks_new.png)
![[Uncaptioned image]](2002.03005v2/graphics/./Pandora/MCC11_ALL_BUT_DIS_MomentumEff_Showers_new.png)
Figure shows the reconstruction efficiency as a function of the number of total true 2D hits and as a function of the true momentum for a range of final-state particles. The typical reconstruction efficiencies obtained for track-like MCParticle s (, , ) rise from for simulated particles depositing 100 hits to for particles with 1000 hits. It should be emphasized that inefficiencies almost always result from accidental merging of multiple nearby true particles, rather than an inability to cluster hits from a true particle. The reconstruction efficiency for shower-like MCParticle s (,) is a bit lower than the equivalent for track-like particles at lower number of hits, but comparable with 100 hits.
Figure shows distributions of completenesses and purities for a range of final-state particles. In the case of final-state track-like particles, good completeness and purity are achieved, indicating that the track-based pattern recognition algorithms currently provide a high-quality reconstruction. It can be seen that final-state shower-like particles are typically reconstructed with high purity, but somewhat lower completeness, indicating that, although the shower reconstruction is fairly good already, there is room for addition of new algorithms specifically targeting an increase in shower completeness at DUNE.
For deep inelastic interactions, in which tens of final-state particles may be produced, a breakdown such as in Figures and is less representative and informative (however, no significant impact has been observed when adding DIS events in the calculation of such quantities). Instead, Figure presents an assessment of the reconstruction of such events by comparing the number of reconstructed particles as a function of the number of true final-state particles in the event for NC (left) and CC (middle) deep inelastic interactions. These distributions are more populated in the diagonal, as they should be for perfect 1:1 reconstruction, indicating a good level of reconstruction of such events up to >5 final-state particles. In addition, the number of reconstructed particles matching the leading lepton in CC deep inelastic interactions is also presented (right), which shows a consistently predominant single match for the leading lepton.
Figure shows distributions of the displacements , , and between the reconstructed and simulated neutrino interaction positions for all types of accelerator neutrino events. It can be seen that, for the vast majority of events, the reconstructed neutrino interaction vertex lies within cm of the MC truth in , and . While the and distributions are both symmetrical and sharply peaked around the origin, a small forward bias can be seen in the distribution. The reason for this bias comes from the fact that the neutrino interaction will be boosted in the forward direction, so vertex candidates are more likely created at than .
[Completeness and purities for a range of final-state track-like and shower-like particles]
pandora_completeness_purity
Distributions of completenesses (top) and purities (bottom) for a range of final-state particles divided into track-like (left) and shower-like (right), produced in all types of accelerator neutrino interactions except deep inelastic ones at DUNE FD.
![[Uncaptioned image]](2002.03005v2/graphics/./Pandora/MCC11_ALL_BUT_DIS_Completeness_Tracks_new.png)
![[Uncaptioned image]](2002.03005v2/graphics/./Pandora/MCC11_ALL_BUT_DIS_Completeness_Showers_new.png)
![[Uncaptioned image]](2002.03005v2/graphics/./Pandora/MCC11_ALL_BUT_DIS_Purity_Tracks_new.png)
![[Uncaptioned image]](2002.03005v2/graphics/./Pandora/MCC11_ALL_BUT_DIS_Purity_Showers_new.png)
[Number of reconstructed particles vs number of true final-state particles, CC and NC DIS events] pandora_dis Distributions of number of reconstructed particles as a function of number of true final-state particles in deep inelastic events for neutral-current (left) and charged-current (right) interactions. In addition, the number of reconstructed particles matching the leading lepton in charged-current deep inelastic interactions is also presented (bottom).
![[Uncaptioned image]](2002.03005v2/graphics/./Pandora/MCC11_NCDIS_new.png)
![[Uncaptioned image]](2002.03005v2/graphics/./Pandora/MCC11_CCDIS_new.png)
![[Uncaptioned image]](2002.03005v2/graphics/./Pandora/MCC11_CCDISLeadingLeptonMatches_new.png)
[Displacements between reconstructed and simulated interaction vertices]
pandora_vertex_resolution
The displacements between the reconstructed and simulated neutrino interaction vertices. The distributions are plotted for (top left), (top right), (bottom left) and (bottom right) and include all types of accelerator neutrino interaction (also deep inelastic events).
![[Uncaptioned image]](2002.03005v2/graphics/./Pandora/MCC11_ALL_INTERACTIONS_VtxDeltaX_new.png)
![[Uncaptioned image]](2002.03005v2/graphics/./Pandora/MCC11_ALL_INTERACTIONS_VtxDeltaY_new.png)
![[Uncaptioned image]](2002.03005v2/graphics/./Pandora/MCC11_ALL_INTERACTIONS_VtxDeltaZ_new.png)
![[Uncaptioned image]](2002.03005v2/graphics/./Pandora/MCC11_VtxDeltaRsq.png)
4.3.3 Reconstruction Performance in ProtoDUNE-SP
Further examination of the performance of the Pandora pattern recognition is provided through studies of the test-beam data taken by ProtoDUNE-SP. Figure shows the reconstruction efficiency for triggered test-beam particles as a function of the momentum recorded by the trigger. The reconstruction efficiency metric folds in many effects, including reconstruction, removal of cosmic-ray background and identification of the reconstructed particle as originating from the test beam. An example of the Pandora reconstruction output for ProtoDUNE MC simulations is shown in Figure 4.2. For high-momenta test-beam particle interactions, a close agreement between the reconstruction efficiency for MC simulations and data is observed in Figure . At high-momenta, the effect of beam-halo particles in the simulation appears to be overestimated, which results in the marginally lower reconstruction efficiency observed in simulation when comparison to data. For low-momenta test-beam particle interactions, the reconstruction efficiency for data is significantly lower than that see in MC simulations. This is due to particles interacting between the trigger and the LArTPC before reaching its active volume in data.
[Reconstruction efficiency for triggered test-beam particles as a function of particle momentum] pandora_protodune_tbrecoeff The efficiency of reconstruction for the triggered test-beam particle as a function of particle momentum in data (red) and simulation (black).
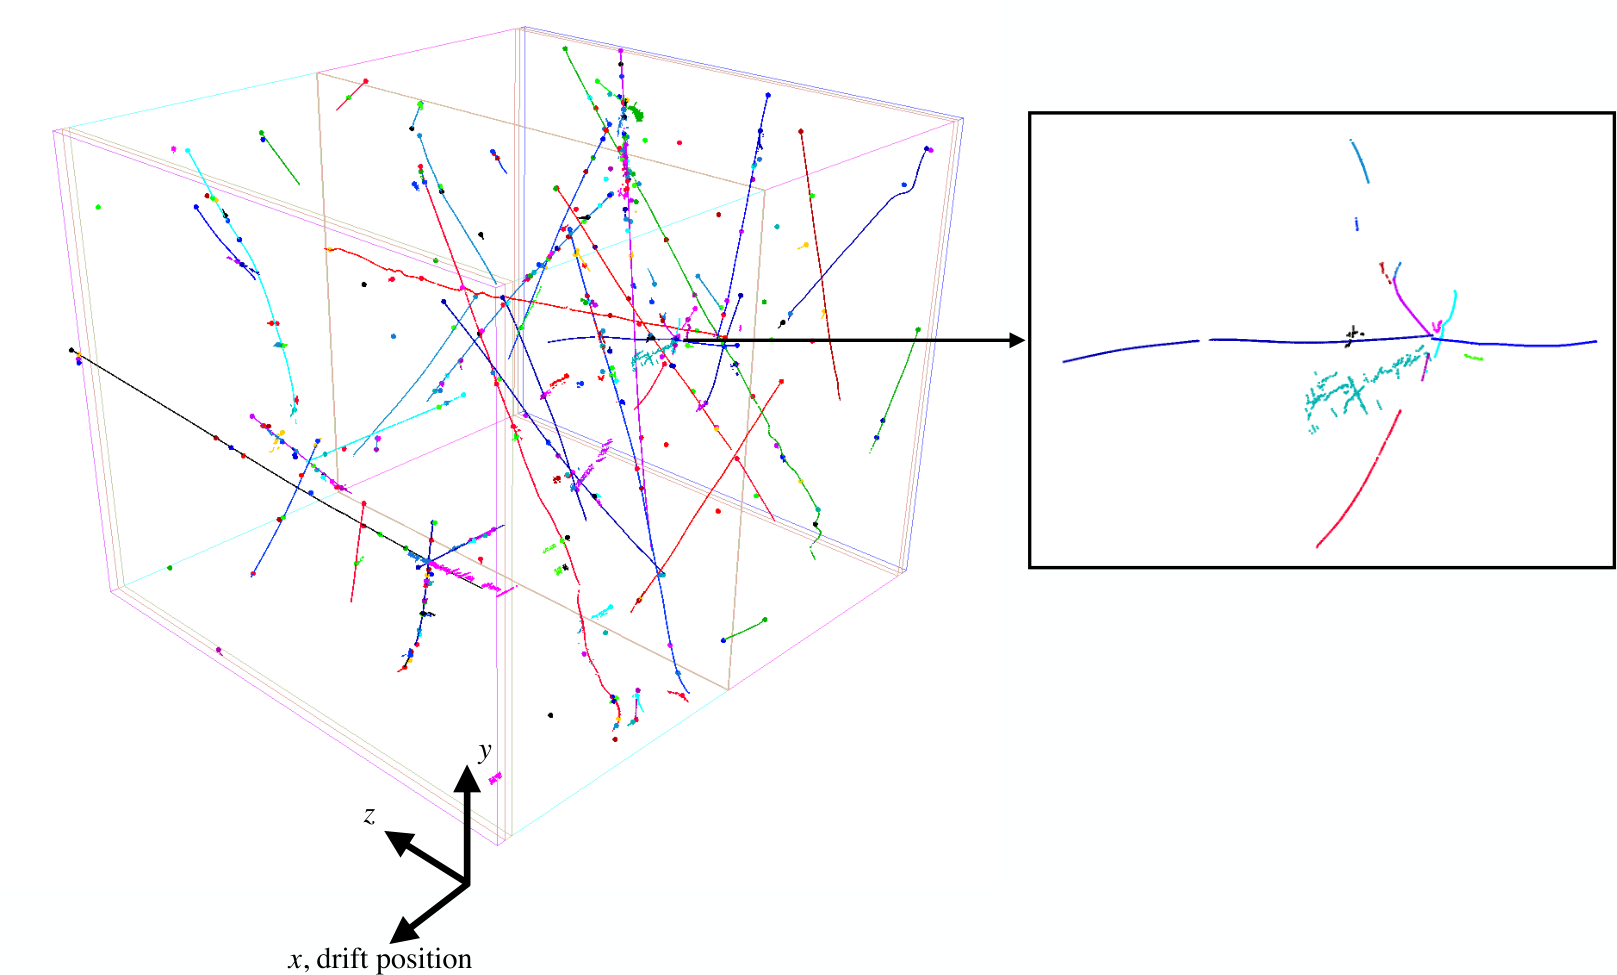
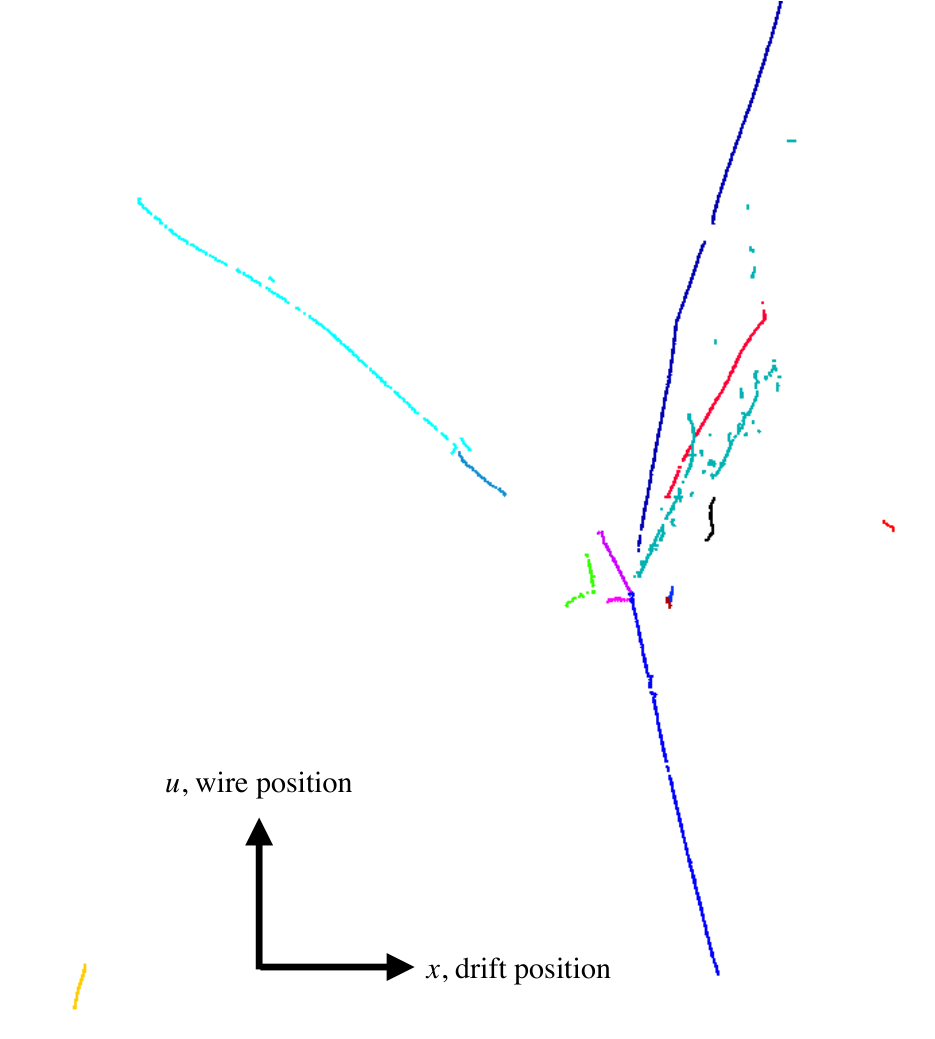
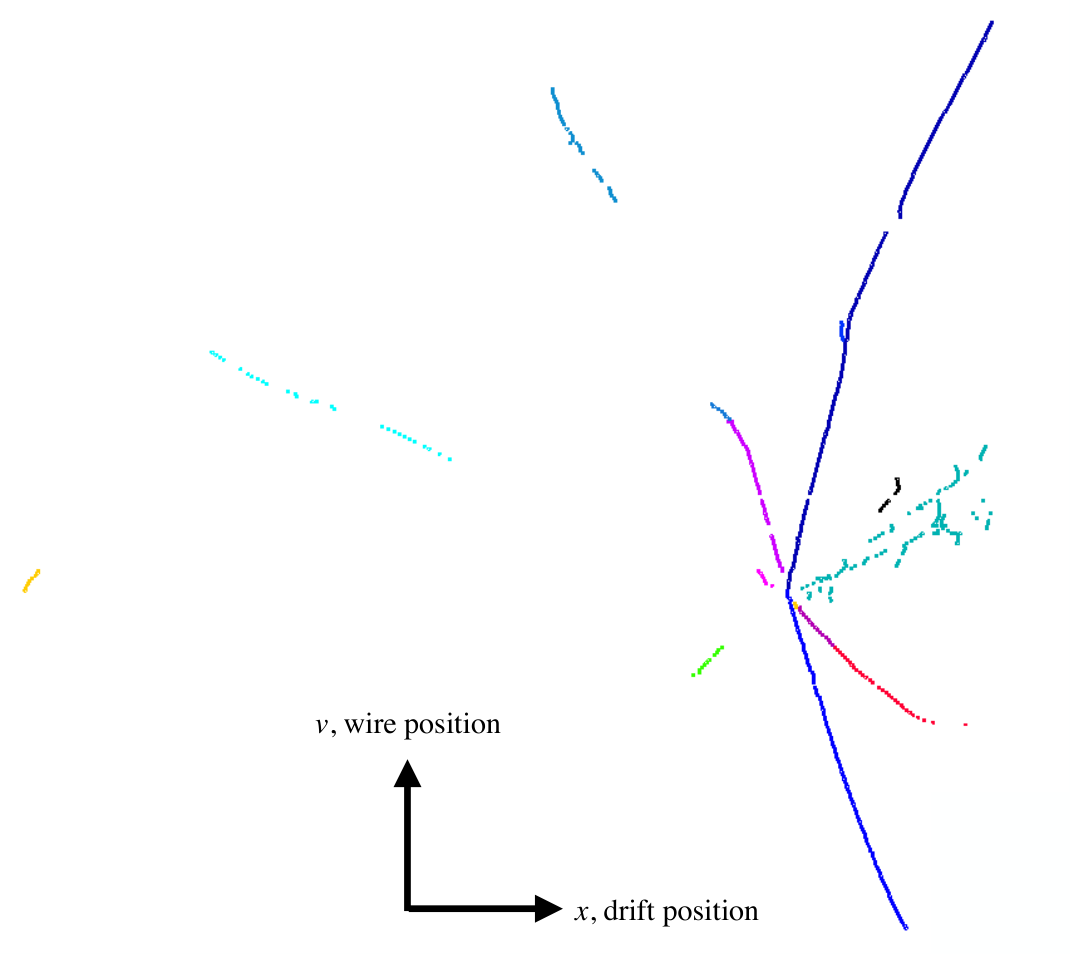
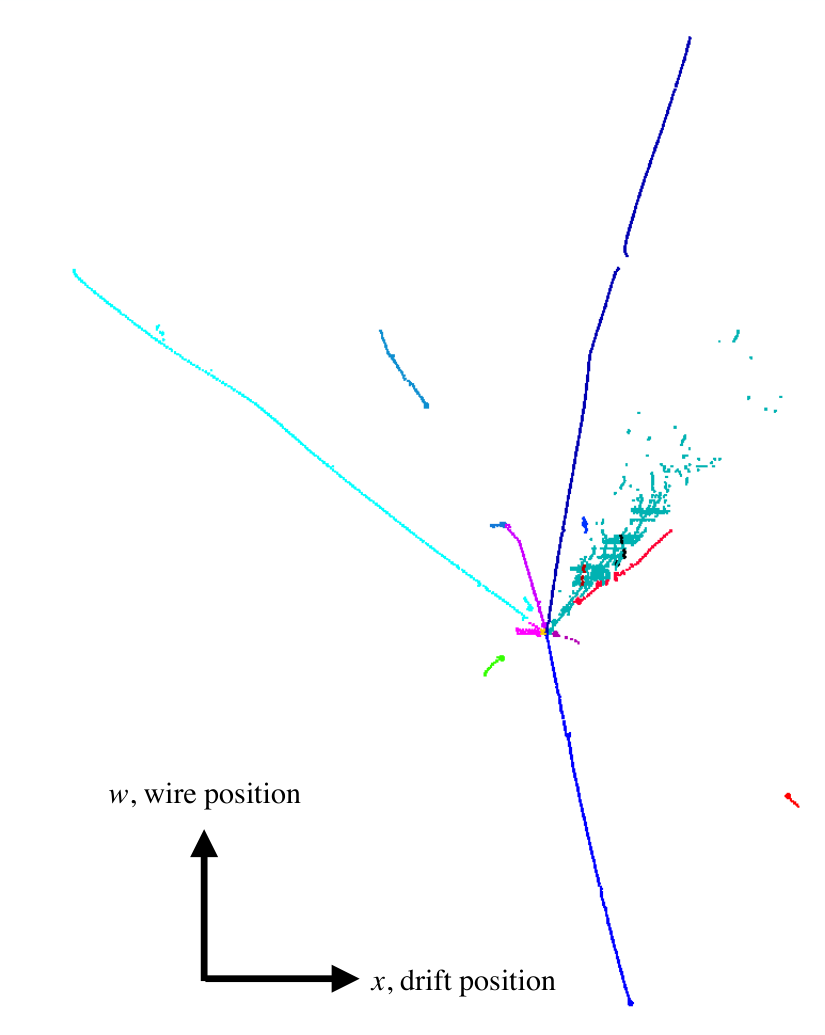
The effect of cosmic-ray backgrounds and the test beam particle halo on the reconstructed test beam particle efficiency is illustrated in Figure 4.3, where the efficiency is shown as a function of the momentum of the triggered particle (4.3a) and the number of hits produced by the triggered particle (4.3b). These figures indicate that the primary loss mechanisms in the test beam particle reconstruction, accounting for of all inefficiencies, are due to irreducible cosmic-ray and beam halo backgrounds.
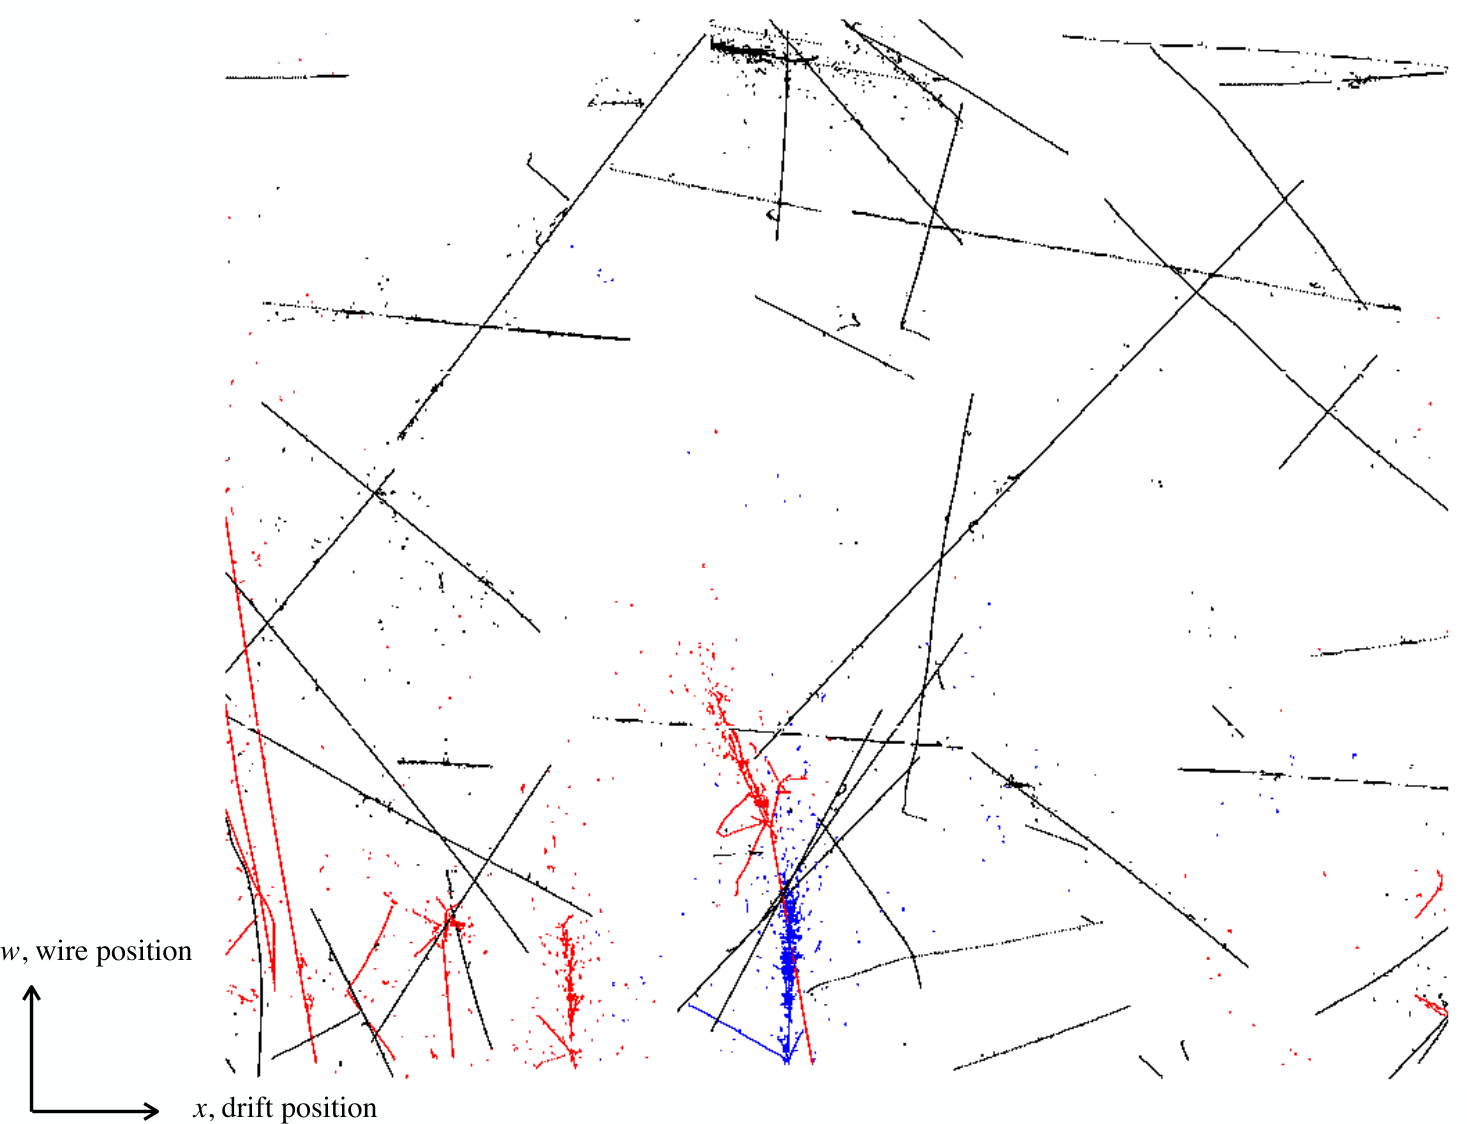
Alongside the test beam particle reconstruction metrics, the Pandora cosmic ray reconstruction has been studied using ProtoDUNE-SP data.
Figure 4.4a shows the number of distinct, i.e. that contain at least 100 hits, reconstructed cosmic rays per event. Both data and MC have a similar average number of cosmic rays per event; for data and for simulation. However, the MC distribution has a larger tail suggesting differences between the cosmic-ray profile in data and that used in simulation. Figure 4.4b shows the number of matched reconstructed cosmic rays per event as a function of the number of “target” reconstructable (as explained in Section 4.3.1) distinct cosmic rays per event for MC simulation, illustrating that the Pandora cosmic ray reconstruction is highly efficient. The Pandora reconstruction is also able to tag the true time that a cosmic ray passes through the detector, , should it cross a drift volume boundary, either CPA or APA. This allows us to compare the distribution for tagged cosmic rays in data and MC, shown in Figure 4.5a. There is excellent agreement between data and MC in this instance. The peak in the data distribution at ns appears due to channels affected by a known issue with the cold electronics that is now mitigated in the latest reconstruction.
Figure 4.5b shows the resolution on the reconstructed for MC, which indicates that the Pandora tagging is precise to the order of microseconds. The shift in the mean of the distribution when applying the space charge effects is due to the effect of bowing of the tracks when space charge is applied. Furthermore, the broadening of the distribution when applying the fluid flow model, in comparison to space charge, is due to the fact that the bowing effect is no longer correlated between tracks in the asymmetric fluid flow model. The size of the space charge effect is computed from simulations and efforts are ongoing to produce a data-driven space charge simulation.
4.3.4 High-Level Reconstruction
This section presents a series of studies to illustrate the results of current efforts on high-level reconstruction, analyzing different reconstructed quantities for tracks and showers. After the pattern recognition stage provided by Pandora, further fits to the reconstructed 3D particles can be made in order to characterize their properties. For the moment, the results presented here use only the output provided by Pandora, which includes a first pass of high-level reconstruction to build these objects. For tracks, Pandora sliding linear fits are used to calculate the trajectory of the particle, whereas for showers a principal component analysis (principal component analysis (PCA)) is used to estimate directions and opening angles.
The opening angle between the reconstructed and the true 3D direction of tracks and showers is presented in Fig. in simulated FD neutrino events44 4 The distributions in Figs. and 4.6 include only good reco-true matches, requiring a minimum of 10% completeness and 50% purity for the match. In addition, Fig. 4.6 is made using only contained tracks, by requiring that both true start and end point are within the fiducial volume. . The reconstructed direction of tracks is obtained as the initial momentum of the track, after a Pandora sliding linear fit is performed to its reconstructed 3D points. For showers, the reconstructed direction corresponds to the primary eigenvector result of the PCA fit to its reconstructed 3D points. In both cases, the opening angle is very small, indicating a good agreement between the reconstructed and true direction of the particles. The few cases in which an opening angle of is obtained are explained by a good reconstruction of the particle (hit clustering) but the particle vertex placed at its wrong end.
[Opening angle between reconstructed and true direction for track- and shower-like particles]
fig:pandora_dunefd_highlevel_reco_angle
Distribution of opening angle (in radians) between reconstructed and true direction for track-like (left) and shower-like (right) particles in simulated FD neutrino events.
![[Uncaptioned image]](2002.03005v2/graphics/./Pandora/MCC11_OpeningAngle_Tracks_new.png)
![[Uncaptioned image]](2002.03005v2/graphics/./Pandora/MCC11_OpeningAngle_Showers_new.png)
For track-like particles, another quantity that can be explored in the high-level reconstruction is the length. Figure 4.6a shows the difference between reconstructed and true particle length (), computed as the 3D distance between start and end positions, for simulated track-like particles of various types in the FD. The difference in length clearly depends on the particle type: for example, 90% (83%) of muons have a smaller than 10 cm (5cm), whereas for protons (pions) the fraction within 5 cm is 78% (54%). depends on the true length of the particle, as shown in Fig. 4.6b, which presents the mean and sigma (as marker and error bar respectively) of the distribution in different ranges of true length for different particle types55 5 A Gaussian fit is performed to the distributions in each range of true length, except the first one (true length ¡ 10cm) which presents a larger tail and its behavior is better represented by a Landau distribution, of which the most probable value is given instead. In general, small values of can be understood in terms of the efficiency of 3D points creation, and resolution of the vertex reconstruction. Particles presenting kinks due to scattering, such as pions and to a lesser extent protons, have the additional risk of merging parent and daughter particles when the scattering angle is small, increasing the value of . Short pions are in particular subject to this effect, in addition to merges with other close or overlapping particles in complex topologies, which might translate into larger values of .


A number of these variables can be also explored in experimental data taken by the ProtoDUNE-SP detector. For example, figure presents a measurement of the test beam particle interaction vertex by comparing the end point of the primary test beam particle track and the fitted interaction vertex for ProtoDUNE-SP data and MC events.
[Resolution on test beam interaction vertex on ProtoDUNE data and MC events] fig:pandora_protodune_vertex Resolution on the test beam particle interaction vertex on ProtoDUNE data and MC events, calculated comparing the end point of the primary test beam particle track and the fitted interaction vertex.
Cosmic-ray muons in the ProtoDUNE-SP detector are also used to calibrate the detector nonuniformity and determine the absolute energy scale. Cathode crossing cosmic-ray muons with information are used to correct for the attenuation effect caused by impurities in the LAr. Stopping cosmic-ray muons are used to determine the calorimetry constants that convert the calibrated ADC counts to the number of electrons so that the versus residual range distributions match the expectation, as shown in Figures 4.7a and 4.7b for ProtoDUNE-SP data and MC simulation with space charge effects after calibration. The data distribution has better resolution because the purity in data is better than in the simulation.
The same attenuation correction and calorimetry constants are applied to the beam proton data and MC and the resulting distributions are shown in Figure 4.8. The data and MC distributions agree well. Discrepancy with expectation is observed in the large residual range region, which corresponds to the beam entering point on the TPC front face where space charge effects are large. Good progress is being made on the space charge effects calibration, which will lead to more accurate measurements.
4.4 DUNE Calibration Strategy
The DUNE FD presents a unique challenge for calibration in many ways. It differs from existing LBL neutrino detectors and existing LArTPCs because of its size – the largest LArTPC ever constructed – but also because of its deep underground location. The DUNE ND, which we expect to include a LArTPC, will also differ from previous experiments (e.g., MINOS and NOvA). In particular, while the ND will be highly capable, pile-up and readout will be different, and this may complicate extrapolation of all relevant detector characteristics.
As for any LArTPC, full exploitation of DUNE’s capability for precision tracking and calorimetry requires a detailed understanding of the detector response. The inherently highly convolved detector response model and the strong correlations that exist between various calibration quantities make this challenging. For example, the determination of energy associated with an event of interest will depend on the simulation model, associated calibration parameters, non-trivial correlations between the parameters, and spatial and temporal dependence of those parameters caused by the non-static nature of the FD. Changes can be abrupt (e.g., noise, a broken resistor in the FC), or ongoing (e.g., exchange of fluid through volume, ion accumulation).
Convincing physics measurements will require a demonstration that the overall detector response is well understood. The systematic uncertainties for the LBL and low-energy (SNB) program will determine the required precision on dedicated calibration systems. The calibration program must provide measurements at the few-percent-or-better level stably across an enormous volume and over a long period of time, and provide sufficient redundancy.
This section describes the current calibration strategy for DUNE that uses existing sources of particles, external measurements, and dedicated external calibration hardware systems. Existing calibration sources for DUNE include beam or atmospheric neutrino-induced samples, cosmic rays, argon isotopes, and instrumentation devices such as LAr purity and temperature monitors. Dedicated calibration hardware systems currently include laser and pulsed neutron system (PNS). The responsibility of these hardware systems and assessment of alternative calibration system designs fall under the joint SP and DP calibration consortium. External measurements by ProtoDUNE and SBN will validate techniques, tools and the design of systems applicable to the DUNE calibration program; ProtoDUNE will also perform essential measurements of charged particle interactions in LAr.
Under current assumptions, the calibration strategy described in this document is applicable to both SP modules and DP modules. Section 4.4.1 briefly describes the physics-driven calibration requirements. The nominal DUNE FD calibration design is described in Section 4.4.2. Finally, Section 4.4.3 describes a staging plan for calibration from after the TDR through to the operation of the experiment including design validation at ProtoDUNE.
4.4.1 Physics-driven Calibration Requirements
To perform adequate calibrations the physics processes that lead to the formation of the signals required for DUNE’s broad physics program, expected (and unexpected) detector effects must be carefully understood, as they ultimately affect the detector’s energy, position and particle identification response. Other categories of effects, such as the neutrino interaction model or reconstruction pathologies, can impact measurements of physical quantities. These other effects are beyond the scope of the FD calibration effort and would only lead to a higher overall error budget.
LBL physics
Calibration information needs to provide an approximately 1-2% understanding of normalization and position resolution within the detector to support DUNE LBL physics. A bias on the lepton energy has a significant impact on the sensitivity to CPV. A % bias in the hadronic state (excluding neutrons) is important, as the inelasticity distribution for neutrinos and antineutrinos is quite different. Different fractions of their energies go into the hadronic state. Finally, while studies largely consider a single, absolute energy scale, DUNE will need to monitor and correct relative spatial differences across the enormous DUNE FD volume; this is also true for time-dependent changes [ebias].
A number of in situ calibration sources will be required to address these broad range of requirements. Michel electrons, neutral pions and radioactive sources (both intrinsic and external) are needed for calibrating detector response to electromagnetic activity in the tens-to-hundreds of MeV energy range. Stopping protons and muons from cosmic rays or beam interactions form an important calibration source for calorimetric reconstruction and particle identification. ProtoDUNE, as a dedicated test beam experiment, provides important measurements to characterize and validate particle identification strategies in a -scale detector and is an essential input to the overall program. Dedicated calibration systems, like lasers, will be useful to provide in situ full-volume measurements of E field distortions. Measuring the strength and uniformity of the E field is a key aspect of calibration, as estimates of calorimetric response and PID depend on the E field through recombination. The stringent physics requirements on energy scale and fiducial volume also put similarly stringent requirements on detector physics quantities such as E field, drift velocity, electron lifetime, and the time dependencies of these quantities; this is discussed in more detail in the dedicated laser system discussion under Section 4.4.2.
SNB and low-energy neutrino physics
A combination of 6 MeV (direct neutron capture response), 9 MeV (peak visible -energy of interest to SNB and /hep solar neutrinos), 15 MeV (upper visible energy of /hep solar neutrinos) and 30 MeV (decay electrons) is needed to map the low energy response. Supernova signal events present specific reconstruction and calibration challenges, and observable energy is shared between different charge clusters and types of energy depositions. In particular, the supernova signal will have a low-energy electron, gamma and neutron capture component, and each needs to be characterized. As discussed further in Section , primary requirements for this physics include (1) calibration of absolute energy scale and energy resolution, which is important for resolving spectral features of SNB events; (2) calibration of time and light yield response of optical photon detectors; (3) absolute timing of events; (4) measurement of trigger efficiency at low energies; and (5) understanding of detector response to radiological backgrounds. Further details on the necessary energy scale, energy resolution and trigger efficiency targets needed can be in Ref [bib:docdb14068]. Potential calibration sources in this energy range include Michel electrons from muon decays (successfully utilized by ICARUS and MicroBooNE [Acciarri:2017sjy]), which have a well known spectrum up to . Photons from neutral pion decay (from atmospheric and beam induced ) will provide an overall energy scale between and , in addition to cosmic ray muon energy loss. However, the limited statistical power of those samples (see Table ) mean that it is not possible for these samples to provide the energy scale or resolution at the spatial and temporal granularity needed. The pulsed neutron system can provides a source of direct neutron capture across the entire DUNE volume, providing a timing and energy calibration. The proposed radioactive source system provides an in situ source of the electrons and de-excitation rays, which are directly relevant for physics signals from SNB or solar neutrinos. These two systems (discussed in more detail in Section 4.4.2) can provide calibrations of photon, electron, and neutron response for energies below , where photons and electrons may have very different characteristics in LAr.
Nucleon decay and other exotic physics
The calibration needs for nucleon decay and other exotic physics are comparable to those for the LBL program, as listed in Section 4.4.1. Signal channels for light DM and sterile neutrino searches will be NC interactions that are background to the LBL physics program. Based on the widths of -based metrics of PID, qualitatively, we need to calibrate across all drift and track orientations at the few-percent level, similar to the LBL effort.
4.4.2 Calibration Sources, Systems and External Measurements
Calibration sources and systems provide measurements of the detector response model parameters, or provide tests of the response model itself. Calibration measurements can also provide corrections to data, data-driven efficiencies, systematics and particle responses. Figure shows the broad range of categories of measurements that calibrations can provide, and lists important calibration parameters for DUNE’s detector response model applicable to both SP or DP. Due to the significant interdependencies of many parameters (e.g., recombination, E field, and LAr purity), a calibration strategy will either need to measure parameters iteratively, or find sources that break these correlations.
Table provides a list of the calibration sources and dedicated calibration systems, along with their primary usage, that will comprise the current nominal DUNE FD calibration design. The next sections provide more details on each of them. ProtoDUNE and previous measurements provide independent tests of the response model, indicating that the choice of parameterization and values correctly reproduces real detector data. Not all of the ex situ measurements can be directly extrapolated to DUNE, however, due to other detector effects and conditions – only those considered to be universal (e.g., argon ionization energy).
Each of the many existing calibration sources comes with its own challenges. For example, while electrons from muon decay (Michel electrons) are very useful for studying the detector response to low-energy electrons (), these low-energy electrons present reconstruction challenges due to the loss of charge from radiative photons, as demonstrated in MicroBooNE [Acciarri:2017sjy]. Michel electrons are therefore considered an important, independent, and necessary test of the TPC energy response model, but they will not provide a measurement of a particular response parameter.
[Categories of measurements provided by calibration]fig:calibneedsCategories of measurements provided by calibration.
![[Uncaptioned image]](2002.03005v2/CalibNeedsFig_TDR_cropped.png)
[Calibration systems and sources of the nominal DUNE FD calibration design]
p.4p.55tab:calibsystemPrimary calibration systems and sources that comprise the nominal DUNE FD calibration design along with their primary usage.
System Primary Usage
\toprowrule
Existing Sources Broad range of measurements
\toprowrule, predominantly from cosmic ray Position (partial), angle (partial), electron lifetime, wire response, calibration etc.
\colhlineDecay electrons, from beam, cosmic, atm Test of electromagnetic response model
\colhline39Ar beta decays electron lifetime (x,y,z,t), diffusion, wire response
\colhline
External Measurements Tests of detector model, techniques and systems
\toprowruleArgoNeuT [Acciarri:2013met], ICARUS [Amoruso:2004dy, Antonello:2014eha, Cennini:1994ha], MicroBooNE Model parameters (e.g., recombination, diffusion)
\colhlineDUNE 35t [Warburton:2017ixr] Alignment and t0 techniques
\colhlineArgonTUBE [Ereditato:2014tya], MicroBooNE [Acciarri:2016smi], SBND, ICARUS [Auger:2016tjc], ProtoDUNE [Abi:2017aow] Test of systems (e.g., Laser)
\colhlineArgoNeuT [Acciarri:2015ncl], MicroBooNE [bib:uBlifetime, MICROBOONE-NOTE-1018-PUB, MICROBOONE-NOTE-1028-PUB, Acciarri:2017sjy, Abratenko:2017nki, Acciarri:2013met], ICARUS [Ankowski:2008aa, Ankowski:2006ts, Antonello:2016niy], ProtoDUNE Test of calibration techniques and detector model (e.g., electron lifetime, Michel electrons, 39Ar beta decays)
\colhlineProtoDUNE, LArIAT [Cavanna:2014iqa], CAPTAIN [Bhandari:2019rat] Test of particle response models and fluid flow models
\colhlineLArTPC test stands [Cancelo:2018dnf, Moss:2016yhb, Moss:2014ota, Li:2015rqa] Light and LAr properties; signal processing techniques
\colhline
Monitoring Systems Operation, Commissioning and Monitoring
\toprowrulePurity monitors Electron lifetime
\colhlinePhoton detection monitoring System PD system response
\colhlineThermometers Temperature, velocity; test of fluid flow model
\colhlineCharge injection Electronics response
\colhline
Dedicated Calibration Systems Targeted (near) independent, precision calibration
\toprowruleDirect ionization via laser Position, angle, electric field (x,y,z,t)
\colhlinePhotoelectric ejection via laser Position, electric field (partial)
\colhlineNeutron injection Test of SNB signal, neutron capture model
\colhlineProposed Radioactive source deployment Test of SNB signal model
\colhline
Existing sources
Cosmic rays and neutrino-induced interactions provide commonly used “standard candles,” e.g., electrons from muon decays, and photons from neutral pions, which have characteristic energy spectra. Cosmic ray muons are also used to determine detector element locations (alignment), timing offsets or drift velocity, electron lifetime, and channel-by-channel response, and to help constrain E field distortions. Table summarizes the rates for cosmic ray events. Certain measurements (e.g., channel-to-channel gain uniformity and cathode panel alignment) are estimated to take several months of data. Table gives the atmospheric interaction rates, which are comparable to beam-induced events – neither occurs at sufficient rates to provide meaningful spatial or temporal calibration; they will likely provide supplemental measurements only. (The beam will not yet be operational for calibration of the first detector module during early data taking.) Instead, we can use the reconstructed energy spectrum of 39Ar beta decays to make a precise measurement of electron lifetime with spatial and temporal variations. This can also provide other necessary calibrations, such as measurements of wire-to-wire response variations and diffusion measurements using the signal shapes associated with the beta decays. The 39Ar beta decay rate in commercially-provided argon is about , so 39Ar beta decays are expected in a single event readout in an entire detector module. The 39Ar beta decay cutoff energy is , which is close to the energy deposited on a single wire by a MIP. However, several factors can impact the observed charge spectrum from 39Ar beta decays, such as electronics noise, electron lifetime and recombination fluctuations; more details can be found in the Appendix 4.4.4. MicroBooNE [MICROBOONE-NOTE-1050-PUB] and ProtoDUNE are actively pursuing this technique, thus providing valuable inputs for DUNE.
[Annual rates for classes of cosmic-ray events useful for calibration]
lrl
tab:cosmic-ray-calib-rates
Annual rates for classes of cosmic-ray events described in this section assuming 100% reconstruction efficiency. Energy, angle, and fiducial requirements
have been applied. Rates and geometrical features apply to the single-phase far detector design.
Sample Annual Rate Detector Unit
\colhlineInclusive Per module
\colhlineVertical-Gap crossing 3300 Per gap
\colhlineHorizontal-Gap crossing 3600 Per gap
\colhlineAPA-piercing 2200 Per APA
\colhlineAPA-CPA piercing 1800 Per active APA side
\colhlineAPA-CPA piercing, CPA opposite to APA 360 Per active APA side
\colhlineCollection-plane wire hits 3300 Per wire
\colhlineStopping Muons 28600 Per module
\colhline Production 1300 module
\colhline
Monitors
Chapter 8 of The DUNE Far Detector Single-Phase Technology and The DUNE Far Detector Dual-Phase Technology discuss several instrumentation and detector monitoring devices in detail. These devices, including liquid argon temperature monitors, LAr purity monitors, gaseous argon analyzers, cryogenic (cold) and inspection (warm) cameras, and liquid level monitors, will provide valuable information for early calibrations and for tracking the space-time dependence of the detector modules. The computational fluid dynamics (CFD) simulations play a key role for calibrations initially in the design of the cryogenics recirculation system, and later for physics studies when the cryogenics instrumentation data can be used to validate the simulations. Chapters 4 and 5 of the detector module volumes discuss other instrumentation devices essential for calibration, such as drift HV current monitors and external charge injection systems.
External measurements
DUNE will use external measurements from past experimental runs (e.g., ArgoNeuT, the DUNE 35 ton prototype, ICARUS, and LArIAT), from ongoing and future experiments (e.g., MicroBooNE, ProtoDUNE, and SBND), and from small scale LArTPC test stands. External measurements provide a test bed for dedicated calibration hardware systems and techniques for the FD. In particular, ProtoDUNE will provide validation of the fluid flow model using cryogenic instrumentation data. Early calibration for physics in DUNE will utilize LAr physical properties from ProtoDUNE or SBN for tuning detector response models in simulation. Table provides references for specific external measurements. The usability of 39Ar has been demonstrated with MicroBooNE data [MICROBOONE-NOTE-1050-PUB]. Use of 39Ar and other radiological sources and, in particular, the DAQ readout challenges associated with their use, will be tested on the ProtoDUNE detectors. Dedicated systems for DUNE, including the laser system, have been used by previous experiments (ARGONTUBE [Zeller:2013sva, Ereditato:2014lra], CAPTAIN, and MicroBooNE experiments) and at SBND in the future, and will provide more information on use of the system and optimization of the design. The small-scale LAr test stand planned at Brookhaven National Lab, USA, will provide important information on simulation and calibration of field response for DUNE.
External measurements of particle response (e.g. pion interactions in LAr) are also important inputs to the detector model. These include dedicated measurements made with ProtoDUNE, LArIAT, and CAPTAIN [Bhandari:2019rat]; the DUNE ND, with both a LAr and low density gas detector, will also make measurements which characterize the relevant cross sections and outgoing final state particles.
Dedicated Calibration Hardware Systems
This section briefly describes the physics motivation and measurement goals for the calibration hardware systems and the designs currently envisioned. The calibration chapters in The DUNE Far Detector Single-Phase Technology and The DUNE Far Detector Dual-Phase Technology of the TDR provide further details on the design and development plan for these systems. We plan to deploy prototype designs of these systems in the phase 2 of ProtoDUNE to demonstrate proof-of-principle.
Laser systems
The primary purpose of a laser system is to provide an independent, fine-grained estimate of the E field in space or time, which is a critical parameter for physics signals as it ultimately impacts the spatial resolution and energy response of the detector. External measurements, e.g., MicroBooNE’s, use both a laser system and cosmic rays to estimate the E field, however the expected cosmic rate at the deep underground installation of the FD will not provide sufficient spatial or temporal granularity to study local distortions.
E field distortions can arise from multiple sources. Current simulation studies indicate that positive ion accumulation and drift (space charge) due to ionization sources such as cosmic rays or 39Ar are small in the FD; however, the fluid flow pattern in the FD is not yet sufficiently understood to exclude the possibility of stable eddies that may amplify the effect for both SP and DP modules. The DP module risks significant further amplification due to accumulation in the liquid of ions created by the electron multiplication process in the gas phase. Detector imperfections can also cause localized E field distortions. Examples include FC resistor failures, non-uniform resistivity in the voltage dividers, CPA misalignment, CPA structural deformations, and APA and CPA offsets and deviations from flatness. Individual E field distortions may add in quadrature with other effects, and can reach 4-5% under certain conditions, which corresponds to a 1-2% impact on charge, and a cm impact on position (and fiducial volume). Both charge and position distortions affect energy scale. Understanding all these effects requires an in situ calibration of the E field with a precision of about 1% with a coverage of at least 75% of the detector volume.
The laser calibration system offers secondary uses, e.g., alignment (especially modes that are weakly constrained by cosmic rays, see Figure ), stability monitoring, and diagnosing detector failures in systems such as HV.
[Sample distortion that may be difficult to detect with cosmic rays]fig:apacurtainalign
An example of a distortion that may be difficult to detect with cosmic rays. The APA frames are shown as rotated rectangles, as viewed from the top.
![[Uncaptioned image]](2002.03005v2/graphics/apacurtainalign.png)
Two systems are under consideration to extract the E field map: photoelectrons from the LArTPC cathode and direct ionization of the LAr, both driven by a laser. The reference design from MicroBooNE [bib:uBlaser2019] and SBND uses direct ionization laser light with multiple laser paths. This can provide field map information in ; a photoelectron laser only provides an integrated measurement of the E field along the drift direction. The ionization-based system can characterize the E field with fewer dependencies compared to other systems. If two laser tracks enter the same spatial voxel in a detector module, the relative position of the tracks provides an estimate of the local 3D E field. The deviation from straightness of single “laser tracks” can also be used to constrain local E fields. Comparison of the known laser track path against the path reconstructed from cosmic or beam data, assuming uniform E field, can also be used to estimate local E field distortions. A schematic of the ionization laser setup and a laser track from MicroBooNE is shown in Figure .
[MicroBooNE laser calibration system schematics]fig:uB_laser_schematic
Left: Schematics of the ionization laser system in MicroBooNE [Antonello:2015lea]. Right: A UV laser event in the MicroBooNE detector [bib:uBlaser2019]. The laser track can be identified by the endpoint on the cathode (larger charge visible at the top of the image) and the absence of charge fluctuations along the track. The charge released at the cathode comes from photoelectric effect. Other tracks seen in the display are from cosmic muons.
![[Uncaptioned image]](2002.03005v2/graphics/uB_laser_schematic.png)
![[Uncaptioned image]](2002.03005v2/graphics/run1306_ev134-2.png)
A photoelectron-based calibration system was used in the T2K gaseous (predominantly Ar), TPCs [Abgrall:2010hi]. Thin metal surfaces placed at surveyed positions on the cathode provided point-like and line sources of photoelectrons when illuminated by a laser. The T2K photoelectron system provided measurements of adjacent electronics modules’ relative timing response, drift velocity with a few resolution over their drift distance, electronics gain, transverse diffusion, and an integrated measurement of the E field along the drift direction. DUNE would use the system similarly to diagnose electronics or TPC response issues on demand, and to provide an integral field measurement across drift as well as measure relative distortions of , positions with time, and/or drift velocity. MicroBooNE has also observed ejection of photoelectrons from the cathode using the direct ionization laser system.
Pulsed neutron source
An external neutron generator system would provide a triggered, well defined energy deposition from neutron capture in 40Ar detectable throughout the detector module volume. Neutron capture is a critical component of signal processes for SNB and LBL physics; this system would enable direct testing of the detector response spatially and temporally for the low-energy program. This is important to measure energy scale, energy resolution and detection threshold spatially and temporally across the enormous DUNE volume.
[Cross sections enabling the PNS concept]fig:pns_xsec Illustration of interference anti-resonance dip in the cross section of 40Ar. Elastic scattering cross section data is obtained from ENDF VIII.0
A triggered pulse of neutrons can be generated outside the TPC and injected into the LAr, where it spreads through the entire volume to produce a mono-energetic cascade of photons via the 40Ar(n,)41Ar capture process. The uniform population of neutrons throughout the detector module volume exploits a remarkable property of argon – the near transparency to neutrons of energy near . This is due to a deep minimum in the cross section caused by the destructive interference between two high-level states of the 40Ar nucleus (see Fig. ). This cross section “anti-resonance” is approximately wide, and neutrons consequently have a scattering length of ; the scattering length averaged over the isotopic abundance in natural Ar is approximately . For neutrons moderated to this energy the DUNE LArTPC is essentially transparent. The neutrons that do scatter quickly leave the anti-resonance and thermalize, at which time they capture. Each neutron capture releases exactly the binding energy difference between 40Ar and 41Ar, about , in the form of gamma rays. The neutron capture cross-section and the spectrum have been measured and characterized. Recently, the ACED Collaboration performed a neutron capture experiment using the Detector for Advanced Neutron Capture Experiments at DANCE (ACED) at the Los Alamos Neutron Science Center (LANSCE). The result of neutron capture cross-section was published [Fischer:2019qfr] and will be used to prepare a database for the neutron capture studies. The data analysis of the energy spectrum of correlated gamma cascades from neutron captures is underway.
DUNE plans to place a fixed, shielded deuterium-deuterium () neutron generator above a penetration in the hydrogenous insulation of the detector module cryostat. Between the generator and the cryostat, layers of water or plastic and intermediate fillers would provide sufficient degradation of the neutron energy.
Additional Systems
There are additional systems under consideration for DUNE calibration. Radioactive source deployment provides an in situ source of low energy electrons and de-excitation gamma rays at a known location and with a known activity, which are directly relevant for detection of SNB or solar neutrinos. As shown in Section , the electron and photon response in the TPC is quite different (electrons leave worm-like tracks, photons leave ‘blips’). The PNS source will provide a 6.1 MeV multi-photon signal; radioactive sources can provide a single photon signal to measure detection threshold and demonstrate sufficient uncertainty on energy resolution at the peak of the SNB photon signal. The radioactive source system is under study, and feasibility and safety of deployment would be established with a dedicated run using a prototype system in ProtoDUNE.
The utility of internal source injection (e.g., 222Rn or 220Rn injection) for mapping electron lifetime and fluid flow in the TPC, used in dark matter experiments, will also be considered in the future. The major challenge for this system is if the coverage of the PD system is sufficient, and whether or not it will be able to identify a signal and trigger over the massive amount of 39Ar present. Recognizing that the presence of radioactive impurities can also impact such a system, the newly formed DUNE FD Background Task Force will address this concern. This system would not require any cryostat penetrations or affect major DAQ requirements.
4.4.3 Calibration Staging Plan
The calibration strategy for DUNE will need to address the evolving operational and physics needs at every stage of the experiment in a timely manner using the primary sources and systems listed in Table . Here we describe the validation plan for calibration systems at ProtoDUNE and a staging plan to deploy calibration systems during different phases of the experiment: commissioning, early data taking, and stable operations.
This TDR presents the baseline calibration systems and strategy. Post-TDR, once the calibration strategy is set, the calibration consortium will need to develop the necessary designs for calibration hardware along with tools and methods to be used with various calibration sources. To allow for flexibility in this process, the physical interfaces for calibration such as flanges or ports on the cryostat will be designed to accommodate the calibration hardware. As described in the calibration SP detector volume, the calibration task force has provided the necessary feedthrough penetration design for the SP module and will soon finalize the design for the DP module. As DUNE physics turns on at different rates and times, a calibration strategy at each stage for physics and data taking is required. The strategy described in this section assumes that all systems are commissioned and deployed according to the nominal DUNE run plan.
Design Validation: A second run of ProtoDUNE will be used to validate the designs of dedicated calibration systems, including the laser, PNS, and possibly the proposed radioactive source. In addition, ProtoDUNE data (and the SBN program) will provide data analysis techniques, tools, and detector model simulation improvements in advance of DUNE operation.
Commissioning: When a detector module is filled, data from various instrumentation devices validate the argon fluid flow model and purification system. Once filled and at the desired high voltage, the detector module immediately becomes live for SNB and proton decay signals (beam and atmospheric neutrino physics will require a few years of data accumulation) at which point it is critical that early calibration track the space-time dependence of the detector. Noise data and pulser data (taken with signal calibration pulses injected into the electronics) are needed to understand the TPC electronics response. Essential systems at this stage include temperature monitors, purity monitors, HV monitors, robust FE charge injection system for cold electronics, and a PD system monitoring system. In addition, as the 39Ar data is available immediately, DUNE must be ready (in terms of reconstruction tools and methods) to utilize 39Ar decays for understanding both low-energy response and space-time uniformity. Dedicated calibration systems as listed in Table are deployed and commissioned at this stage. Commissioning data from these systems must verify the expected configuration for each system and identify any needed adjustments to tune for data taking.
Early data taking: Since DUNE will not yet have all in situ measurements of LAr physical properties at this stage, early calibration of the detector will use LAr measurements from ProtoDUNE or SBN, and E fields from calculations tuned to measured HV values. This early data will most likely need to be recalibrated at a later stage with dedicated calibration runs when in situ measurements are available and as data taking progresses. The early physics will also require analysis of cosmic ray muon data to develop methods and tools for muon reconstruction from MeV to TeV and a well validated cosmic ray event generator with data. Dedicated early calibration runs using calibration hardware systems will develop and tune calibration tools to beam data taking and correct for any space-time irregularities observed in the TPC. Given the expected low rate of cosmic ray events at the underground location (see Section 4.4.2), calibration with cosmic rays is not possible over short time scales and will proceed from coarse-grained to fine-grained over the course of years, as statistics accumulate. The experiment will rely on calibration hardware systems, such as a laser system, for calibrations that require an independent probe with reduced or removed interdependencies, fine-grained measurements (both in space and time), and detector stability monitoring on the time scales required by physics. Some measurements are simply not possible with cosmic rays (e.g., APA flatness, global alignment of all APA s).
Stable operations: Once the detector is running stably, dedicated calibration runs, ideally before, during and after each run period, will ensure that detector conditions have not significantly changed. As statistics accumulate, DUNE can use standard-candle data samples (e.g., Michel electrons and neutral pions) from cosmic rays and beam-induced and atmospheric neutrinos to validate and improve the detector response models needed for precision physics. As DUNE becomes systematics-limited, dedicated precision-calibration campaigns using the calibration hardware systems will become crucial for meeting the stringent physics requirements on energy scale reconstruction and detector resolution. For example, understanding electromagnetic (EM) response in the FD will require both cosmic rays and external systems. The very high energy muons from cosmic rays at that depth that initiate EM showers (which would be rare at ProtoDUNE or SBND), will provide information to study EM response at high energies. External systems such as the pulsed neutron source system or the proposed radioactive source system will provide low energy EM response at the precision required for low energy supernovae physics. Dedicated measurements of charged hadron interactions, initially in ProtoDUNE and later with DUNE ND will also be important in this phase.
4.4.4 39Ar beta decays
Assuming the 39Ar beta decays are uniformly distributed in the drift direction, one is able to precisely determine the expected reconstructed energy spectrum provided a given set of well measured detector response parameters. This can be done independently of using timing information (e.g. from prompt scintillation light).
A number of factors can impact accurately measuring the end point energy, including noise, wire response, electron lifetime, recombination (and electric field), cosmogenic activity, and other radiological backgrounds. Many of the detector effects may be determined in-situ. For instance, measuring the electronics response can be done in situ with pulser data (charge injection on the front-end ASICs); measuring the wire field response can be done with cosmic tracks and other dedicated measurements ex-situ. There are also plans to measure recombination parameters ex-situ (e.g. ProtoDUNE, MicroBooNE). Figure illustrates the different possible reconstructed 39Ar beta decay electron energy spectra one might see in the SP DUNE far detector after correcting for all other detector effects except for electron lifetime. Also shown in Figure is the impact of varying the recombination model. The impact on the reconstructed energy spectrum is very different for the two detector effects, allowing for simultaneous determination of both quantities.
This method is one foreseeable way to obtain a fine-grained (spatially and temporally) electron lifetime measurement in the DUNE FD. It can also provide other necessary calibrations, such as measurements of wire-to-wire response variations and diffusion measurements, and could serve as an online monitor of E field distortions in the detector by looking at the relative number of decays near the edges of the detector.
One important consideration is whether or not the DUNE DAQ can provide the necessary rate and type of data to successfully carry out this calibration at the desired frequency and level of spatial precision. Knowing that the 39Ar beta decay rate is about 1 Bq/kg in natural (atmospheric) argon, one finds that 39Ar beta decays are expected in a single 5 ms event readout in an entire 10 kt module. From studies at MicroBooNE, will be needed for percent-level calibration of electron lifetime which means that for DUNE one would only need roughly five readout events in order to make a single measurement. However, to allow for the electron lifetime to spatially vary throughout the entire 10 kt module, it may be necessary to collect much more data in order to obtain a precise electron lifetime measurement throughout the detector. Studies of data rates and alternative methods for recording special 39Ar calibration data are currently in progress.
[Impact of different detector effects on the reconstructed 39Ar decay energy spectrum]fig:ar39Illustration of the impact of different detector effects on the reconstructed 39Ar beta decay electron energy spectrum for decays observed in the SP DUNE far detector. On the left are examples of the reconstructed energy spectrum for various different electron lifetimes, as well as the nominal 39Ar beta decay spectrum (corresponding to an infinite electron lifetime). On the right are examples of the reconstructed energy spectrum when the true recombination model is different from the one assumed in energy reconstruction (varying the parameter of the modified Box model, , where and with fixed ) and the electron lifetime is infinite. All curves have been normalized to have the same maximal value.
Chapter 5 Standard neutrino oscillation physics program
5.1 Overview and Theoretical Context
The SM of particle physics presents a remarkably accurate description of the elementary particles and their interactions. However, its limitations pose deeper questions about Nature. With the discovery of the Higgs boson at the CERN, the Standard Model would be “complete” except for the discovery of neutrino mixing, which indicates neutrinos have a very small but nonzero mass. In the SM, the simple Higgs mechanism is responsible for both quark and charged lepton masses, quark mixing and CPV. However, the small size of neutrino masses and their relatively large mixing bears little resemblance to quark masses and mixing, suggesting that different physics – and possibly different mass scales – in the two sectors may be present, thus motivating precision study of mixing and CPV in the lepton sector of the SM.
The DUNE plans to pursue a detailed study of neutrino mixing, resolve the neutrino mass ordering, and search for CPV in the lepton sector by studying the oscillation patterns of high-intensity and beams measured over a long baseline. Neutrino oscillation arises from mixing between the flavor (, , ) and mass eigenstates of neutrinos. In direct correspondence with mixing in the quark sector, the transformation between basis states is expressed in the form of a complex unitary matrix, known as the Pontecorvo-Maki-Nakagawa-Sakata (PMNS) matrix:
| (5.1) |
The PMNS matrix in full generality depends on just three mixing angles and a CP-violating phase11 1 In the case of Majorana neutrinos, there are two additional CP phases, but they are unobservable in the oscillation processes.. The mixing angles and phase are designated as and . This matrix can be expressed as the product of three two-flavor mixing matrices as follows [Schechter:1980gr], where and :
| (5.2) |
The parameters of the PMNS matrix determine the probability amplitudes of the neutrino oscillation phenomena that arise from mixing. The frequency of neutrino oscillation depends on the difference in the squares of the neutrino masses, ; a set of three neutrino mass states implies two independent mass-squared differences (the “solar” mass splitting, , and the “atmospheric” mass splitting, ), where . The use of numbers to label the neutrino mass states is arbitrary; by convention, the numbering is defined such that the solar mass splitting is positive, in accordance to the ordering determined from solar matter effects. This leaves two possibilities for the ordering of the mass states, known as the neutrino mass ordering or neutrino mass hierarchy. An ordering of is known as the normal ordering since it matches the mass ordering of the charged leptons in the SM, whereas an ordering of is referred to as the inverted ordering.
The entire complement of neutrino experiments to date has measured five of the mixing parameters [Esteban:2018azc, deSalas:2017kay, Capozzi:2017yic]: the three angles , , and , and the two mass differences and . The neutrino mass ordering (i.e., the sign of ) is unknown. The values of and are large, while is smaller. The value of is not well known, though neutrino oscillation data are beginning to provide some information on its value. The absolute values of the entries of the PMNS matrix, which contains information on the strength of flavor-changing weak decays in the lepton sector, can be expressed in approximate form as
| (5.3) |
using values for the mixing angles given in Table 5.1. While the three-flavor-mixing scenario for neutrinos is now well established, the mixing parameters are not known to the same precision as are those in the corresponding quark sector, and several important quantities, including the value of and the sign of the large mass splitting, are still undetermined.
The oscillation probability of through matter in a constant density approximation is, to first order [Nunokawa:2007qh]:
| (5.4) | |||||
| ) | |||||
where , , is the Fermi constant, is the number density of electrons in the Earth, is the baseline in km, and is the neutrino energy in GeV. In the equation above, both and switch signs in going from the to the channel; i.e., a neutrino-antineutrino asymmetry is introduced both by CPV () and the matter effect (). The origin of the matter effect asymmetry is simply the presence of electrons and absence of positrons in the Earth. In the few-GeV energy range, the asymmetry from the matter effect increases with baseline as the neutrinos pass through more matter; therefore an experiment with a longer baseline will be more sensitive to the neutrino mass ordering. For baselines longer than , the degeneracy between the asymmetries from matter and CPV effects can be resolved [Bass:2013vcg]. DUNE, with a baseline of , will be able to unambiguously determine the neutrino mass ordering and measure the value of [Diwan:2004bt].
The electron neutrino appearance probability, , is shown in Figure 5.1 at a baseline of as a function of neutrino energy for several values of . As this figure illustrates, the value of affects both the amplitude and phase of the oscillation. The difference in probability amplitude for different values of is larger at higher oscillation nodes, which correspond to energies less than 1.5 GeV. Therefore, a broadband experiment, capable of measuring not only the rate of appearance but of mapping out the spectrum of observed oscillations down to energies of at least 500 MeV, is desirable.
In the particular expression of the PMNS matrix shown in Equation 5.2, the middle factor labeled “II” describes the mixing between the and mass states, and depends on the CP-violating phase . The variation in the oscillation probability with the value of indicates that it is experimentally possible to measure the value of at a fixed baseline using only the observed shape of the or the appearance signal measured over an energy range that encompasses at least one full oscillation interval. A measurement of the value of , assuming that neutrino mixing follows the three-flavor model, would imply CPV. In the approximation for the electron neutrino appearance probability given in Equation , expanding the middle term results in the presence of CP-odd terms (dependent on ) that have opposite signs in and oscillations. For or , these terms introduce an asymmetry in neutrino versus antineutrino oscillations. Regardless of the measured value obtained for , the explicit observation of the asymmetry in and oscillations is sought to directly demonstrate the leptonic CPV effect. Furthermore, for long-baseline experiments such as DUNE where the neutrino beam propagates through the Earth’s mantle, the leptonic CPV effects must be disentangled from the matter effects.
The baseline establishes one of DUNE’s key strengths: sensitivity to the matter effect. This effect leads to a large asymmetry in the versus oscillation probabilities, the sign of which depends on the neutrino mass ordering. At this asymmetry is approximately in the region of the peak flux; this is larger than the maximal possible CP-violating asymmetry associated with , meaning that both the mass hierarchy (MH) and can be determined unambiguously with high confidence within the same experiment using the beam neutrinos. Concurrent analysis of the corresponding atmospheric-neutrino samples may provide an independent measurement of the neutrino mass ordering.
The rich oscillation structure that can be observed by DUNE will enable precision measurement in a single experiment of all the mixing parameters governing - and - mixing. Higher-precision measurements of the known oscillation parameters improves sensitivity to physics beyond the three-flavor oscillation model, particularly when compared to independent measurements by other experiments, including reactor measurements of and measurements with atmospheric neutrinos. DUNE will seek not only to demonstrate explicit CPV by observing a difference in the neutrino and antineutrino oscillation probabilities, but also to precisely measure the value of .
The mixing angle has been measured accurately in reactor experiments. While the constraint on from the reactor experiments will be important in the early stages of DUNE, DUNE itself will eventually be able to measure independently with a similar precision to reactor experiments. Whereas the reactor experiments measure using disappearance, DUNE will measure it through and appearance, thus providing an independent constraint on the three-flavor mixing matrix.
Current world measurements of leave an ambiguity as to whether the value of is in the lower octant (less than 45∘), the upper octant (greater than 45∘), or exactly 45∘. The value of from NuFIT 4.0 [Esteban:2018azc, nufitweb] is in the upper octant, but the distribution of the has another local minimum in the lower octant. A maximal mixing value of is therefore still allowed by the data and the octant is still largely undetermined. A value of exactly equal to 45∘ would indicate that and have equal contributions from , which could be evidence for a previously unknown symmetry. It is therefore important to experimentally determine the value of with sufficient precision to determine the octant of .
The magnitude of the CP-violating terms in the oscillation depends most directly on the size of the Jarlskog invariant [Jarlskog:1985cw], a function that was introduced to provide a measure of CP violation independent of the mixing-matrix parameterization. In terms of the parameterization presented in Equation 5.2, the Jarlskog invariant is:
| (5.5) |
The relatively large values of the mixing angles in the lepton sector imply that leptonic CPV effects may be quite large, though this depends on the value of , which is currently unknown. Given the current best-fit values of the mixing angles [Esteban:2018azc, nufitweb] and assuming normal ordering,
| (5.6) |
This is in sharp contrast to the very small mixing in the quark sector, which leads to a very small value of the corresponding quark-sector Jarlskog invariant [Tanabashi:2018oca],
| (5.7) |
despite the large value of .
A comparison among the values of the parameters in the neutrino and quark sectors suggest that mixing in the two sectors may be qualitatively different. Illustrating this difference, the value of the entries of the Cabibbo-Kobayashi-Maskawa matrix (CKM matrix) quark-mixing matrix (analogous to the PMNS matrix for neutrinos, and thus indicative of the strength of flavor-changing weak decays in the quark sector) can be expressed in approximate form as
| (5.8) |
for comparison to the entries of the PMNS matrix given in Equation 5.3. As discussed in [King:2014nza], the question of why the quark mixing angles are smaller than the lepton mixing angles is an important part of the flavor pattern question. Data on the patterns of neutrino mixing are already contributing to the quest to understand whether there is a relationship between quarks and leptons and their seemingly arbitrary generation structure.
DUNE is designed to make significant contributions to completion of the standard three-flavor mixing picture. Scientific goals are definitive determination of the neutrino mass ordering, definitive observation of CP violation for more than 50% of possible true values, and precise measurement of oscillation parameters, particularly , , and the octant of . There is great value in obtaining this set of measurements in a single experiment using a broadband beam, so that the oscillation pattern may be clearly observed and a detailed test of the three-flavor neutrino model may be performed.
5.2 Expected Event Rate and Oscillation Parameters
The signal for () appearance is an excess of CC and interactions over the expected background in the far detector. The background to appearance is composed of: (1) CC interactions of and intrinsic to the beam; (2) misidentified NC interactions; (3) misidentified and CC interactions; and (4) and CC interactions in which the s decay leptonically into electrons/positrons. NC and backgrounds emanate from interactions of higher-energy neutrinos that feed down to lower reconstructed neutrino energies due to missing energy in unreconstructed final-state neutrinos. The selected NC and CC generally include an asymmetric decay of a relatively high energy coupled with a prompt photon conversion.
A full simulation chain that includes the beam flux, the GENIE neutrino interaction generator [Andreopoulos:2009rq], and Geant4-based detector models has been implemented. Section 5.3 describes the beam design, simulated flux, and associated uncertainties. Event rates are based on a 1.2 MW neutrino beam and corresponding protons-on-target per year assumed to be 1.1 POT. These numbers assume a combined uptime and efficiency of the Fermilab accelerator complex and the LBNF beamline of 56%. An upgrade to 2.4 MW is assumed after six years of data collection. The neutrino interaction model has been generated using GENIE 2.12 and the choices of models and tunes as well as associated uncertainties are described in detail in Section 5.4. The performance parameters for the near and far detectors are described in detail in Sections 5.5 and 5.6. Near Detector Monte Carlo has been generated using Geant4 and a parameterized reconstruction based on true energy deposits in the active detector volumes has been used as described in Section 5.5. Far detector Monte Carlo has been generated using LArSoft and the reconstruction and event selection in the Far Detector has been fully implemented, as described in Section 5.6. Uncertainties associated with detector effects in the near and far detectors are described in Section 5.7. The methods used in calculating the DUNE sensitivity results are described in Section 5.8 and these results based on the full framework are shown in Section 5.9.
The neutrino oscillation parameters and the uncertainty on those parameters are taken from the NuFIT 4.0 [Esteban:2018azc, nufitweb] global fit to neutrino data; the values are given in Table 5.1. (See also [deSalas:2017kay] and [Capozzi:2017yic] for other recent global fits.) The sensitivities in this chapter are shown assuming normal ordering; this is an arbitrary choice for simplicity of presentation.
Event rates are presented as a function of calendar years and are calculated with the following assumed deployment plan, which is based on a technically limited schedule.
- •
Start of beam run: Two FD module volumes for total fiducial mass of 20 kt, 1.2 MW beam
- •
After one year: Add one FD module volume for total fiducial mass of 30 kt
- •
After three years: Add one FD module volume for total fiducial mass of
- •
After six years: Upgrade to 2.4 MW beam
| Parameter | Central Value | Relative Uncertainty |
| \toprowrule | 0.5903 | 2.3% |
| \colhline (NO) | 0.866 | 4.1% |
| (IO) | 0.869 | 4.0% |
| \colhline (NO) | 0.150 | 1.5% |
| (IO) | 0.151 | 1.5% |
| \colhline | 7.39 eV2 | 2.8% |
| \colhline (NO) | 2.451 eV2 | 1.3% |
| (IO) | -2.512 eV2 | 1.3% |
Figures and show the expected rate of selected events for appearance and disappearance, respectively, including expected flux, cross section, and oscillation probabilities, as a function of reconstructed neutrino energy at a baseline of . The spectra are shown for a year (staged) exposure each for neutrino and antineutrino beam mode, for a total run time of seven years. Tables and give the integrated rate for the appearance and disappearance spectra, respectively.
[ and appearance spectra]fig:appspectra and appearance spectra: Reconstructed energy distribution of selected CC-like events assuming 3.5 years (staged) running in the neutrino-beam mode (left) and antineutrino-beam mode (right), for a total of seven years (staged) exposure. The plots assume normal mass ordering and include curves for , and .
[ and disappearance spectra]fig:disspectra and disappearance spectra: Reconstructed energy distribution of selected CC-like events assuming 3.5 years (staged) running in the neutrino-beam mode (left) and antineutrino-beam mode (right), for a total of seven years (staged) exposure. The plots assume normal mass ordering.
[ and appearance rates]
lrr
tab:apprates
and appearance rates: Integrated rate of selected CC-like events between 0.5 and 8.0 GeV assuming a -year (staged) exposure in the neutrino-beam mode and antineutrino-beam mode. The signal rates are shown for both normal mass ordering (NO) and inverted mass ordering (IO), and all the background rates assume normal mass ordering. All the rates assume .
Expected Events (3.5 years staged)
\toprowrule mode
\colhline Signal NO (IO) 1092 (497)
Signal NO (IO) 18 (31)
\colhlineTotal Signal NO (IO) 1110 (528)
\colhlineBeam CC background 190
NC background 81
CC background 32
CC background 14
\colhlineTotal background 317
\toprowrule mode
\colhline Signal NO (IO) 76 (36)
Signal NO (IO) 224 (470)
\colhlineTotal Signal NO (IO) 300 (506)
\colhlineBeam CC background 117
NC background 38
CC background 20
CC background 5
\colhlineTotal background 180
[ and disappearance rates]
lrr
tab:disrates
and disappearance rates: Integrated rate of selected CC-like events between 0.5 and 8.0 GeV assuming a -year (staged) exposure in the neutrino-beam mode and antineutrino-beam mode. The rates are shown for normal mass ordering and .
Expected Events (3.5 years staged)
\toprowrule mode
\colhline Signal 6200
\colhline CC background 389
NC background 200
CC background 46
CC background 8
\toprowrule mode
\colhline Signal 2303
\colhline CC background 1129
NC background 101
CC background 27
CC background 2
5.3 Neutrino Beam Flux and Uncertainties
The neutrino fluxes are described in detail in Section 4.1.1. They were generated using G4LBNF, a Geant4-based simulation of the LBNF neutrino beam. The simulation is configured to use a detailed description of the LBNF optimized beam design [optimizedbeamcdr], which includes horns and target designed to maximize sensitivity to CPV given the physical constraints on the beamline design.
[Neutrino fluxes at the far detector]fig:flux_flavor Neutrino fluxes at the FD for neutrino mode (left) and antineutrino mode (right).
Neutrino fluxes for neutrino and antineutrino mode configurations of LBNF are shown in Figure . Uncertainties on the neutrino fluxes arise primarily from uncertainties in hadrons produced off the target and uncertainties in the design parameters of the beamline, such as horn currents and horn and target positioning (commonly called “focusing uncertainties”). Given current measurements of hadron production and LBNF estimates of alignment tolerances, flux uncertainties are approximately 8% at the first oscillation maximum and 12% at the second. These uncertainties are highly correlated across energy bins and neutrino flavors
Future hadron production measurements are expected to improve the quality of and the resulting constraints on these flux uncertainty estimates. Approximately 40% of the interactions that produce neutrinos in the LBNF beam simulation have no data constraints whatsoever. Large uncertainties are assumed for these interactions. The largest unconstrained sources of uncertainty are proton quasielastic interactions and meson incident interactions. The proposed EMPHATIC experiment [Akaishi:2019dej] at Fermilab will be able to constrain quasielastics and low energy interactions that dominate the lowest neutrino energy bins. The NA61 experiment at CERN has taken data that will constrain many higher energy interactions, including pion reinteractions. It also plans to measure hadrons produced off of a replica LBNF target, which would provide tight constraints on all interactions occurring in the target. A similar program at NA61 has reduced flux uncertainties for T2K from 10% to 5% [Vladisavljevic:2018prd], and NOvA is currently analyzing NA61 replica target data [Aduszkiewicz:2222876]. Another proposed experiment, the LBNF spectrometer, would measure hadrons after both production and focusing in the horns, effectively constraining nearly all hadron production uncertainties, and could also enable measurement of the impact on focused hadrons of shifted alignment parameters (which is currently taken from simulations). The neutrino flux uncertainties, as well as their bin-to-bin and flavor-to-flavor correlations, are very sensitive to correlations in hadron production measurements. None of the currently available measurements have provided correlations, so the uncertainty estimates make basic assumptions that statistical uncertainties are not correlated between bins but systematic uncertainties are completely correlated. New hadron production measurements that cover phase space similar to past measurements but that provide bin-to-bin correlations would also improve the quality of the estimated neutrino flux uncertainties at DUNE.
The unoscillated fluxes at the ND and FD are similar, but not identical (since the ND sees a line source, while the FD sees a point source. The relationship is well understood, and flux uncertainties mostly cancel for the ratio of fluxes between the two detectors. Uncertainties on the ratio are around 1% or smaller except at the falling edge of the focusing peak, where they rise to 2%. The far to near flux ratio and uncertainties on this ratio are shown in Fig. .
The peak energy of neutrino flux falls off and the width of the peak narrows as the distance from the beams central axis increases. The flux at these “off-axis” positions can be understood through the relationship between the parent pion energy and neutrino energy, as shown in Figure . For an off-axis angle relative to the initial beam direction, the subsequent neutrino energy spectra is narrower and peaked at a lower energy than the on-axis spectra. At , the location of the ND hall, a lateral shift of corresponds to approximately a change in off-axis angle.
The same sources of systematic uncertainty which affect the on-axis spectra also modify the off-axis spectra. Generally, the size of the off-axis uncertainties is comparable to the on-axis uncertainties and the uncertainties are highly correlated across off-axis and on-axis positions. The impact of focusing and alignment uncertainties varies depending on off-axis angle. Therefore, off-axis flux measurements are useful to diagnose beamline aberrations, and to further constrain flux uncertainties.
5.4 Neutrino Interactions and Uncertainties
5.4.1 Interaction Model Summary
The goal of parameterizing the neutrino interaction model uncertainties is to provide a framework for considering how these uncertainties affect the oscillation analysis at the FD, and for considering how constraints at the ND can limit those uncertainties.
The model developed for this purpose generally factorizes the neutrino interaction on nuclei into an incoherent sum of hard scattering neutrino interactions with the single nucleons in the nucleus. The effect of the nucleus is implemented as initial and final state interaction effects, with some (albeit few) nucleus-dependent hard scattering calculations. Schematically, we express this concept as .
The initial state effects relate to the description of the momentum and position distributions of the nucleons in the nucleus, kinematic modifications to the final state (such as separation energy, or sometimes described as a binding energy), and Coulomb effects. The concept of binding energy reflects the idea that the struck nucleon may be off the mass-shell inside the nucleus. Final state interactions refer to the propagation and interaction of hadrons produced in the nucleon interaction through the nucleus. The final-state interactions (FSI) alter both the momentum and energy of the recoiling particles produced in the final state, and may also alter their identity and multiplicity in the case of inelastic reinteractions (e.g., in a nucleus a hadron may be absorbed, rescattered, or create a secondary hadron). The FSI model implemented in the GENIE, nuwro, and neutrino interaction generator (NEUT) neutrino interaction generators is a semi-classical cascade model. In particular, GENIE’s model is a single step scaled model, based on hadron-nucleus and hadron-nucleon scattering data and theoretical corrections.
Generators vary in their attempts to accurately model the largely undetected final state “spectator” nuclear system. The nuclear system can carry away significant undetected momentum—hundreds of MeV is not unusual—in the form of one or more heavy, non-relativistic particles. These particles typically carry off very little kinetic energy; however they can absorb on the order of tens of MeV of energy from the initial state from breakup or excitation of the target nucleus. This energy and momentum will typically be invisible to the detector.
The factorization outlined above is not present in all parts of the model. Most modern generators include “2p2h” (two particle, two hole) interactions that model meson exchange processes and scattering on highly correlated pairs of nucleons in the nucleus. These interactions are often implemented as another process that incorporates both hard scattering and initial state effects in processes that create multiple final state nucleons, with a different prescription for different nuclei. Neutrino scattering on atomic electrons and the coherent production of pions (which scatters off the entire nucleus) also do not follow this factorization.
The interaction model and its variations are implemented in the GENIE generator. The fixed version of GENIE used for this report, v2.12.1022 2 At the time of the development of this model for interactions and their uncertainties, initial pieces of GENIE 3 had just recently been released (October 2018) and reweighting and documentation followed after this. The timing made it impractical to use GENIE 3 for this work., will not contain all of the possible cross section variations which need to be modeled. Therefore, the variations in the cross sections to be considered are implemented as some combination of: GENIE weighting parameters (sometimes referred to as “GENIE knobs”), ad hoc weights of events that are designed to parameterize uncertainties or cross section corrections currently not implemented within GENIE, and discrete alternative model comparisons, achieved through alternative generators, alternative GENIE configurations, or custom weightings. For the studies presented in this chapter we have identified classes of uncertainties that are intended to span a representative range of alternative models such as those found in other generators.
In this work, two example alternative models are used directly to evaluate additional uncertainties in the case where the assumptions about the near detector are relaxed. These studies are described in Section 5.9.6. The first is based on the NuWro generator and the second is designed to produce the same on-axis visible energy distributions as the nominal model, but with a different relationship between true neutrino energy and visible energy.
5.4.2 Interaction Model Uncertainties
The interaction uncertainties are divided into seven roughly exclusive groups: (1) initial state uncertainties, (2) hard scattering uncertainties and nuclear modifications to the quasielastic process, (3) uncertainties in multinucleon (2p2h) hard scattering processes, (4) hard scattering uncertainties in pion production processes, (5) uncertainties governing other, higher and neutral current processes, (6) final state interaction uncertainties, (7) neutrino flavor dependent uncertainties. Uncertainties are intended to reflect current theoretical freedom, deficiencies in implementation, and/or current experimental knowledge. There are constraints on nuclear effects because of measurements on lighter targets, however for the argon nuclear target some additional sources of uncertainty are identified. We also discuss cases where the parameterization is limited or simplified.
Initial State Uncertainties
The default nuclear model in GENIE is a modified global Fermi gas model of the nucleons in the nucleus. There are significant deficiencies that are known in global Fermi gas models. These include a lack of consistent incorporation of the tails that result from correlations among nucleons, the lack of correlation between location within the nucleus and momentum of the nucleon, and an incorrect relationship between momentum and energy of the off-shell, bound nucleon within the nucleus. GENIE modifies the nucleon momentum distribution empirically to account for short-range correlation effects, which populates tails above the Fermi cutoff, but the other deficiencies persist. Alternative initial state models, such as spectral functions [Benhar:1994hw, Nieves:2004wx], the mean field model of GiBUU [Gallmeister:2016dnq], or continuum random phase approximation (CRPA) calculations [Pandey:2014tza] may provide better descriptions of the nuclear initial state [Sobczyk:2017mts].
Quasielastic uncertainties
The primary uncertainties considered in quasielastic interactions are the axial form factor of the nucleon and nuclear screening—from the so-called random phase approximation (RPA) calculations—of low momentum transfer reactions.
The axial form factor uncertainty has been historically described with a single parameter uncertainty with the dipole form by varying , and we will continue this for these studies. Unfortunately, this framework overconstrains the form factor at high , and an alternative parameterization based on the -expansion has been proposed as a replacement [Meyer:2016oeg]. However, this parameterization is multi-dimensional and poses problems for the analysis framework of this study which factorizes all -dimensional variations out into -dimensional analysis bin response functions. For some multi-dimensional parameterizations, this simplification is an adequate approximation, e.g., the BeRPA described below.
One part of the Nieves et al.[Nieves:2011pp, Gran:2013kda] description of the interaction on nuclei includes RPA, used to sum the self-energy terms. In practice, this modifies the 1p1h/Quasi-Elastic cross-section in a non-trivial way. The calculations from Nieves et al. have associated uncertainties presented in [nieves_uncert], \fixmecould it be [Valverde:2006zn], Theoretical uncertainties on quasielastic charged-current neutrino-nucleus cross sections? which were evaluated as a function of [sanchez-private]. In 2018, MINERvA and NOvA parameterized the central value and uncertainty in using RPA uncertainties as parameterized in [RikRPA], whereas T2K used central values and uncertainties in only. Here we use T2K’s 2017/8 parameterization of the RPA effect [Abe:2018wpn] due to its simplicity. The shape of the correction and error is parameterized with a Bernstein polynomial up to which switches to a decaying exponential. The BeRPA (Bernstein RPA) function has three parameters controlling the polynomial (), where the parameters control the behavior at increasing and a fourth parameter controls the high tail.
The axial form factor parameterization we use is known to be inadequate. However, the convolution of BeRPA uncertainties with the limited axial form factor uncertainties do provide more freedom as a function of , and the two effects likely provide adequate freedom for the shape in quasielastic events.
uncertainties
We start with the Nieves et al. or “Valencia” model [Nieves:2011pp, Gran:2013kda] for multinucleon () contributions to the cross section. However, MINERvA has shown directly [Rodrigues:2015hik], and NOvA indirectly, that this description is missing observed strength on carbon. As a primary approach to the model, we add that missing strength to a number of possible reactions. We then add uncertainties for energy dependence of this missing strength and uncertainties in scaling the prediction from carbon to argon.
The extra strength from the “MINERvA tune” to is applied in space (where is energy transfer from the leptonic system, and is the magnitude of the three momentum transfer) to fit reconstructed MINERvA CC-inclusive data [Rodrigues:2015hik] in 33 3 is calorimetrically visible energy in the detector, roughly speaking total recoil hadronic energy, less the masses of and the kinetic energies of neutrons and . Reasonable fits to MINERvA’s data are found by attributing the missing strength to any of from initial state pairs, from initial state pairs, or or quasielastic processes. The default tune uses an enhancement of the and initial strengths in the ratio predicted by the Nieves model, and alternative systematic variation tunes (“MnvTune” 1-3) attribute the missing strength to the individual hypotheses above. Implementation of the “MnvTune” is based on weighting in true . The weighting requires GENIE’s Llewelyn-Smith and Valencia are used as the base model. To ensure consistency in using these different tunes as freedom in the model, a single systematic parameter is introduced that varies smoothly between applying the tune at one extreme value to applying the tune at the other extreme via the default tune which is used as the central value. The tune is neglected in this prescription as being the most redundant, in terms of missing energy content of the final state, of the four discrete hypotheses.
The rates for and processes could be different on argon and carbon targets. There is little neutrino scattering data to inform this, but there are measurements of short-ranged correlated pairs from electron scattering on different nuclei [Colle:2015ena]. These measurements directly constrain from short range correlations, although the link to dynamical sources like meson exchange current processes (MEC) is less direct. Interpolation of that data in (Nucleon number) suggests that scaling from carbon relative to the naive prediction for processes would give an additional factor of for pairs, and for pairs. GENIE’s prediction for the ratio of cross-sections in for neutrinos varies slowly with neutrino energy in the DUNE energy range: from at GeV to at GeV. The ratio for antineutrino cross sections is consistent with at all DUNE energies. Since the ratio of for is , this is consistent with the ranges suggested above by the measured and pair scaling. A dedicated study by the SuSA group using their own theoretical model for the relevant MEC process also concludes that the transverse nuclear response (which drives the MEC cross section) ratio between (the isoscalar nucleus with the same as ) and is [Amaro:2017eah]. We vary GENIE’s Valencia model based prediction, including the MINERvA tune, for by to be consistent with the correlated pair scaling values above. This is done independently for neutrino and antineutrino scattering.
The MINERvA tune may be dependent. MINERvA separated its data into an GeV and an 6 GeV piece, and sees no dependence with a precision of better than [Rodrigues:2015hik]. The mean energy of the GeV piece is roughly GeV. In general, an exclusive cross-section will have an energy dependence [llewelyn-smith]; therefore, unknown energy dependence may be parameterize by an ad hoc factor of the form . The MINERvA constraints suggest GeV2 and GeV. The variations for neutrinos and antineutrinos could be different since this is an effective modification. Ideally this energy dependent factor would only affect the MINERvA tune, but practically, because of analysis framework limitations already discussed, this is not possible. As a result, this energy dependent factor is applied to all true events.
Single pion production uncertainties
GENIE uses the Rein-Sehgal model for pion production. Tunes to data have been performed, both by the GENIE collaboration itself and in subsequent re-evaluations [Rodrigues:2016xjj]; we use the latter tune as our base model. For simplicity of implementation, the ‘v2.8.2 (no norm.)’ results are used here.
MINERvA single pion production data [Altinok:2017xua, McGivern:2016bwh, Eberly:2014mra] indicates disagreement at low which may correspond to an incomplete nuclear model for single pion production in the generators. A similar effect was observed at MINOS [Adamson:2014pgc] and NOvA implements a similar correction in analyses [nova_2018]. A fit to MINERvA data [StowellThesis] measured a suppression parameterized by
| (5.9) | ||||
| (5.10) |
where defines the magnitude of the correction function at the intercept, . is chosen to be so that describes the curvature at the center point of the correction. The fit found and . The correction is applied to events with a resonance decay inside the nucleus giving rise to a pion, based on GENIE event information.
An improved Rein-Sehgal-like resonance model has recently been developed [minoo] which includes a non-resonant background in both and channels and interference between resonant-resonant and resonant-non-resonant states. It also improves on the Rein-Sehgal model in describing the outgoing pion and nucleon kinematics using all its resonances. A template weighting in is implemented to cover the differences between the two models as a systematic uncertainty. The weighting also suppresses GENIE non-resonant pion production events (deep inelastic scattering events with ) as the new model already includes the non-resonant contribution coherently. The weighting is only applied to true muon-neutrino charged-current resonant pion production interactions.
Coherent inelastic pion production measurements on carbon are in reasonable agreement with the GENIE implementation of the Berger-Sehgal model [Mislivec:2017qfz]. The process has not been measured at high statistics in argon. While coherent interactions provide a very interesting sample for oscillation analyses, they are a very small component of the event rate and selections will depend on the near detector configuration. Therefore we do not provide any evaluation of a systematic uncertainty for this extrapolation or any disagreements between the Berger-Sehgal model and carbon data.
Other hard scattering uncertainties
NOvA oscillation analyses [nova_2018] have found the need for excursions beyond the default GENIE uncertainties to describe their single pion to deep inelastic scattering (DIS) transition region data. Following suit, we drop GENIE’s default “Rv[n,p][1,2]pi” knobs and instead implement separate, uncorrelated uncertainties for all perturbations of 1, 2, and pion final states, CC/NC, neutrinos/anti-neutrinos, and interactions on protons/neutrons, with the exception of CC neutrino 1-pion production, where interactions on protons and neutrons are merged, following [Rodrigues:2016xjj]. This leads to 23 distinct uncertainty channels ([3 pion states] x [n,p] x [nu/anti-nu] x [CC/NC] - 1), all with a value of 50% for GeV. For each channel, the uncertainty drops linearly above GeV until it reaches a flat value of 5% at GeV, where external measurements better constrain this process.
Final state interaction uncertainties
GENIE includes a large number of final state uncertainties to its final state cascade model which are summarized in Table 5.3. These uncertainties have been validated in neutrino interactions primarily on light targets such as carbon, but there is very little data available on argon targets. The lack of tests against argon targets is difficult to address directly because there are many possible FSI processes that could be varied.
Neutrino flavor dependent uncertainties
The cross sections include terms proportional to lepton mass, which are significant contributors at low energies where quasielastic processes dominate. Some of the form factors in these terms have significant uncertainties in the nuclear environment. Ref. [Day-McFarland:2012] ascribes the largest possible effect to the presence of poorly constrained second-class current vector form factors in the nuclear environment, and proposes a variation in the cross section ratio of of for neutrinos and for anti-neutrinos. Note the anticorrelation of the effect in neutrinos and antineutrinos.
In addition, radiative Coulomb effects may also contribute, which for T2K is of order MeV shifts in reconstructed lepton momentum. Like the second class current effect in the cross section, it flips sign between neutrinos and antineutrinos and is significant only at low energies. This effect is not implemented herein.
Finally, some electron neutrino interactions occur at four momentum transfers where a corresponding muon neutrino interaction is kinematically forbidden, therefore the nuclear response has not been constrained by muon neutrino cross section measurements. This region at lower neutrino energies has a significant overlap with the Bodek-Ritchie tail of the Fermi gas model. There are significant uncertainties in this region, both from the form of the tail itself, and from the lack of knowledge about the effect of RPA and in this region. The allowed phase space in the presence of nonzero lepton mass is . Here, a 100% variation is allowed in the phase space present for but absent for .
A similar prescription cannot applied for differences between interactions of and because the mass scale is of the same order of magnitude as the neutrino energies, and is thus a leading effect. No specific uncertainties were developed for interactions as there is little theoretical guidance.
5.4.3 Listing of Interaction Model Uncertainties
The complete set of interaction model uncertainties includes GENIE implemented uncertainties (Tables 5.2, and 5.3), and new uncertainties developed for this effort (Table 5.4) which represent uncertainties beyond those implemented in the GENIE generator.
| Description of | |||
| Quasielastic | |||
| Axial mass for CCQE | GeV | ||
| Choice of CCQE vector form factors (BBA05 Dipole) | N/A | ||
| Fermi surface momentum for Pauli blocking | 30% | ||
| Low | |||
| Axial mass for CC resonance | 0.94 | 0.05 GeV | |
| Vector mass for CC resonance | 10% | ||
| Branching ratio for decay | 50% | ||
| Branching ratio for decay | 50% | ||
| distribution in decaying rest frame (isotropic RS) | N/A | ||
| High | |||
| higher-twist param in BY model scaling variable | 25% | ||
| higher-twist param in BY model scaling variable | 25% | ||
| valence GRV98 PDF correction param in BY model | 30% | ||
| valence GRV98 PDF correction param in BY model | 40% | ||
| Other neutral current | |||
| Axial mass for NC elastic | 25% | ||
| Strange axial form factor for NC elastic | 30% | ||
| Axial mass for NC resonance | 10% | ||
| Vector mass for NC resonance | 5% | ||
| Misc. | |||
| Vary effective formation zone length | 50% |
| Description of | |||
| Nucleon charge exchange probability | 50% | ||
| Nucleon elastic reaction probability | 30% | ||
| Nucleon inelastic reaction probability | 40% | ||
| Nucleon absorption probability | 20% | ||
| Nucleon -production probability | 20% | ||
| charge exchange probability | 50% | ||
| elastic reaction probability | 10% | ||
| inelastic reaction probability | 40% | ||
| absorption probability | 20% | ||
| -production probability | 20% |
Table 5.4 separates the interaction model parameters into three categories based on their treatment in the analysis:
- •
Category 1: On-axis near detector data is expected to constrain these parameters; the uncertainty is implemented in the same way in near and far detectors. All GENIE uncertainties (original or modified) are all treated as Category 1.
- •
Category 2: These uncertainties are implemented in the same way in near and far detectors, but on-axis data alone is not sufficient to constrain these parameters. We use two sub-categories. The first category (2A) corresponds to interaction effects which may be difficult to disentangle from detector effects. A good example of this is the parameter, which may be degenerate with the energy scale of the near detector. This may be constrained with electron scattering and dedicated studies carefully selected samples of near detector data, but would be difficult to constrain with inclusive near detector samples. The second category (2B) corresponds to parameters that can be constrained by off-axis samples, described in Section 5.5.
- •
Category 3: These uncertainties are implemented only in the far detector. Examples are and rates which are small and difficult to precisely isolated from background at the near detector. Therefore, near detector data is not expected to constrain such parameters.
| Uncertainty | Mode | Description | Category | |
| BeRPA | 1p1h/QE | RPA/nuclear model suppression | 1 | |
| MnvTune1 | 2p2h | Strength into (nn)pp only | 1 | |
| MnvTuneCV | 2p2h | Strength into 2p2h | 1 | |
| MnvTune2 | 1p1h/QE | Strength into 1p1h | 1 | |
| ArC2p2h | 2p2h Ar/C scaling | Electron scattering SRC pairs | 1 | |
| 2p2h | 2p2h Energy dependence | 2B | ||
| Low | RES | Low (empirical) suppression | 1 | |
| MK model | CC-RES | alternative strength in W | 1 | |
| CC Non-resonant | DIS | Norm. for (c.f. [Rodrigues:2016xjj]) | 1 | |
| Other Non-resonant | DIS | Per-topology norm. for GeV. | 1 | |
| all | Extreme FSI-like variations | 2B | ||
| Modified proton energy | all | 20% change to proton E | 2B | |
| / | 100% uncertainty in unique phase space | 3 | ||
| / norm | , | Ref. [Day-McFarland:2012] | 3 | |
Finally, there are a number of tunes applied to the default model, to represent known deficiencies in GENIE’s description of neutrino data, and these are listed in Table 5.5.
| Description of | |||
| Quasielastic | |||
| BeRPA | Random Phase Approximation tune | ||
| controls low , controls low-mid | |||
| controls mid , controls high fall-off | |||
| controls transition from polynomial to exponential | |||
| 2p2h | |||
| MINERvA 2p2h tune | dependent correction to 2p2h events | ||
| Low single pion production | |||
| Axial mass for CC resonance in GENIE | |||
| Non-res CC1 norm. | Normalization of CC1 non-resonant interaction | ||
5.5 The Near Detector Simulation and Reconstruction
Oscillation parameters are determined by comparing observed charged-current event spectra at the FD to predictions that are, a priori, subject to uncertainties on the neutrino flux and cross sections at the level of tens of percent as described in the preceding sections. To achieve the required few percent precision of DUNE, it is necessary to constrain these uncertainties with a highly capable ND suite. The ND is described in more detail in Volume I, Introduction to DUNE.
The broad ND concept is described briefly in Section 5.5.1, along with an outline of the ND’s role in the oscillation analysis. The parameterized reconstruction and event selection is described in Section 5.5.2. ND and FD uncertainties, including those due to energy estimation and selection efficiencies, are discussed in Section 5.7.
5.5.1 The Near Detector Concept
The DUNE ND system consists of a LArTPC functionally coupled to a magnetized MPD, and a SAND. The ND hall is located at Fermilab 574 m from the neutrino beam source and 60 m underground. The long dimension of the hall is oriented at 90 degrees with respect to the beam axis to facilitate measurements at both on-axis and off-axis locations with a movable detector system.
The LArTPC is modular, with fully-3D pixelated readout and optical segmentation. These features greatly reduce reconstruction ambiguities that hamper monolithic, projective-readout TPCs, and enable the ND to function in the high-intensity environment of the DUNE ND site. Each module is itself a LAr TPC with two anode planes and a central cathode. The active dimensions of each module are m (), where the direction is upward from the neutrino beam, and the direction points upward. Charge drifts in the direction, with a maximum drift distance of 50 cm for ionization electrons produced in the center of a module. The module design is described in detail in Ref. [Asaadi:2018xfh]. The full LAr detector consists of an array of modules in a single cryostat. The minimum active size for full containment of hadronic showers is m. High-angle muons can also be contained by extending the width to 7 m. For this analysis, 35 modules are arranged in an array 5 modules deep in the direction and 7 modules across in so that the total active dimensions are m. The total active LAr volume is m3, corresponding to a mass of 147 tons.
The anode planes are tiled with readout pads, such that the coordinate is given by the pad location and the coordinate is given by the drift time, and the three-dimensional position of an energy deposit is uniquely determined. A dedicated, low-power readout ASIC is being developed, which will enable single-pad readout without analog multiplexing [Dwyer:2018phu]. The module walls orthogonal to the anode and cathode are lined with a photon detector that is sensitive to scintillation light produced inside the module, called ArCLight [Auger:2017flc]. The detector is optically segmented, and tiled so that the vertical position of the optical flash can be determined with 30 cm resolution. It is therefore possible to isolate flashes to a volume of roughly 0.3 m3, and associate them to a specific neutrino interaction even in the presence of pile-up. The neutrino interaction time, , is determined from the prompt component of the scintillation light.
The MPD consists of a high-pressure gaseous argon time-projection chamber (GArTPC) in a cylindrical pressure vessel at 10 bar, surrounded by a granular, high-performance electromagnetic calorimeter. The MPD sits immediately downstream of the LAr cryostat so that the beam center crosses the exact center of both the LAr and gaseous argon active volumes. The pressure vessel is 5 m in diameter and 5 m long. The TPC is divided into two drift regions by a central cathode, and filled with a 90/10 Ar/CH4 gas mixture, such that 97% of neutrino interactions will occur on the Ar target. The gas TPC is described in detail in Ref. [bib:docdb12388].
The electromagnetic calorimeter is composed of a series of absorber layers followed by arrays of scintillator read out by SiPMs mounted directly onto boards. The inner-most layers will be tiled, giving 3D position information for each hit, and sufficient granularity to enable reconstruction of the angle of incoming photons. The ECAL design is described in Ref. [Emberger:2018pgr]. The entire MPD sits inside a magnetic field with a strength of at least 0.4 T. A superconducting magnet is preferred, to reduce the total amount of mass near the detectors.
The optimization of the detector design is still underway at the time of preparing this document, and the eventual parameters may be somewhat different from what is simulated. For the oscillation analysis presented herein, only the LAr event sample is explicitly used. The ECAL, pressure vessel, and magnet design have a small impact on the acceptance of muons originating in the LAr. The ECAL is assumed to be 30 layers of alternating planes of 5mm CH and 2mm Cu. The pressure vessel is assumed to be 3 cm thick titanium. The magnet is a solenoid with an inner radius of 320 cm, with a yoke cut out of the upstream barrel to minimize the passive material between the two TPC detectors. The on-axis neutrino beam monitor SAND is not functionally coupled to the LAr detector and thus is not included in these simulations. Small changes in these parameters are not expected to significantly impact the acceptance. A profile view visualization of the ND as implemented in this analysis is shown in Figure .
[ND visualization]fig:NDvis
The near detector shown from the side. The neutrinos are incident from the left along the axis shown, which intersects the center of the LAr and GAr detectors.
![[Uncaptioned image]](2002.03005v2/graphics/lar_mpt_in_hall.png)
The oscillation analysis includes samples of and charged-current interactions originating in the LAr. The samples are binned in 2D as a function of neutrino energy and inelasticity, , where and are the muon and neutrino energies, respectively.
5.5.2 Event Simulation and Parameterized Reconstruction
Neutrino interactions are simulated in the active volumes of the LAr and high-pressure gas (HPG) TPCs. The neutrino flux prediction is described in Section 5.3. Interactions are simulated with the GENIE event generator using the model configuration described in Section 5.4. The propagation of neutrino interaction products through the detector volumes is simulated using a Geant4-based model. Pattern recognition and reconstruction software has not yet been developed for the ND. Instead, we perform a parameterized reconstruction based on true energy deposits in active detector volumes as simulated by Geant4.
Liquid Argon charged-current interactions
Liquid argon events are required to originate in a fiducial volume that excludes 50 cm from the sides and upstream edge, and 150 cm from the downstream edge of the active region, for a total of m2. A hadronic veto region is defined as the outer 30 cm of the active volume on all sides. Events with more than 30 MeV total energy deposit in the veto region are excluded from analysis, as this energy near the detector edge suggests leakage, resulting in poor energy reconstruction. Even with the containment requirement, events with large shower fluctuations to neutral particles can still be very poorly reconstructed. Neutrons, in particular, are largely unreconstructed energy.
Electrons are reconstructed calorimetrically in the liquid argon. The radiation length is 14 cm in LAr, so for fiducial interactions and forward-going electrons there are between 10 and 30 radiation lengths between the vertex and the edge of the TPC. As there is no magnetic field in the LAr TPC region, electrons and positrons cannot be distinguished and the selected sample contains both neutrino- and antineutrino-induced events.
Muons with kinetic energy greater than 1 GeV typically exit the LAr. An energetic forward-going muon will pass through the ECAL and into the gaseous TPC, where its momentum and charge are reconstructed by curvature. For these events, it is possible to differentiate between and event by event. Muons that stop in the LAr or ECAL are reconstructed by range. Exiting muons that do not match to the HPG TPC are not reconstructed, and events with these tracks are rejected from analysis. These are predominantly muon CC, where the muon momentum cannot be determined. Forward exiting muons will enter the magnetized MPD, where their momenta and charge sign are reconstructed by curvature. The asymmetric transverse dimensions of the LAr volume make it possible to reconstruct wide-angle muons with some efficiency. High-angle tracks are typically lost when the plane is nearly parallel to the axis, but are often contained when it is nearly parallel to the axis.
The charge of stopping muons in the LAr volume cannot be determined. However, the wrong-sign flux is predominantly concentrated in the high-energy tail, where leptons are likelier to be forward and energetic. In FHC mode, the wrong-sign background in the focusing peak is negligibly small, and is assumed for all stopping muon tracks. In RHC mode, the wrong-sign background is larger in the peak region. Furthermore, high-angle leptons are generally at higher inelasticity, , which enhances the wrong-sign contamination in the contained muon subsample. To mitigate this, a Michel electron is required. The wrong-sign captures on Ar with 75% probability, effectively suppressing the relative component by a factor of four.
Events are classified as either CC, CC, + CC, or NC. True muons and charged pions are evaluated as potential muon candidates. The track length is determined by following the true particle trajectory until it hard scatters or ranges out. The particle is classified as a muon if its track length is at least 1 m, and the mean energy deposit per centimeter of track length is less than 3 MeV. The mean energy cut rejects tracks with detectable hadronic interactions. The minimum length requirement imposes an effective threshold on true muons of about 200 MeV kinetic energy, but greatly suppresses potential NC backgrounds with short, non-interacting charged pions.
True electrons are reconstructed with an ad-hoc efficiency that is zero below 300 MeV, and rises linearly to unity between 300 and 700 MeV. Neutral-current backgrounds arise from photon and production. Photons are misreconstructed as electrons when the energy deposit per centimeter in the first few cm after conversion is less than 4 MeV. This is typically for Compton scatters, and can also occur due to a random downward fluctuation in the dE/dx. The conversion distance must also be small so that no visible gap can be identified. We consider a photon gap to be clear when the conversion distance is greater than 2 cm, which corresponds to at least four pad widths. For events, the second photon must also be either less than 50 MeV, or have an opening angle to the first photon less than 10 mrad. Electrons are generally contained in the LAr and are reconstructed calorimetrically. It is possible for CC events to be reconstructed as CC when the muon is too soft and a fakes the electron.
LAr events are classified as CC, CC, + CC, or NC. Charged-current events are required to have exactly one reconstructed lepton of the appropriate flavor. The muon-flavor samples are separated by reconstructed charge, but the electron-flavor sample is combined because the charge cannot be determined. The neutral-current sample includes all events with zero reconstructed leptons. Spectra for selected CC events in fhc are shown in Figure as a function of both neutrino energy and inelasticity.
[ND selected samples]fig:recoSamples Reconstructed neutrino energy and for events classified as CC in FHC mode. Background events are predominantly neutral currents and are shown in red.
Hadronic energy is estimated by summing visible energy deposits in the active LAr volume. Events are rejected when energy is observed in the outer 30 cm of the detector, which is evidence of poor hadronic containment. Events with more than 30 MeV of visible hadronic energy in the veto region are also excluded. This leads to an acceptance that decreases with hadronic energy, as shown in the right panel of Figure .
Events are classified as either CC, CC, + CC, or NC based on the presence of charged leptons. Backgrounds to CC arise from NC production where the pion leaves a long track and does not shower. Muons below about 400 MeV kinetic energy have a significant background from charged pions, so these CC events are excluded from the selected sample. Backgrounds to CC arise from photons that convert very near the interaction vertex. The largest contribution is from production with highly asymmetric decay.
[ND acceptance]fig:NDacceptance Left: Detector acceptance for CC events as a function of muon transverse and longitudinal momentum. Right: Acceptance as a function of hadronic energy; the black line is for the full fiducial volume while the red line is for a m3 volume in the center, and the blue curve is the expected distribution of hadronic energy given the DUNE flux.
Neutrino-electron elastic scattering
In addition to the CC event selections, neutrino-electron elastic scattering is also selected. Measurements of neutrino-nucleus scattering are sensitive to the product of the flux and cross section, both of which are uncertain. This can lead to a degeneracy between flux and cross section nuisance parameters in the oscillation fit, and results in significant anti-correlations, even when the uncertainty on the diagonal component is small. One way to break this degeneracy is by including a sample for which the a priori cross section uncertainties are very small.
Neutrino-electron scattering is a pure-electroweak process with calculable cross section. It is therefore possible to directly constrain the flux by measuring the event rate of and dividing by the known cross section. The final state consists of a single electron, subject to the kinematic limit
| (5.11) |
where is the angle between the electron and incoming neutrino, and are the electron mass and total energy, respectively, and is the fraction of the neutrino energy transferred to the electron. For DUNE energies, , and the angle is very small, such that .
The overall flux normalization can be determined by counting events. Events can be identified by searching for a single electromagnetic shower with no other visible particles. Backgrounds from charged-current scattering can be rejected by looking for large energy deposits near the interaction vertex, which are evidence of nuclear breakup. Photon-induced showers from neutral-current events can be distinguished from electrons by the energy profile at the start of the track. The dominant background is expected to be charged-current scattering at very low , where final-state hadrons are below threshold, and happens to be small. The background rate can be constrained with a control sample at higher , but the shape extrapolation to is uncertain at the 10-20% level.
For the DUNE flux, approximately 100 events per year per ton of fiducial mass are expected with electron energy above 0.5 GeV. For a LAr TPC mass of 25 tons, this corresponds to 2500 events per year, or 12500 events in the full 5-year FHC run, assuming the ND stays on axis. Given the very forward signal, it may be possible to expand the fiducial volume to enhance the rate. The statistical uncertainty on the flux normalization from this technique is expected to be 1%.
To evaluate the impact of neutrino-electron scattering, a dedicated high-statistics signal-only sample is generated. Due to the simple nature of the signal, it is possible to estimate backgrounds without a full detector simulation. A single electromagnetic shower (electron, positron or photon) is required. To reject events with clearly-identifiable second photons, no additional showers over 50 MeV are allowed.
Charged-current interactions can be rejected when there is evidence of nuclear breakup in the form of final-state charged hadrons. A conservative cut of 40 MeV total charged hadron kinetic energy is applied. For a single proton, this corresponds to 1 cm of track length, which will leave energy on two or three readout pads and be easily identified. Finally, a cut requiring low isolates the signal. Alternatively, templates in can be formed, and the unique shape of the signal can be used in a fit to extract the flux normalization.
Off-axis ND measurements
Neutrino energy reconstruction is one of the biggest challenges in a precision long-baseline oscillation experiment like DUNE. Even with a highly capable FD, a fraction of the final-state hadronic energy is typically not observed. For example, neutrons may travel meters without interacting, and can exit the detector with significant kinetic energy. This missing energy is typically corrected with a neutrino interaction generator, which is used to relate the true neutrino energy to the observed energy. These models have many tens of uncertain parameters, which can be constrained by ND measurements. However, there may be many different parameter combinations that adequately describe the ND data. These degenerate solutions can extrapolate differently to the FD, where the flux is significantly different due to oscillations. This can lead to biases in the fitted oscillation parameters, including , despite an apparently good quality of fit.
While these biases can be partially mitigated by an on-axis ND capable of making numerous exclusive measurements, the energy dependence of the interaction cross section and the bias in reconstructed neutrino energy cannot be measured in a single beam. To gain sensitivity to these, the LArTPC and MPD combination is movable, and the ND hall is oriented to facilitate both on-axis measurements and measurements at positions up to 33 m off axis. The flux spectrum varies as a function of off-axis angle, peaking lower in energy as the angle is increased, from 2.5 GeV in the on-axis position down to 0.5 GeV at 33 m off axis. As uncertainties in the flux prediction are strongly correlated across off-axis angles, off-axis measurements of reconstructed neutrino energy constrain cross section uncertainties and provide further handles on possible degeneracies in the fit.
By taking linear combinations of such measurements, it is also possible to reproduce the predicted FD oscillated flux for some set of oscillation parameters, and directly compare visible energy between ND and FD over essentially the same “oscillated” flux, and with greatly reduced model dependence. Figure shows the result of such a linear combination, overlaid with the FD flux. The oscillated flux is well reproduced between 0.5 GeV and 3.5 GeV. The lower bound is determined by the range of accessible off-axis angles; to cover down to 0.5 GeV, measurements out to 33 m off axis are required. The off-axis technique cannot reproduce the high-energy flux tail seen in the FD spectrum. This is because the off-axis spectra all provide lower peak energies; it is not possible to produce a peak energy higher than that of the FD because the FD is on axis.
[DUNE-PRISM fluxes]fig:nd_prism The predicted FD flux (black), and a prediction made up of linear combinations of ND fluxes (green).
A potential run plan is to take on-axis data approximately 50% of the time, with the other 50% split among enough off-axis positions so that the fiducial volumes of adjacent “stops” overlap, giving a continuous range of angles. Event selection at an off-axis location of the LAr detector is identical to the on-axis case. The selection efficiency varies as a function of muon energy due to containment and matching to the downstream magnetized tracker, and as a function of hadronic energy due to containment. As muon and hadronic energy are correlated to neutrino energy, the efficiency varies with off-axis position. The efficiency also varies as a function of vertex position; interactions occurring near the edges of the detector are more likely to fail containment requirements. These effects are corrected with simulation; as they are largely geometric, the uncertainties that arise from the corrections are small compared to the uncertainties on neutrino cross sections and energy reconstruction.
Gaseous argon charged-current interactions
With over 30 million charged-current events per year, the LArTPC event sample can be analyzed in many different exclusive channels and provide powerful constraints. However, its relatively high density makes certain hadronic topologies challenging to reconstruct. The gaseous TPC complements the LAr detector by providing low reconstruction thresholds, excellent pion/proton separation, and charge-sign reconstruction. In particular, measurements of proton and charged pion multiplicities as a function of neutrino energy constrain cross section uncertainties not accessible to the LAr alone.
In addition, the gas TPC provides a useful check on the reconstruction efficiency of the LAr selection. Due to the combining of contained muons with gas TPC-matched events, there are kinematic regions where the acceptance of the LArTPC is uncertain. Also, without a magnetic field, the wrong sign contamination cannot be directly measured, especially at high angle and low energy. The gas TPC, however, has uniform acceptance over the full 4, as well as charge measurement capability except when the muon is nearly parallel to the magnetic field lines.
Unlike the LArTPC, where the hadronic energy is determined by a calorimetric sum of energy deposits, the gas TPC hadronic energy is reconstructed particle-by-particle, including pion masses. For this analysis, samples of CC events are selected in slices of charged pion multiplicity, and fit as a function of reconstructed neutrino energy. The threshold for charged pion selection is 5 MeV, and can be reliably separated from protons up to momenta of 1.3 GeV/c.
5.6 The Far Detector Simulation and Reconstruction
The calculation of DUNE sensitivities to oscillation parameter measurements requires predictions for the number of events to be observed in the FD fiducial volume, the reconstructed neutrino energy for each of these events, and the probability that they will be correctly identified as signal for each analysis samples. To build these analysis samples a Geant4 simulation of the FD has been developed. The output of that simulation has been used to build neutrino energy estimators, and an event selection discriminant that can separate CC, CC, and NC events. Each of these components is described in detail in this section. The uncertainties associated with each step in the simulation and reconstruction chain, including the FD simulation, reconstructed energy estimators, and selection efficiencies are discussed in Section 5.7.
5.6.1 Simulation
The neutrino samples were simulated using a smaller version of the full far detector module geometry. This geometry is 13.9 m long, high and 13.3 m wide, which consists of 12 anode plane assemblies and 24 cathode plane assemblies. The reference flux was used (Section 5.3) and samples were produced with both the forward-horn-current (neutrino enhanced) and inverted-horn-current (antineutrino enhanced) beam configurations. Three samples were generated. The first sample keeps the original neutrino flavor composition of the neutrino beam. The second sample converts all the muon neutrinos to electron neutrinos. The third sample converts all the muon neutrinos to tau neutrinos. Oscillation probabilities are used to weight CC events to build oscillated FD predictions from the three event samples. GENIE 2.12.10 was used to model the neutrino-argon interactions in the volume of cryostat. The produced final-state (after FSI) particles were propagated in the detector through Geant4. The ionization electrons and scintillation light were digitized to produce signals in the wire planes and PDs. More details on the simulation can be found in Section 4.1.3.
5.6.2 Event Reconstruction and Kinematic Variables
The first step in the reconstruction is to convert the raw signal from each wire to a standard (e.g., Gaussian) shape. This is achieved by passing the raw data through a calibrated deconvolution algorithm to remove the impact of the LArTPC E field and the electronic response from the measured signal. The resulting wire waveform possesses calibrated charge information.
The hit-finding algorithm scans the processed wire waveform looking for local minima. If a minimum is found, the algorithm follows the waveform after this point until it finds a local maximum. If the maximum is above a specified threshold, the program scans to the next local minimum and identifies this region as a hit. Hits are fit with a Gaussian function whose features identify the correct position (time coordinate), width, height, and area (deposited charge) of the hit. A single Gaussian function is used to describe hits produced by isolated single particles. In regions where there are overlapping particles (e.g., around the neutrino interaction vertex) single Gaussian fits may fail, and fits to multiple Gaussian functions may be used. The reconstructed hits are used by reconstruction and event selection pattern recognition algorithms. In particular the CVN event selection algorithm is described later in this section.
The reconstruction algorithms (Pandora and PMA) define clusters as hits that may be grouped together due to proximity in time and space to one another. Clusters from different wire planes are matched to form high-level objects such as tracks and showers. These high level objects are used as inputs to the neutrino energy reconstruction algorithm. More details on the reconstruction can be found in section 4.2.
The energy of the incoming neutrino in CC events is estimated by adding the reconstructed lepton and hadronic energies. If the event is selected as CC, the neutrino energy is estimated as the sum of the energy of the longest reconstructed track and the hadronic energy. The energy of the longest reconstructed track is estimated from its range if the track is contained in the detector, and this is calibrated using simulated CC events with true muon energies from 0.2-1.7 GeV. If the longest track exits the detector, its energy is estimated from multi-Coulomb scattering, and corrected using simulated events with true muon energies from 0.5-3 GeV. The hadronic energy is estimated from the charge of reconstructed hits that are not in the longest track, and corrections are applied to each hit charge for recombination and the electron lifetime. An additional correction is then made to the hadronic energy to account for missing energy due to neutral particles and final-state interactions, and this is done using simulated events with true hadronic energies from 0.1-1.6 GeV. The same hadronic shower energy calibration is used for both and based on a sample of and events.
If the event is selected as CC, the energy of the neutrino is estimated as the sum of the energy of the reconstructed shower with the highest energy and the hadronic energy. The former is estimated from the charges of the reconstructed hits in the shower, and the latter from the hits not in the shower; the recombination and electron lifetime corrections are applied to the charge of each hit. Subsequently the shower energy is corrected using simulated events with true electron energies from 0.5-3 GeV, and the missing energy correction is applied to the hadronic energy.
The fractional residuals of reconstructed neutrino energy are shown for CC events with contained tracks in figure 5.4, for CC events with exiting tracks in figure 5.4 and for CC events in figure 5.4. The biases and resolutions of reconstructed neutrino energy are summarized in Table 5.6.
| Event selection | Bias (%) | Resolution (%) | |
| CC with contained track | -1 | 18 | |
| CC with exiting track | -4 | 20 | |
| CC | 0 | 13 | |
5.6.3 Neutrino Event Selection using CVN
The DUNE CVN classifies neutrino interactions in the DUNE FD through image recognition techniques. In general terms it is a CNN. Similar techniques have been demonstrated to outperform traditional methods in many aspects of high energy physics [Radovic:2018dip].
The primary goal of the CVN is to efficiently and accurately produce event selections of the following interactions: CC and CC in the FHC beam mode, and CC and CC in the rhc beam mode. Future goals will include studies of exclusive neutrino interaction final states since separating the event selections by interaction type can improve the sensitivity as interaction types have different energy resolutions and systematic uncertainties. Detailed descriptions of the CVN architecture can be found in [Aurisano:2016jvx].
An important feature for the DUNE CVN is the fine-grained detail of a LArTPC encoded in the input images to be propagated further into the CVN. This detail is more than what would be possible using a traditional CNN, such as the GoogLeNet-inspired network (also called Inception v1) [GoogLeNet] used by NOvA [Aurisano:2016jvx]. To accomplish this, the CVN design is based on the SE-ResNet architecture, which consists of a standard ResNet (residual neural network) architecture [He-et-al-2015-deep] along with Squeeze-and-Excitation blocks [Hu-et-al-2017-squeeze]. Residual neural networks allow the layer access to the output of both the layer and the layer via a residual connection, where is a positive integer ().
In order to build the training input to the DUNE CVN three images of the neutrino interactions are produced, one for each of the three readout views, using the reconstructed hits on the individual wire planes. The images are not dependent on any further downstream reconstruction algorithms. The images contain 500 500 pixels, each in the (wire, time) parameter space, where the wire is the wire channel number and the time is the peak time of the reconstructed hit. The value of each pixel represents the integrated charge of the reconstructed hit. An example simulated 2.2 GeV CC interaction is shown in all three views in Figure 5.5 demonstrating the fine-grained detail available from the LArTPC technology.
 |
The CVN is trained using approximately three million neutrino interactions from the MC simulation. An independent sample is used to generate the physics measurement sensitivities. The training sample is chosen to ensure similar numbers of training examples from the different neutrino flavors. Validation is performed to ensure that similar classification performance is obtained for the training and test samples, i.e., the CVN is not overtrained.
For the analysis presented here, we have used the primary output of the CVN, namely the neutrino flavor which returns probabilities that each interaction is one of the following classes: CC, CC, CC and NC.
Neutrino Flavor Identification Efficiency
The primary goal of the CVN algorithm is to accurately identify CC interactions and CC interactions to allow for the selection of the samples required for the neutrino oscillation analysis. The CC probability distribution, , and the CC probability distribution, , are shown on the left and right of Figure 5.6, respectively. Excellent separation between the signal and background interactions is seen in both cases.
The CC event selection uses events where for an interaction to be considered a candidate event of this type. Similarly, interactions are selected as CC candidates if . Note that since all of the flavor classification probabilities must sum to one, the interactions selected in the two event selections are completely independent. The same selection criteria are used for both FHC and RHC beam modes. The values used in the selection criteria were optimized to produce the best sensitivity.
Figure 5.7 shows the efficiency as a function of reconstructed energy (under the electron neutrino hypothesis) for the event selection. The efficiency in both the FHC and RHC beam modes exceeds 90% in the neutrino flux peak. Figure 5.8 shows the corresponding excellent selection efficiency for the event selection.


Neutrino Flavor Identification Robustness
A common concern on the applications of Deep Learning in high energy physics is the potential for differences in performance between data and simulation. Work is in progress to evaluate the DUNE CVN using data from a large DUNE prototype, ProtoDUNE-SP [Abi:2017aow]. While the data-based validation is underway a thorough investigation of the selection efficiency as a function of various event kinematics was carried out. The results of the investigation is that the CVN selection does not suffer from model dependence at a level that would undermine the conclusions of the oscillation analysis studies. All efficiency curves are consistent with a few key observations.
The ability of the CVN to identify neutrino flavor is dependent on its ability to resolve and identify the charged lepton. Backgrounds are induced by mis-identification of charged pions for disappearance, and photons for appearance samples. Efficiency for these backgrounds tracks directly with the momentum and isolation of the energy depositions from the pions and photons. Efficiency was also observed to drop as a function of track/shower angle when energy depositions aligned with wire planes. The shapes of the efficiency functions in lepton momentum, lepton angle, and hadronic energy fraction (inelasticity) were all observed to be consistent with results from previous studies, including hand scans of LArTPC simulations. It is still conceivable that the efficacy is increased, especially at low charged lepton momentum, by the CVN identifying fine details of model dependent event kinematics. However, these effects are small enough to be covered by the assigned uncertainties.
Experience in ensuring robustness of deep learning image recognition techniques already exists within the community; similar techniques will be applied to future DUNE analyses. For example, the NOvA experiment uses a technique that takes clear CC interactions identified in data and simulation and removes all of the reconstructed hits associated with the reconstructed muon track. The reconstructed muon is replaced by a simulated electron with the same kinematic variables [Sachdev:2015hpa, Gandrajula:2018ytr]. This procedure was originally developed by MINOS [Boehm:2009zz], and allows a large sample of data-like electron neutrino interactions to be studied and excellent agreement was seen between the performance of the event selection for data and simulation. This approach will prove critical once DUNE begins data taking to ensure the performance of the CVN is the same for data and simulation.
5.6.4 FD Neutrino Interaction Samples
A complete neutrino interaction event simulation has been implemented, including realistic neutrino energy reconstruction and event selection algorithms which yields an appropriately accurate representation of the FD samples to be used in the long-baseline oscillation analysis. The samples used in the sensitivity studies presented in this document require event by event simulations that effectively produce the convolution of the neutrino flux model, neutrino-argon scattering models, and models of the detector response. This last step must include estimates of energy smearing and bias, as well as the impact of a realistic event selection on signal acceptance and background rejection rates. This section has outlined the methods used to implement these algorithms. The final product is the selected FD event samples shown as a function of reconstructed neutrino energy in Section 5.2. Figure shows the and appearance spectra and Figure shows the and disappearance spectra. Tables and provide the signal and background event rates for the appearance and disappearance analyses, respectively. Based on these predictions we observe the largest background to the CC appearance signal to be the intrinsic beam interactions. There is also a contribution from misidentified neutral current interactions as well as small contributions from misidentified and interactions. The disappearance signal has negligible background, though there is a significant “wrong-sign” component in the sample.
5.7 Detector Model and Uncertainties
Detector effects impact the event selection efficiency as well as the reconstruction of quantities used in the oscillation fit, such as neutrino energy. The main sources of detector systematic uncertainties are limitations of calibration and modeling of particles in the detector. While neutrino interaction uncertainties can also affect reconstruction, this section is focused on effects that arise from the detectors.
The near LArTPC detector uses a similar technology as the far detector, namely they are both LArTPCs. However, important differences lead to uncertainties that do not fully correlate between the two detectors. First, the readout technology is different, as the near LArTPC uses pixels as well as a different, modular photon detector. Therefore, the charge response to particle types (e.g., muons and protons) will be different between near and far due to differences in electronics readout, noise, and local effects like alignment. Second, the high-intensity environment of the ND complicates associating detached energy deposits to events, a problem which does not exist in the FD. Third, the calibration programs will be different. For example, the ND has a high-statistics calibration sample of through-going, momentum-analyzed muons from neutrino interactions in the upstream rock, which does not exist for the FD. Finally, the reconstruction efficiency will be inherently different due to the relatively small size of the ND. Containment of charged hadrons will be significantly worse at the ND, especially for events with energetic hadronic showers or with vertices near the edges of the fiducial volume. Detector systematic uncertainties in the GArTPC at the near site will be entirely uncorrelated to the FD.
5.7.1 Energy Scale Uncertainties
An uncertainty on the overall energy scale is included in the analysis presented here, as well as particle response uncertainties that are separate and uncorrelated between four species: muons, charged hadrons, neutrons, and electromagnetic showers. In the ND, muons reconstructed by range in LAr and by curvature in MPD are treated separately. The energy scale and particle response uncertainties are allowed to vary with energy; each term is described by three free parameters:
| (5.12) |
where is the nominal reconstructed energy, is the shifted energy, and , , and are free fit parameters that are allowed to vary within a priori constraints. The energy scale and resolution parameters are conservatively treated as uncorrelated between the ND and FD. With a better understanding of the relationship between ND and FD calibration and reconstruction techniques, it may be possible to correlate some portion of the energy response. The full list of energy scale uncertainties is given as Table . Uncertainties on energy resolutions are also included and are taken to be 2% for muons, charged hadrons, and EM showers and 40% for neutrons.
[Energy scale systematics]c|ccctab:EscaleSysts
Uncertainties applied to the energy response of various particles. , , and correspond to the constant, square root, and inverse square root terms in the energy response parameterization given in Equation 5.12. All are treated as uncorrelated between the ND and FD.
Particle
\toprowruleall (except muons) 2% 1% 2%
(range) 2% 2% 2%
(curvature) 1% 1% 1%
p, 5% 5% 5%
e, , 2.5% 2.5% 2.5%
n 20% 30% 30%
The scale of these uncertainties is derived from recent experiments, including calorimetric based approaches (NOvA, minerva) and LArTPCs (LArIAT, MicroBooNE, ArgoNeuT). On NOvA [NOvA:2018gge], the muon (proton) energy scale achieved is % (5%). Uncertainties associated to the pion and proton re-interactions in the detector medium are expected to be controlled from ProtoDUNE and LArIAT data, as well as the combined analysis of low density (gaseous) and high density (LAr) NDs. Uncertainties in the E field also contribute to the energy scale uncertainty, and calibration is needed (with cosmics at ND, laser system at FD) to constrain the overall energy scale. The recombination model will continue to be validated by the suite of LAr experiments and is not expected to be an issue for nominal field provided minimal E field distortions. Uncertainties in the electronics response are controlled with dedicated charge injection system and validated with intrinsic sources, Michel electrons and 39Ar.
The response of the detector to neutrons is a source of active study and will couple strongly to detector technology. The validation of neutron interactions in LAr will continue to be characterized by dedicated measurements (e.g., CAPTAIN [Berns:2013usa, Bhandari:2019rat]) and the LAr program (e.g., ArgoNeuT [Acciarri:2018myr]). However, the association of the identification of a neutron scatter or capture to the neutron’s true energy has not been demonstrated, and significant reconstruction issues exist, so a large uncertainty (20%) is assigned comparable to the observations made by MINERvA [Elkins:2019vmy] assuming they are attributed entirely to the detector model. Selection of photon candidates from is also a significant reconstruction challenge, but a recent measurement from MicroBooNE indicates this is possible and the invariant mass has an uncertainty of 5%, although with some bias [Adams:2018sgn].
5.7.2 Acceptance and Reconstruction Efficiency Uncertainties
The ND and FD have different acceptance to CC events due to the very different detector sizes. The FD is sufficiently large that acceptance is not expected to vary significantly as a function of event kinematics. However, the ND selection requires that hadronic showers be well contained in LAr to ensure a good energy resolution, resulting in a loss of acceptance for events with energetic hadronic showers. The ND also has regions of muon phase space with lower acceptance due to tracks exiting the side of the TPC but failing to match to the MPD.
Uncertainties are evaluated on the muon and hadron acceptance of the ND. The detector acceptance for muons and hadrons is shown in Figure . Inefficiency at very low lepton energy is due to events being misreconstructed as neutral current, which can also be seen in Figure . For high energy, forward muons, the inefficiency is only due to events near the edge of the fiducial volume where the muon happens to miss the MPD. At high transverse momentum, muons begin to exit the side of the LAr active volume, except when they happen to go along the 7 m axis. The acceptance is sensitive to the modeling of muons in the detector. An uncertainty is estimated based on the change in the acceptance as a function of muon kinematics. This uncertainty can be constrained with the MPD by comparing the muon spectrum in CC interactions between the liquid and gaseous argon targets. The acceptance in the MPD is expected to be nearly 4 due to the excellent tracking and lack of scattering in the detector. Since the target nucleus is the same, and the two detectors are exposed to the same flux, the ratio between the two detectors is dominated by the LAr acceptance. Given the rate in the MPD, the expected constraint is at the level of 0.5% in the peak and 3% in the tail.
Inefficiency at high hadronic energy is due to the veto on more than 30 MeV deposited in the outer 30 cm collar of the active volume. Rejected events are typically poorly reconstructed due to low containment, and the acceptance is expected to decrease at high hadronic energy. Similar to the muon reconstruction, this acceptance is sensitive to detector modeling, and an uncertainty is evaluated based on the change in the acceptance as a function of true hadronic energy. This is more difficult to constrain with the MPD because of the uncertain mapping between true and visible hadronic energy in the LAr.
5.8 Sensitivity Methods
Sensitivities to the neutrino mass ordering, CP violation, and octant, as well as expected resolution for neutrino oscillation parameter measurements, are obtained by simultaneously fitting the , , , and far detector spectra along with selected samples from the near detector. It is assumed that 50% of the total exposure is in neutrino beam mode and 50% in antineutrino beam mode. A 50%/50% ratio of neutrino to antineutrino data has been shown to produce a nearly optimal and mass ordering sensitivity, and small deviations from this (e.g., 40%/60%, 60%/40%) produce negligible changes in these sensitivities.
In the sensitivity calculations, neutrino oscillation parameters governing long-baseline neutrino oscillation are allowed to vary. In all sensitivities presented here (unless otherwise noted) is constrained by a Gaussian prior with 1 width as given by the relative uncertainty shown in Table 5.1, while , , and are allowed to vary freely. The oscillation parameters and are allowed to vary constrained by the uncertainty in Table 5.1. The matter density of the earth is allowed to vary constrained by a 2% uncertainty on its nominal value. Systematic uncertainty constraints from the near detector are included either by explicit inclusion of ND samples within the fit or by applying constraints expected from the ND data to FD-only fits.
The experimental sensitivity is quantified using a test statistic, , which is calculated by comparing the predicted spectra for alternate hypotheses. The details of the sensitivity calculations are described in Section 5.8.2. A “typical experiment” is defined as one with the most probable data given a set of input parameters, i.e., in which no statistical fluctuations have been applied. In this case, the predicted spectra and the true spectra are identical; for the example of CPV, is identically zero and the value for a typical experiment is given by . The interpretation of has been discussed in [Qian:2012zn, Blennow:2013oma]; it may be interpreted as approximately equivalent to significance in for .
DUNE sensitivity has been studied using several different fitting frameworks. General Long-Baseline Experiment Simulator (GLoBES) [Huber:2004ka, Huber:2007ji] -based fits have been used extensively in the past, in particular for sensitivity studies presented in the DUNE CDR; details are available in [Acciarri:2015uup, Alion:2016uaj, Bass:2014vta]. GLoBES is now used primarily for studies in support of algorithm development and optimization. valor [valorweb] has also been used for internal studies. The sensitivities presented in this document are calculated using the CAFAna analysis framework described below.
5.8.1 The DUNE Analysis Framework
To demonstrate the sensitivity reach of DUNE, we have adopted the analysis framework known as cafana [CAFAna]. This framework was developed for the NOvA experiment and has been used for -disappearance, -appearance, and joint fits, plus sterile neutrino searches and cross-section analyses. Unless otherwise noted, sensitivity results presented in this document are performed within CAFAna.
In the sensitivity studies, the compatibility of a particular oscillation hypothesis with the data is evaluated using the likelihood appropriate for Poisson-distributed data [Tanabashi:2018oca]:
| (5.13) |
where is the MC expectation in bin and is the observed count. Most often the bins here represent reconstructed neutrino energy, but other observables, such as reconstructed kinematic variables or event classification likelihoods may also be used. Multiple samples with different selections can be fit simultaneously, as can multi-dimensional distributions of reconstructed variables.
Event records representing the reconstructed properties of neutrino interactions and, in the case of MC, the true neutrino properties are processed to fill the required histograms. Oscillated FD predictions are created by populating 2D histograms, with the second axis being the true neutrino energy, for each oscillation channel (). These are then reweighted as a function of the true energy axis according to an exact calculation of the oscillation weight at the bin center and summed to yield the total oscillated prediction:
| (5.14) |
where is the probability for a neutrino created in flavor state to be found in flavor state at the FD. represents the number of selected events in bin of the reconstructed variable with true energy , taken from a simulation where neutrinos of flavor from the beam have been replaced by equivalent neutrinos in flavor . Oscillation parameters that are not displayed in a given figure are profiled over using minuit [James:1994vla]. That is, their values are set to those that produce the best match with the simulated data at each point in displayed parameter space.
Systematic uncertainties are included to account for the expected uncertainties in the beam flux, neutrino interaction, and detector response models used in the simulation at the time of the analysis. The neutrino interaction systematic uncertainties expand upon the existing GENIE systematic uncertainties to include recently exposed data/MC differences that are not expected to be resolved by the time DUNE starts running. The impact of systematic uncertainties is included by adding additional nuisance parameters into the fit. Each of these parameters can have arbitrary effects on the MC prediction, and can affect the various samples and channels within each sample in different ways. These parameters are profiled over in the production of the result. The range of these parameters is controlled by the use of Gaussian penalty terms to reflect our prior knowledge of reasonable variations.
For each systematic parameter under consideration, the matrices are evaluated for a range of values of the parameter, by default . The predicted spectrum at any combination of systematic parameters can then be found by interpolation. Cubic interpolation is used, which guarantees continuous and twice-differentiable results, advantageous for gradient-based fitters such as minuit.
For many systematic variations, a weight can simply be applied to each event record as it is filled into the appropriate histograms. For others, the event record itself is modified, and for a few systematic uncertainties it is necessary to use an entirely separate sample that has been simulated with some alteration made to the simulation parameters.
5.8.2 DUNE Sensitivity Studies
DUNE sensitivity studies are performed using the CAFAna framework, which works as described in the previous section. Sensitivity calculations for CPV, neutrino mass ordering, and octant are performed, in addition to studies of oscillation parameter resolution in one and two dimensions. The experimental sensitivity and resolution functions are quantified using a test statistic, , which is calculated by comparing the predicted spectra for alternate hypotheses. These quantities are defined for neutrino mass ordering, octant, and CPV sensitivity as follows:
| (5.15) | |||||||
| (5.16) | |||||||
| ^test=0),Δχ^2_CP(^test=π)], | (5.17) | ||||||
where , and is defined in Equation 5.14. Where appropriate, a scan is performed over all possible values of , and the neutrino mass ordering and the octant are also assumed to be unknown and are free parameters. The lowest value of is obtained by finding the combination of fit parameters that best describe the simulated data. The size of is a measure of how well those data can exclude this alternate hypothesis given the uncertainty in the model.
The expected resolution for oscillation parameters is determined from the spread in best-fit values obtained from an ensemble of data sets that vary both statistically and systematically. For each data set, the true value of each nuisance parameter is chosen randomly from a distribution determined by the a priori uncertainty on the parameter. For some studies, oscillation parameters are also randomly chosen as described in Table . Poisson fluctuations are then applied to all analysis bins, based on the mean event count for each bin after the systematic adjustments have been applied. For each simulated data set in the ensemble, the test statistic is minimized, and the best-fit value of all parameters is determined. When calculating values from Equation 5.15, both of the individual values used are calculated with the same data set. The one-sigma resolution is defined as the width of the interval around the true value containing 68% of simulated data sets. An alternative method of determining parameter resolutions, namely by identifying the range of parameters satisfying , is also used for some studies.
[Oscillation parameter throws]
ccc
table:OA_throw
Treatment of the oscillation parameters for the simulated data set studies. The width of the range is determined from the NuFIT 4.0 result.
Parameter Prior Range
\toprowrule Uniform [0.4; 0.6]
( eV2) Uniform |[2.3;2.7]|
() Uniform [-1;1]
Gaussian NuFIT 4.0
The DUNE oscillation sensitivities presented here include four FD CC samples binned as a function of reconstructed neutrino energy: , , , and . Systematic parameters are constrained by unoscillated ND and CC samples selected from the LAr TPC and binned in two dimensions as a function of reconstructed neutrino energy () and reconstructed Bjorken (i.e. inelasticity).
For some systematic uncertainties, such as uncertainties on the neutrino flux (Section 5.4), the natural treatment leads to a large number of parameters that have strongly-correlated effects on the predicted spectrum. In this case, PCA is used to create a greatly reduced set of systematic parameters which cover the vast majority of the allowed variation, and remove degenerate parameters. The flux PCA is described in Section 5.8.2.
Information from the ND, which is used to constrain systematic uncertainties, is included via additional contributions (Equation 5.14) without oscillations. Specific ND samples such as neutrino-electron elastic scattering and off-axis samples may be included separately. External constraints, for example from solar neutrino experiments, can be included as an arbitrary term in the depending on the oscillation parameters. In practice, a quadratic term, corresponding to a Gaussian likelihood, is used.
Covariance matrix for ND uncertainties
Far detector energy scale and resolution uncertainties are treated as nuisance parameters in the oscillation fits. These parameters are allowed to vary, and in practice become very weakly constrained in Asimov fits due to the limited statistics of the FD. Detector uncertainties in the ND, in contrast, are included by adding a covariance matrix to the calculation. This choice protects against overconstraining that could occur given the limitations of the parameterized ND reconstruction described in Section 5.5.2 taken together with the high statistical power at the ND. This covariance matrix is constructed with a many-universes technique. In each universe, all ND energy scale, resolution, and acceptance parameters are simultaneously thrown according to their respective uncertainties. The resulting spectra, in the same binning as is used in the oscillation sensitivity analysis, are compared with the nominal prediction to determine the bin-to-bin covariance.
Implementation of flux uncertainties
Uncertainties on the flux prediction are described by a covariance matrix, where each bin corresponds to an energy range of a particular beam mode, neutrino species, and detector location. The covariance matrix includes all beam focusing uncertainties evaluated by reproducing the simulation many times, each with simultaneous random variations in the underlying hadron production model. Each random model variation is referred to as a universe. The matrix used is bins, despite having only 30 input uncertainties (and thus 30 significant eigenvalues). To evaluate the impact of these uncertainties on the long-baseline oscillation sensitivity, it is possible to include each focusing parameter, and each hadron production universe, as separate nuisance parameters. It is also possible to treat each bin of the prediction as a separate nuisance parameter, and include the covariance matrix in the log-likelihood calculation. However, both of these options are computationally expensive, and would include many nuisance parameters with essentially no impact on any distributions.
Instead, a principal component analysis is used, primarily to improve the computational performance of the analysis by reducing the number of parameters while still capturing the same physical effects. The covariance matrix is diagonalized, and each principal component is treated as an uncorrelated nuisance parameter. The 208 principal components are ordered by the magnitude of their corresponding eigenvalues, and only the first 30 are large enough that they need to be included. By the 10th principal component, the eigenvalue is 1% of the 0th eigenvalue. Since the time required to perform a fit scales linearly with the number of nuisance parameters, including only 30 principal components reduces the computing time by an order of magnitude.
This is purely a mathematical transformation; the same effects are described by the PCA as by a full analysis, including correlations between energy bins. As expected, the largest uncertainties correspond to the largest principal components. This can be seen in Figure . The largest principal component matches the hadron production uncertainty on nucleon-nucleus interactions in a phase space region not covered by data (N+A unconstrained). Components 3 and 7 correspond to the data-constrained uncertainty on proton interactions in the target producing pions and kaons, respectively. Components 5 and 11 correspond to two of the largest focusing uncertainties, the density of the target and the horn current, respectively. Other components not shown either do not fit a single uncertain parameter and may represent two or more degenerate systematics or ones that produce anticorrelations in neighboring energy bins.
[Flux principal components]fig:fluxPCA Select flux principal components are compared to specific underlying uncertainties from the hadron production and beam focusing models. See text.
5.9 Sensitivities
Using the analysis framework described in the preceding sections, the simulated data samples for the far and near detectors are input to fits for CP violation sensitivity, mass ordering sensitivity, parameter measurement resolutions, and octant sensitivity. The results of these fits are presented in the following sections. Unless otherwise noted, all results include samples from both the near and far detectors and all systematic uncertainties are applied. Nominal exposures of seven, ten, and fifteen years are considered, where the staging plan described in Section 5.2, including a beam upgrade to 2.4 MW after six years, has been assumed. Results are shown as a function of the true values of oscillation parameters and/or as a function of exposure in staged years and/or kt-MW-years. In all cases, equal running in neutrino and antineutrino mode is assumed; no attempt is made to anticipate a realistic schedule of switching between neutrino and antineutrino mode. For the sake of simplicity, only true normal ordering is shown.
Possible variations of sensitivity are presented in several ways. For results at the nominal exposures, the sensitivity is calculated by performing fits in which the systematic parameters, oscillation parameters, and event rates are chosen at random, constrained in some cases by pre-fit uncertainties, as described in Section 5.8.2. A fit is performed for each of these simulated data sets or “throws;” the nominal result is the median of these fit results and the uncertainty band is calculated to be the interval containing 68% of the fit results. For these results, the uncertainty band is drawn as as transparent filled area. In other cases, ranges of possible sensitivity results are explored by considering different true values of oscillation parameters or different analysis assumptions, such as removal of external constraints or variation in systematic uncertainties assumptions. For these results, a solid band indicates the range of possible results; this band is not intended to be interpreted as an uncertainty.
The exposures required to reach selected sensitivity milestones for the nominal analysis are summarized in Table 5.7. CP violation sensitivity is discussed in Section 5.9.1, neutrino mass ordering sensitivity is discussed in Section 5.9.2, and precision measurements of oscillation parameters are discussed in Section 5.9.3. The impact of the true values of oscillation parameters, systematic uncertainties, and near detector measurements are explored in Sections 5.9.4, 5.9.5, and 5.9.6, respectively.
| Physics Milestone | Exposure (staged years, = 0.580) | |
| \toprowrule5 Mass Ordering | 1 | |
| = - | ||
| 5 Mass Ordering | 2 | |
| 100% of values | ||
| 3 CP Violation | 3 | |
| = - | ||
| 3 CP Violation | 5 | |
| 50% of values | ||
| 5 CP Violation | 7 | |
| = - | ||
| 5 CP Violation | 10 | |
| 50% of values | ||
| 3 CP Violation | 13 | |
| 75% of values | ||
| Resolution of 10 degrees | 8 | |
| = 0 | ||
| Resolution of 20 degrees | 12 | |
| = - | ||
| Resolution of 0.004 | 15 | |
5.9.1 CP-Symmetry Violation
Figure 5.9 shows the significance with which CP violation () can be observed as a function of the true value of for exposures corresponding to seven and ten years of data, with equal running in neutrino and antineutrino mode, using the staging scenario described in Section 5.2. This sensitivity has a characteristic double peak structure because the significance of a CPV measurement necessarily drops to zero where there is no CPV: at the CP-conserving values of . The width of the transparent band represents 68% of fits when random throws are used to simulate statistical variations and select true values of the oscillation and systematic uncertainty parameters, constrained by pre-fit uncertainties. The solid curve is the median sensitivity. As illustrated in Section 5.9.4, variation in the true value of is responsible for a significant portion of this variation.

Figure 5.10 shows the significance with which CP violation can be determined for 75% and 50% of values, and when , as a function of exposure in years, using the staging scenario described in Section 5.2. It is not possible for any experiment to provide 100% coverage in for a CPV measurement because CPV effects vanish at certain values of . The changes in trajectory of the curves in the first three years results from the staging of far detector module installation; the change at 6 years is due to the upgrade from 1.2- to 2.4-MW beam power. The width of the bands show the impact of applying an external constraint on . As seen in Table 5.7, CP violation can be observed with 5 significance after about 7 years if = and after about 10 years for 50% of values. CP violation can be observed with 3 significance for 75% of values after about 13 years of running. Figure 5.11 shows the same CP violation sensitivity as a function of exposure in kt-MW-years. In the left plot, the width of the bands shows the impact of applying an external constraint on , while in the right plot, the width of the bands is the result of varying the true value of within the NuFIT 4.0 90% C.L. allowed region.
 |
 |
5.9.2 Mass Hierarchy
Figure 5.12 shows the significance with which the neutrino mass ordering can be determined as a function of the true value of , using the same exposures and staging assumptions described in the previous section. The characteristic shape results from near degeneracy between matter and CP-violating effects that occurs near for true normal ordering. As in the CP violation sensitivity, the solid curve represents the median sensitivity, the width of the transparent band represents 68% of fits when random throws are used to simulate statistical variations and select true values of the oscillation and systematic uncertainty parameters, constrained by pre-fit uncertainties, and variation in the true value of is responsible for a significant portion of this variation.

Figure 5.13 shows the significance with which the neutrino mass ordering can be determined for 100% of values, and when , as a function of exposure in years. The width of the bands show the impact of applying an external constraint on . Figure 5.14 shows the same sensitivity as a function of exposure in kt-MW-years. As DUNE will be able to establish the neutrino mass ordering at the 5- level for 100% of values after between two and three years, these plots extend only to seven years and 500 kt-MW-years, respectively.

 |
 |
Studies have indicated that special attention must be paid to the statistical interpretation of neutrino mass ordering sensitivities [Qian:2012zn, Blennow:2013oma] because the metric does not follow the expected chi-squared function for one degree of freedom, so the interpretation of the sensitivity given by the Asimov data set is less straightforward. The error band on the mass ordering sensitivity shown in Figure 5.12 includes this effect using the technique of statistical throws described in Section 5.8.2. The effect of statistical fluctuation and systematic uncertainties in the neutrino mass ordering sensitivity for values of in the range 0.56 to 0.60 is explored using random throws to determine the 1- and 2- ranges of possible sensitivity. The resulting range of sensitivities is shown in Figure 5.15, for 10 years of exposure.

5.9.3 Precision Oscillation Parameter Measurements
In addition to the discovery potential for neutrino mass hierarchy and CPV, DUNE will improve the precision on key parameters that govern neutrino oscillations, including: , , , and the octant of .
Figure 5.16 shows the resolution, in degrees, of DUNE’s measurement of , as a function of the true value of . The resolution of this measurement is significantly better near CP-conserving values of , compared to maximally CP-violating values. For fifteen years of exposure, resolutions between five and fifteen degrees are possible, depending on the true value of . A smoothing algorithm has been applied to interpolate between values of at which the full analysis has been performed.

Figures 5.17 and 5.18 show the resolution of DUNE’s measurements of and and of and , respectively, as a function of exposure in kt-MW-years. As seen in Figure 5.16, the resolution varies significantly with the true value of , but for favorable values, resolutions near five degrees are possible for large exposure. The DUNE measurement of approaches the precision of reactor experiments for high exposure, allowing a comparison between the two results, which is of interest as a test of the unitarity of the PMNS matrix.
 |
 |
 |
 |
One of the primary physics goals for DUNE is the simultaneous measurement of all oscillation parameters governing long-baseline neutrino oscillation, without a need for external constraints. Figure 5.19 shows the 90% C.L. allowed regions for and for 7, 10, and 15 years of running, when no external constraints are applied, compared to the current measurements from world data. Note that a degenerate lobe at higher values of is present in the 7-year exposure, but is resolved for higher exposures. Figure 5.20 shows the two-dimensional allowed regions for and . Figure 5.21 explores the resolution sensitivity that is expected for values of different from the NuFIT 4.0 central value. It is interesting to note that the lower exposure, opposite octant solutions for are allowed at 90% C.L. in the absence of an external constraint on ; however, at the 10 year exposure, this degeneracy is resolved by DUNE data without external constraint.


 |
 |
The measurement of oscillations is sensitive to , whereas the measurement of oscillations is sensitive to . A combination of both appearance and disappearance measurements can probe both maximal mixing and the octant. Figure 5.22 shows the sensitivity to determining the octant as a function of the true value of .

5.9.4 Impact of Oscillation Parameter Central Values
The sensitivity results presented in the preceding sections assume that the true values of the parameters governing long-baseline neutrino oscillation are the central values of the NuFIT 4.0 global fit, given in Table 5.1. In this section, variations in DUNE sensitivity with other possible true values of the oscillation parameters are explored. Figures 5.23, 5.24, and 5.25 show DUNE sensitivity to CP violation and neutrino mass ordering when the true values of , , and , respectively, vary within the 3 range allowed by NuFIT 4.0. The largest effect is the variation in sensitivity with the true value of , where degeneracy with and matter effects are significant. Values of in the lower octant lead to the best sensitivity to CP violation and the worst sensitivity to neutrino mass ordering, while the reverse is true for the upper octant. DUNE sensitivity for the case of maximal mixing is also shown. The true values of and are highly constrained by global data and, within these constraints, do not have a dramatic impact on DUNE sensitivity.
 |
 |
 |
 |
 |
 |
5.9.5 Impact of Systematic Uncertainties
Implementation of systematic uncertainties in the nominal fits are described in Sections 5.3, 5.4, and 5.7. All considered systematic parameters are summarized in Table 5.8. In the nominal fits, many systematic uncertainties are constrained by DUNE data, as described in the following section.
| Brief Name | Description of Uncertainty |
| Flux: | |
| flux[N] | Nth component of flux PCA |
| Interaction Model: | |
| MaCCQE | Axial mass for CCQE |
| VecFFCCQEshape | Choice of CCQE vector form factors |
| MaCCRES | Axial mass for CC resonance |
| MvCCRES | Vector mass for CC resonance |
| Theta Delta2Npi | distribution in decaying rest frame |
| AhtBY | higher-twist param in BY model scaling variable |
| BhtBY | higher-twist param in BY model scaling variable |
| CV1uBY | valence GRV98 PDF correction param in BY model |
| CV2uBY | valence GRV98 PDF correction param in BY model |
| MaNCEL | Axial mass for NC elastic |
| MaNCRES | Axial mass for NC resonance |
| MvNCRES | Vector mass for NC resonance |
| FrCEx N | Nucleon charge exchange probability |
| FrElas N | Nucleon elastic reaction probability |
| FrInel N | Nucleon inelastic reaction probability |
| FrAbs N | Nucleon absorption probability |
| FrPiProd N | Nucleon -production probability |
| FrCEx pi | charge exchange probability |
| FrElas pi | elastic reaction probability |
| FrInel pi | inelastic reaction probability |
| FrAbs pi | absorption probability |
| FrPiProd pi | -production probability |
| BeRPA A | Random Phase Approximation tune: controls low |
| BeRPA B | Random Phase Approximation tune: controls low-mid |
| BeRPA D | Random Phase Approximation tune: controls mid |
| Mnv2p2hGaussEnhancement | Extra strength into 2p2h |
| C12ToAr40 2p2hScaling nu | neutrino 2p2h Ar/C scaling |
| C12ToAr40 2p2hScaling nubar | antineutrino 2p2h Ar/C scaling |
| E2p2h [A,B] [nu,nubar] | 2p2h energy dependence |
| SPPLowQ2Suppression | Low (empirical) suppression |
| MKSPP ReWeight | MK model - alternative strength in W |
| NR nu np CC 1Pi | Norm for |
| NR [nu,nubar] [p,n] [CC,NC] [1,2,3]Pi | non-resonant pion production topology norms |
| nuenumu xsec ratio | / uncertainty in unique phase space |
| nuenuebar xsec ratio | Modification of / and / xsec |
| Detector Effects: | |
| FVNueFD | FD fiducial volume |
| FVNueFD | FD fiducial volume |
| FDRecoNueSyst | FD selection |
| FDRecoNumuSyst | FD selection |
| ChargedHadResFD | FD charged hadron resolution |
| EMResFD | FD electromagnetic shower resolution |
| MuonResFD | FD muon resolution |
| EMUncorrFD | FD electromagnetic shower energy scale |
| EScaleNFD | FD neutron visible energy scale |
| EScaleMuLArFD | FD muon energy scale |
| EScaleFD | FD overall energy scale |
Systematic Uncertainty Constraints
Prefit uncertainties on flux and cross section parameters are at the level of 10%. These uncertainties become constrained in the fit, especially by the ND. Figure shows the level of constraint on each systematic parameter after the fit. The larger band shows the constraint that arises from the far detector alone, while the inner band shows the (much stronger) constraint from the near detector. Figure compares the parameter constraints for two different exposures. The wider band shows the ND +FD constraint expected after 7 years, and the narrower band shows the constraint after 15 years. The effect of increasing the exposure is very small because the ND is already systematically limited in the CC channel after 7 years. The impact of adding the near detector is significant; flux and cross section parameters are very weakly constrained by the far detector alone. Parameters are implemented in such a way that there are no prefit correlations, but the constraints from the near detector cause parameters to become correlated, which is not shown in the figure.
Some uncertainties are not reduced by the ND. For example, the energy scale parameters are treated as uncorrelated between detectors, so naturally the ND does not constrain them. Several important cross section uncertainties are not constrained by the near detector. In particular, an uncertainty on the ratio of to cross sections is totally unconstrained. The most significant flux terms are constrained at the level of 20% of their a priori values. Less significant principal components have little impact on the observed distributions at either detector, and receive weaker constraints. Most cross section parameters that affect CC interactions are well constrained.
[Post-fit systematic uncertainties]fig:postfit_unc_ndfd The ratio of post-fit to pre-fit uncertainties for various systematic parameters for a 15-year staged exposure. The red band shows the constraint from the FD only in 15 years, while the green shows the ND +FD constraints. Systematic parameter names are defined in Table 5.8.
[Post-fit systematic uncertainties]fig:postfit_unc_vsexp The ratio of post-fit to pre-fit uncertainties for various systematic parameters for a ND +FD constraint after 7 and 15 years. The difference in parameter constraints due to increasing the exposure is very small. Systematic parameter names are defined in Table 5.8.
5.9.6 Impact of the Near Detector
The oscillation sensitivity analysis presented in the previous section is intended to demonstrate the full potential of DUNE, with constraints from the full suite of near detectors described in Volume I, Introduction to DUNE, Chapter 5, including the LAr TPC, MPD, SAND, and off-axis measurements. In addition to the and CC spectra used explicitly in this analysis, the LAr TPC is also expected to measure numerous exclusive final-state CC channels, including 1, 1, and multi-pion production. Measurements will be made as a function of other kinematic quantities in addition to reconstructed and , such as four-momentum transfer to the nucleus, lepton angle, or final-state meson kinematics. The LAr TPC will also measure the sum of and CC scattering, and NC events. Direct flux measurements will be possible with neutrino-electron elastic scattering, and the low- technique.
In addition to the many on-axis LAr samples, a complementary set of neutrino-argon measurements is expected from the HPG TPC. This detector will be sensitive to charged tracks at kinetic energies of just a few MeV, enabling the study of nuclear effects in unprecedented detail. It will also sign-select all charged particles, with nearly perfect pion-proton separation from dE/dx out to over 1 GeV/c momentum, so that high-purity measurements of CC1 and CC1 are possible. It may be possible to directly measure neutron energy spectra from time of flight using the HPG TPC coupled to a high-performance ECAL. The SAND on-axis beam monitor will measure neutrino-carbon scattering and neutron production while ensuring excellent beam stability.
The LAr and MPD will also move off-axis to measure neutrino-argon interactions in many different fluxes. This will provide a direct constraint on the relationship between neutrino energy and visible energy in LAr. By taking linear combinations of spectra at many off-axis positions, it is possible to reproduce the expected FD energy spectrum for a given set of oscillation parameters and directly measure visible energy.
All of these capabilities of the ND benefit the DUNE physics program. However, due to the timing of the ND process, design details of the ND are not available at the time of preparing this document, and it is not practical to include all of these samples and demonstrate their impact on oscillation sensitivity directly. Instead, we assume a model that implicitly includes these constraints, with further direct demonstration planned for the ND TDR.
The neutrino interaction model uncertainties shown in Section 5.4 represent our current knowledge of neutrino interactions, motivated by measurements wherever possible. The DUNE ND is able to constrain these uncertain parameters, as demonstrated in the previous section. However, due to the complexity of modeling neutrino-argon interactions, and the dearth of neutrino-argon measurements in the energy range relevant for DUNE, this is a necessary but insufficient condition for the ND program. There are possible variations to the interaction model that cannot be readily estimated, simply because we have yet to observe the inadequacy of the model. While these “unknown unknowns” are impossible to predict, guarding against them is critically important to the success of the DUNE physics program. For this reason, the ND is designed under the assumption that it must not only constrain some finite list of model parameters, but also be sensitive to general modeling deficiencies.
The sensitivity analysis presented in the previous section assumes the success of the ND program. Because of this assumption, in order to estimate the expected sensitivity without a ND, it is not sufficient to simply remove the on-axis LAr ND sample that is explicitly included in the analysis. We must also account for other potential biases from the interaction model, the “unknown unknowns.” In this section, we consider two simple examples of bias, and evaluate the potential impact on oscillation parameter measurements in a scenario where the ND capacity is reduced. In Section 5.9.6, we consider the case where there is no near detector, and show a “mock data” sample that results in a high-quality FD-only fit with a significant bias in the measured value of . This bias would be undetectable with a FD-only fit, but easily detected at the ND. In Section 5.9.6, we consider an alternative mock data set that gives a high-quality fit to the FD as well as the on-axis ND spectra, but has significant biases that are easily detected with off-axis ND data. These bias tests are not meant as exact estimates of the reduction in sensitivity that would be expected without a ND or with only on-axis ND, but they do serve as examples of the kind of bias that is possible. By estimating an additional uncertainty on oscillation parameters to cover the observed bias, it is possible to produce a sensitivity estimate; however, as it is based on one single possible bias, it should be considered a lower bound on the potential reduction in sensitivity.
Bias study: FD-only fit to NuWro
An alternative Monte Carlo sample is produced by reweighting the GENIE simulated events to NuWro. The objective of the reweighting is to reproduce the NuWro event spectra as a function of reconstructed neutrino energy, but without re-running the reconstruction. Simple reweighting schemes typically determine weights by taking the ratio between two generators in some limited kinematic space of true quantities. A common shortcoming of such techniques is that the reconstructed energy depends on many true quantities, and perhaps in a complicated way. Defining weights in a limited space effectively projects away any differences in other variables. To overcome this limitation, 18 true quantities that impact the reconstructed neutrino energy are identified: neutrino energy, lepton energy, lepton angle, , , , , as well as the number and total kinetic energy carried by protons, neutrons, , , , and the number of electromagnetic particles. A BDT is trained on vectors of these 18 quantities in GENIE and NuWro. The BDT minimizes a logistic loss function between GENIE and NuWro in the 18-dimensional space, producing a set of weights. When these weights are applied to GENIE events, the resulting event spectra match the NuWro spectra in all 18 quantities.
The resulting selected samples of FD and CC events in FHC and RHC beam modes are fit using the nominal GENIE-based model and its uncertainties as described in Sections 5.4 and 5.7. The fit quality in the FD-only scenario is high, with per degree of freedom smaller than unity for all oscillation parameters. Systematic nuisance parameters are pulled from their best fit values by more than 0.6.
The best-fit value of is determined for the full range of possible true values between and . The difference between the best-fit and true values of is found to be less than 14 degrees for 68% of the true values. To estimate the impact of such a bias on CP-violation sensitivity, an uncertainty equal to 14 degrees is added to the resolution in quadrature. For a 10-year staged DUNE FD exposure, the resulting resolution is shown in the left panel of Figure compared to the nominal sensitivity with the ND included. In the ND +FD (nominal) fit the bias is excluded, because in the ND the bias is easily detected and not attributable to oscillations. To estimate the sensitivity to nonzero CP violation as shown in the right panel of Figure , the nominal FD-only curve is reduced by the fractional increase in the resolution at each point. The latter step is necessary because the uncertainty on is not Gaussian.
[Oscillation sensitivities including example FD-only bias]fig:nuwro_bias
The CP violation sensitivity for a FD-only scenario with an additional uncertainty added to cover the observed bias from one example variation. The resolution (left) and CP violation sensitivity (right) are compared to the results from the nominal ND +FD analysis.
![[Uncaptioned image]](2002.03005v2/graphics/dcpres_nuwrobias_2019_v4.png)
![[Uncaptioned image]](2002.03005v2/graphics/cpv_nuwrobias_2019_v4.png)
As seen in Figure , the reduction in experimental sensitivity that would result from treating this example bias as a systematic uncertainty, which would be required in the absence of near detector data, is dramatic. Many other reasonable variations of the neutrino interaction model are allowed by world data and would also have to be considered as potential sources of uncertainty without near detector data to observe and resolve model incompatibility.
Bias study: shifted visible energy
As another example, we consider a possible deficiency of the GENIE model, specifically the case where the energy of final-state protons is reduced by 20%, with the energy going to neutrons instead. As neutrons are generally not observed, this will modify the relationship between neutrino energy and visible energy at the ND and FD. At the same time, the cross section model is altered so that the distribution of proton kinetic energy is unchanged. This alternate model is perfectly consistent with all available data; there is no reason to prefer our nominal GENIE model to this one.
By construction, this alternate model will not affect the fit at the on-axis near detector, as the cross section shift exactly cancels the loss in hadronic visible energy due to changing protons for neutrons. Nuisance parameters that affect the near detector spectra, namely flux and cross section uncertainties, are not pulled and remain at their nominal values with the same post-fit uncertainties observed in the Asimov sensitivity. At the far detector, however, the different neutrino energy spectrum leads to an observed shift in reconstructed energy with respect to the nominal prediction, visible in Figure .
[Shifted proton energy FD spectra]fig:missingProton_spectra Predicted distributions of reconstructed neutrino energy for selected (top) and (bottom) events, in FHC (left) and RHC (right) beam modes in 7 years. The black curve shows the nominal GENIE prediction, while the red points are the mock data, where 20% of proton energy is shifted to neutrons. The blue curve is the post-fit result, where systematic and oscillation parameters are shifted to match the mock data. The ND spectra match the pre-fit prediction by construction and are not shown.
Measured oscillation parameters returned by this fit are biased with respect to their true values. In particular, the best-fit values of and sin are significantly incorrect, as shown in Figure . Other parameters, including , happen not to be pulled significantly from their true values by this particular model variation.
[-sin contour for shifted proton energy]fig:missingProton_dm2th23
Results of a fit to mock data where 20% of proton energy is shifted to neutrons. The true values of and sin are given by the star, while the allowed 90% C.L. regions are drawn around the best-fit point, for 7, 10, and 15 years of exposure. The solid region shows the result for a fit using the mock data, while the dashed curve shows the result for a fit using nominal simulation, for comparison.
![[Uncaptioned image]](2002.03005v2/graphics/bubbles_enerbybias.png)
While the nominal model gives a good fit to the mock data in the on-axis ND, reconstructed spectra from off-axis ND data give a poor fit. This occurs because the cancellation between the cross section shift and the final-state proton-to-neutron ratio is dependent on the true neutrino energy spectrum. Off-axis data access different neutrino energy spectra, where the relationship is broken. By combining data at many off-axis positions, it is possible to produce a data-driven prediction of the expected FD flux for a given set of oscillation parameters, and directly compare this to the observation. Such a technique is not possible with solely on-axis ND data. This example demonstrates the importance of a capable ND, including the capability for off-axis measurements, to constrain not only the uncertain parameters of the interaction model, but also the physics in the model itself.
5.10 Conclusion
The studies presented in this chapter are based on full, end-to-end simulation, reconstruction, and event selection of FD Monte Carlo and parameterized analysis of ND Monte Carlo. Detailed uncertainties from flux, the neutrino interaction model, and detector effects have been included in the analysis. Sensitivity results are obtained using a sophisticated, custom fitting framework. These studies demonstrate that DUNE will be able to achieve its primary physics goals of measuring to high precision, unequivocally determining the neutrino mass ordering, and making precise measurements of the oscillation parameters governing long-baseline neutrino oscillation. It has also been demonstrated that accomplishing these goals relies upon accumulated statistics from a well-calibrated, full-scale FD, operation of a 1.2-MW beam upgraded to 2.4 MW, and detailed analysis of data from a highly capable ND.
DUNE will be able to establish the neutrino mass ordering at the 5 level for 100% of values after between two and three years. CP violation can be observed with 5 significance after about 7 years if = and after about 10 years for 50% of values. CP violation can be observed with 3 significance for 75% of values after about 13 years of running. For 15 years of exposure, resolution between five and fifteen degrees are possible, depending on the true value of . The DUNE measurement of approaches the precision of reactor experiments for high exposure, allowing measurements that do not rely on an external constraint and facilitating a comparison between the DUNE and reactor results, which is of interest as a potential signature for beyond the standard model physics. DUNE will have significant sensitivity to the octant for values of less than about 0.47 and greater than about 0.55.
These measurements will make significant contributions to completion of the standard three-flavor mixing picture and guide theory in understanding if there are new symmetries in the neutrino sector or whether there is a relationship between the generational structure of quarks and leptons. Observation of CP violation in neutrinos would be an important step in understanding the origin of the baryon asymmetry of the universe. Precise measurements made in the context of the three-flavor paradigm may also yield inconsistencies that point us to physics beyond the standard three-flavor model.
Chapter 6 GeV-Scale Non-accelerator Physics Program
6.1 Nucleon Decay
Unifying three of the fundamental forces in the universe, the strong, electromagnetic, and weak interactions, is a shared goal for the current world-wide program in particle physics. Grand unified theories, extending the standard model of particle physics to include a unified gauge symmetry at very high energies (more than ), predict a number of observable effects at low energies, such as nucleon decay [Pati:1973rp, Georgi:1974sy, Dimopoulos:1981dw, Langacker:1980js, deBoer:1994dg, Nath:2006ut]. Since the early 1980s, supersymmetric GUT models were preferred for a number of reasons, including gauge-coupling unification, natural embedding in superstring theories, and their ability to solve the fine-tuning problem of the SM. Supersymmetric GUT models generically predict that the dominant proton decay mode is , in contrast to non-supersymmetric GUT models, which typically predict the dominant decay mode to be . Although the LHC has not found evidence for supersymmetry (SUSY) at the electroweak scale as was expected if SUSY were to solve the gauge hierarchy problem in the SM, the appeal of a GUT still remains. In particular, gauge-coupling unification can still be achieved in non-supersymmetric GUT models by the introduction of one or more intermediate scales (see, for example, [Altarelli:2013aqa]). Several experiments have sought signatures of nucleon decay, with the best limits for most decay modes set by the Super–Kamiokande experiment [Abe:2014mwa, Miura:2016krn, TheSuper-Kamiokande:2017tit], which features the largest sensitive mass and exposure to date.
Although no evidence for proton decay has been found, lifetime limits from the current generation of experiments already constrain many GUT models, as shown in Figure (updated from [Babu:2013jba]). In some cases, these limits have eliminated models and approach the upper bounds of what other models will allow. This situation points naturally toward continuing the search with new, highly capable underground detectors, especially those with improved sensitivity to specific proton decay modes favored by GUT models. Given Super–Kamiokande’s long exposure time (more than ), extending the lifetime limits will require detectors with long exposure times coupled with larger sensitive mass or improved detection efficiency and background rejection.
The excellent imaging, as well as calorimetric and particle identification capabilities, of the LArTPC technology implemented for the DUNE FD will exploit a number of complementary signatures for a broad range of nucleon decay channels. Should nucleon decay rates lie just beyond current limits, observation of even one or two candidate events with negligible background could constitute compelling evidence.
In the DUNE era, possibly two other large detectors, Hyper–Kamiokande [Abe:2018uyc] and JUNO [Djurcic:2015vqa] will be conducting nucleon decay searches. Should a signal be observed in any single experiment, confirmation from experiments using different detector technologies, and therefore different backgrounds, would be very powerful.
As mentioned above, the GUT models present two benchmark decay modes, and . The decay arises from gauge boson mediation and is often predicted to have the higher branching fraction of the two key modes. In this mode, the total mass of the proton is converted into the electromagnetic shower energy of the positron and two photons from decay with a net momentum vector near zero. The second key mode is . This mode is dominant in most supersymmetric GUT models, many of which also favor other modes involving kaons in the final state [Dimopoulos:1981dw]. Although significant attention will focus on these benchmark modes, the nucleon decay program at DUNE will be a broad effort, covering many possible decay channels.
[Summary of nucleon decay experimental limits and model predictions]fig:theoryexplimitsummarySummary of nucleon decay experimental lifetime limits from past or currently running experiments for several modes and a set of model predictions for the lifetimes in the two benchmark modes. The limits shown are 90% CL lower limits on the partial lifetimes, , where is the total mean life and is the branching fraction. Updated from [Babu:2013jba].
![[Uncaptioned image]](2002.03005v2/TheoryExpLimitSummary.png)
6.1.1 Experimental Signatures for Nucleon Decay Searches in DUNE
The DUNE FD, with the largest active volume of LAr, will be highly sensitive to several possible nucleon decay modes, in many cases complementing the capabilities of large water detectors. In particular, LArTPC technology offers the opportunity to observe the entire decay chain for nucleon decays into charged kaons; in , the kaon is typically below Cherenkov threshold in a water Cherenkov detector, but can be identified by its distinctive signature as well as by its decay in a LArTPC. Therefore, this mode can be tagged in a LArTPC if a single kaon within a proper energy/momentum range can be reconstructed with its point of origin lying within the fiducial volume followed by a known decay mode of the kaon. Background events initiated by cosmic-ray muons can be controlled by requiring no activity close to the edges of the TPCs and by stringent single kaon identification within the energy range of interest [bib:docdb3384, bib:docdb1752]. Atmospheric neutrinos make up the dominant background.
Because of the already stringent limits set by Super–Kamiokande on and the unique ability to track and identify kaons in a LArTPC, the initial nucleon decay studies in DUNE have focused on nucleon decay modes featuring kaons. Studies of have begun (see Section 6.1.3) but are less advanced than the kaon studies. The remainder of this section describes the background assumptions, signal simulation, particle tracking and identification, and event classification with a focus on nucleon decay involving kaons.
Background Simulation
The main background for nucleon decay searches is in the interactions of atmospheric neutrinos. In this analysis, the Bartol model of atmospheric neutrino flux [Barr:2004br] is used. Neutrino interactions in argon are simulated with the GENIE event generator [Andreopoulos:2009rq]. To estimate the event rate, we integrate the product of the neutrino flux and interaction cross section. Table shows the event rate for different neutrino species for an exposure of , where oscillation effects are not included.
[Expected rate of atmospheric neutrino interactions]
cccc
tab:rate
Expected rate of atmospheric neutrino interactions in 40Ar for a exposure (not including oscillations).
CC NC Total
Total
Thus, to suppress atmospheric neutrino background to the level of one event per , which would yield events after ten years of operation with a fiducial volume, the necessary background rejection is , where background rejection is defined as the fraction of background that is not selected.
Nucleon Decay Simulation
The simulation of nucleon decay events is performed using GENIE v.2.12.10. A total of single-nucleon exclusive decay channels listed in the 2016 update of the pdg [Tanabashi:2018oca] is available in GENIE (see Table 6.1). The list includes two-, three-, and five-body decays. If a bound nucleon decays, the remaining nucleus can be in an excited state and will typically de-excite by emitting nuclear fission fragments, nucleons, and photons. At present, de-excitation photon emission is simulated only for oxygen [Andreopoulos:2015wxa]. However, the ArgoNeuT collaboration [Acciarri:2018myr] has reported measurements of argon de-excitation photons in LArTPC detectors, where energy depositions and positions of these depositions have been compared to those from simulations of neutrino-argon interactions using the FLUKA Monte Carlo generator.
![[Uncaptioned image]](2002.03005v2/graphics/costas_table1.png)
Kaon Final State Interactions
The propagation of the decay products in the nucleus is simulated using an intranuclear cascade MC. Charged kaons can undergo various scattering processes in the nucleus: elastic scattering, charge exchange, absorption (only ; absorption is forbidden), and production via strong processes such as . In this analysis, the model in GENIE is used as the default model for these FSI. is an empirical, data-driven method that does not model the cascade of hadronic interactions step by step, but instead uses one effective interaction where hadron+nucleus data is used to determine the final state. For kaons, data [Bugg:1968zz, Friedman:1997eq] is used when available. only considers kaon-nucleon elastic scattering inside the nucleus. Charge exchange is not included, nor is production in pion reactions, and therefore a is never added or removed from the final state in this model.
Other FSI models include the full cascade, but there is not enough data to favor one model over the other. As an example of the limitations of the current data on kaon FSI, a recent measurement of kaon production in neutrino interactions shows only a weak preference for including FSI as opposed to a model with no FSI [Marshall:2016rrn]. In this case, the kaon FSI have a relatively subtle effect on the differential cross section, and the available statistics are not sufficient to conclusively prefer one model over another. For nucleon decay into kaons, the FSI have a much larger impact, and the differences between models are less significant than the overall effect. Kaon FSI introduce an important uncertainty that is included in this analysis.
FSI can significantly modify the observable distributions in the detector. For example, Figure shows the kinetic energy of a kaon from before and after FSI. Because of FSI the kaon spectrum becomes softer on average. Of the kaons, % undergo elastic scattering resulting in events with very low kinetic energy; % of kaons have a kinetic energy of . When the kaon undergoes elastic scattering, a nucleon can be knocked out of the nucleus. Of decays via this channel, % have one neutron coming from FSI, % have at least one proton, and % have two protons coming from FSI. These secondary nucleons are detrimental to reconstructing and selecting .
[Kaon kinetic energy before and after final state interactions]fig:K-wFSI-hA2015Kinetic energy of kaons in simulated proton decay events, . The kinetic energy distribution is shown before and after final state interactions in the argon nucleus.
The kaon FSI in Super–Kamiokande’s simulation of in oxygen seem to have a smaller effect on the outgoing kaon momentum distribution [Abe:2014mwa] than is seen here with the GENIE simulation on argon. Some differences are expected due to the different nuclei, but differences in the FSI models are under investigation.
Tracking and Particle Identification
The DUNE reconstruction algorithms are described in Chapter 4. This analysis uses 3D track and vertex reconstruction provided by PMA.
Track reconstruction efficiency for a charged particle is defined as
| (6.1) |
The denominator includes events in which an particle was created and has deposited energy within any of the TPCs. The numerator includes events in which an particle was created and has deposited energy within any of the TPCs, and a reconstructed track can be associated to the particle based on the number of hits generated by that particle along the track. This efficiency can be calculated as a function of true kinetic energy and true track length.
[Tracking efficiency of kaons in ]fig:k-trk-effTracking efficiency for kaons in simulated proton decay events, , as a function of kaon kinetic energy (left) and true path length (right).
Figure shows the tracking efficiency for from proton decay via as a function of true kinetic energy and true path length. The overall tracking efficiency for kaons is %, meaning that % of all the simulated kaons are associated with a reconstructed track in the detector. From Figure , the tracking threshold is approximately of kinetic energy, which translates to in true path length. The biggest loss in tracking efficiency is due to kaons with of kinetic energy due to scattering inside the nucleus as described in Section 6.1.1. The efficiency levels off to approximately % above of kinetic energy. This inefficiency even at high kinetic energy is due mostly to kaons that decay in flight./footnoteNo attempt has been made at this point to recover such events. Both kaon scattering in the LAr and charge exchange are included in the simulation but are relatively small effects (% of kaons scatter in the LAr and % of kaons experience charge exchange). The tracking efficiency for muons from the decay of the in is %.
Charged particles lose energy through ionization and scintillation when traversing the LAr. This energy loss provides valuable information on particle energy and species. To identify a given particle, the hits associated with a reconstructed track are used. If the charged particle stops in the LArTPC active volume, a combination of and the reconstructed residual range (, the path length to the end point of the track) is used to define a parameter for PID. The parameter, , is defined as [Acciarri:2013met]
| (6.2) |
where the median is taken over all track points for which the residual range is less than .
[Particle identification using for ]fig:PIDAParticle identification using for muons and kaons in simulated proton decay events, , and protons in simulated atmospheric neutrino background events. The curves are normalized by area.
Figure shows the performance for kaons (from proton decay), muons (from kaon decay), and protons produced by atmospheric neutrino interactions. The tail with lower values in each distribution is due to cases where the decay/stopping point was missed by the track reconstruction. The tail with higher values is caused when a second particle overlaps at the decay/stopping point causing higher values of and resulting in higher values of . In addition, ionization fluctuations smear out these distributions.
A complication for PID via results when ambiguity occurs in reconstructing track direction, which is even more problematic because additional energy deposition may occur at the originating point in events where FSI is significant. The dominant background to in DUNE is atmospheric neutrino CC quasi-elastic (QE) scattering, . When the muon happens to have very close to the momentum expected from a decay at rest and does not capture, it is indistinguishable from the muon resulting from followed by . When the proton is also mis-reconstructed as a kaon, this background mimics the signal process.
The most important difference between signal and this background source is the direction of the hadron track. For an atmospheric neutrino, the proton and muon originate from the same neutrino interaction point, and the characteristic Bragg rise occurs at the end of the proton track farthest from the muon-proton vertex. For signal, the kaon-muon vertex location is where the stops and decays at rest, so its ionization energy deposit is highest near the kaon-muon vertex. To take advantage of this difference, a log-likelihood ratio discriminator is used to distinguish signal from background. Templates are formed by taking the reconstructed and calibrated energy deposit as a function of the number of wires from both the start and end of the candidate hadron track. Two log-likelihood ratios are computed separately for each track. The first begins at the hadron-muon shared vertex and moves along the hadron track (the “backward” direction). The second begins at the other end of the track, farthest from the hadron-muon shared vertex, moves along the hadron track the other way (the “forward” direction). For signal events, this effectively looks for the absence of a Bragg rise at the start, and the presence of one at the end, and vice versa for background. At each point, the probability density for signal and background, and , are determined from the templates. Forward and backward log-likelihood ratios are computed as
| (6.3) |
where the summation is over the wires of the track, in either the forward or backward direction. Using either the forward or backward log-likelihood ratio alone gives some discrimination between signal and background, but using the sum gives better discrimination. While the probability densities are computed based on the same samples, defining one end of the track instead of the other as the vertex provides more information. The discriminator is the sum of the forward and backward log-likelihood ratios:
| (6.4) |
Applying this discriminator to tracks with at least ten wires gives a signal efficiency of roughly with a background rejection of .
Event Classification
Multivariate classification methods based on machine learning techniques have become a fundamental part of most analyses in high-energy physics. To develop an event selection to search for nucleon decay, a BDT classifier is used. The software package Toolkit for Multivariate Data Analysis with ROOT (TMVA4) [Hocker:2007ht] was used with AdaBoost as the boosted algorithm. In the analyses presented here, the BDT is trained on a sample of MC events ( events for signal and background) that is statistically independent from the sample of MC events used in the analysis (approximately events for signal and events for background.) This technique is used for the nucleon decay and neutron-antineutron analyses presented below.
As an independent method of identifying nucleon decay events, image classification using a CNN can be performed using 2D images of DUNE MC events. The image classification provides a single score value as a metric of whether any given event is consistent with a proton decay, and this score can be used as a powerful discriminant for event identification. In the analyses presented here, the CNN technique alone does not discriminate between signal and background as well as a BDT. For that reason, the CNN score is used as one of the input variables in the BDT in each analysis.
6.1.2 Sensitivity to Decay
Monte Carlo studies of the signal and corresponding atmospheric neutrino backgrounds have been carried out with the DUNE multipurpose full event simulation and reconstruction software. As indicated in Section 6.1.1, they reveal that one of the main challenges in identifying proton decay candidates is suppressing backgrounds arising from the mis-reconstruction of protons as positive kaons. This happens when a CC neutrino interaction produces a muon and a recoiling proton, and the primary vertex for neutrino interaction is mislabeled as a secondary vertex where the kaon decays. Complicating the ability to reject pathological events of this type is the presence of FSI, which can shift the spectrum of kaons toward low energies, with possible concurrent emission of nucleons, which together weaken the otherwise distinct energy and signature of the kaon.
The branching fraction for leptonic decay of charged kaons, , is approximately %. The remaining decay modes are semileptonic or hadronic and include charged and neutral pions. The leptonic decay offers a distinguishable topology with a heavy ionizing particle followed by a minimum ionizing particle. In addition, given the kinematics of a proton decay event, % of kaons decay at rest. Using two-body kinematics, the momentum of the muon is approximately . The reconstructed momentum of the muon offers a powerful discriminating variable to separate signal from background events. This analysis includes all modes of kaon decay, but the selection strategy so far has focused on kaon decay to muons.
The proton decay signal and atmospheric neutrino background events are processed using the same reconstruction chain and subject to the same selection criteria. There are two pre-selection cuts to remove obvious background. One cut requires at least two tracks, which aims to select events with a kaon plus a kaon decay product (usually a muon). The other cut requires that the longest track be less than ; this removes backgrounds from high energy neutrino interactions. After these cuts, % of the signal and % of the background remain in the sample. The signal inefficiency at this stage of selection is due mainly to the kaon tracking efficiency.
A CNN was developed to classify signal and background events that gives % background rejection at % signal efficiency. Better discriminating power is achieved using a BDT with input variables, including the CNN score as one variable. The other variables in the BDT include numbers of reconstructed objects (tracks, showers, vertices), variables related to visible energy deposition, PID variables (, Equation 6.2, and , Equation 6.4), reconstructed track length, and reconstructed momentum.
Figure shows the distribution of the BDT output for signal and background.
[Boosted Decision Tree response for ]fig:BDT_response Boosted Decision Tree response for for signal (blue) and background (red).
Figure shows a signal event with high BDT response value (), meaning a well-classified event. The event display shows the reconstructed kaon track in green, the reconstructed muon track from the kaon decay in maroon, and the reconstructed shower from the Michel electron coming from the muon decay in red. Figure shows event displays for atmospheric neutrino interactions. The left figure (BDT response value of ) shows the interaction of an atmospheric electron neutrino, . This event is clearly distinguishable from the signal. However, the right figure (BDT response value ) shows a CC QE interaction of an atmospheric muon neutrino, , which is more likely to be mis-classified as a signal interaction. These types of interactions present a challenge if the proton track is misidentified as kaon. A tight cut on BDT response can remove most of these events, but this significantly reduces signal efficiency.
[ signal event display]fig:event_signal
Event display for a well-classified signal event. The vertical axis is time ticks (each time tick corresponds to ), and the horizontal axis is wire number. The bottom view is induction plane one, middle is induction plane two and top is the collection plane. The color represents the charge deposited in each hit.
![[Uncaptioned image]](2002.03005v2/graphics/event_signal.png)
[ background event displays]fig:event_bkgd
Event displays for backgrounds. The vertical axis is time ticks (each time tick corresponds to ), and the horizontal axis is wire number. The bottom view is induction plane one, middle is induction plane two and top is the collection plane. The color represents the charge deposited in each hit. The left shows an atmospheric neutrino interaction unlikely to be classified as signal. The right shows an atmospheric neutrino interaction which could make it into the selected sample without a tight cut.
![[Uncaptioned image]](2002.03005v2/graphics/event_bkgd_1.png)
![[Uncaptioned image]](2002.03005v2/graphics/event_bkgd_2.png)
Optimal lifetime sensitivity is achieved by combining the pre-selection cuts with a BDT cut that gives a signal efficiency of and a background rejection of , which corresponds to approximately one background event per .
The limiting factor in the sensitivity is the kaon tracking efficiency. With the current reconstruction, the overall kaon tracking efficiency is %. The reconstruction is not yet optimized, and the kaon tracking efficiency should increase with improvements in the reconstruction algorithms. To understand the potential improvement, a visual scan of simulated decays of kaons into muons was performed. For this sample of events, with kaon momentum in the range, scanners achieved greater than % efficiency at recognizing the decay chain. The inefficiency came mostly from short kaon tracks (momentum below ) and kaons that decay in flight. Note that the lowest momentum kaons () were not included in the study; the path length for kaons in this range would also be too short to track. Based on this study, the kaon tracking efficiency could be improved to a maximum value of approximately % with optimized reconstruction algorithms, where the remaining inefficiency comes from low-energy kaons and kaons that charge exchange, scatter, or decay in flight. Combining this tracking performance improvement with some improvement in the separation performance for short tracks, the overall signal selection efficiency improves from % to approximately %.
The analysis presented above is inclusive of all possible modes of kaon decay; however, the current version of the BDT preferentially selects kaon decay to muons, which has a branching fraction of roughly %. The second most prominent kaon decay is , which has a branching fraction of %. Preliminary studies that focus on reconstructing a pair with the appropriate kinematics indicate that the signal efficiency for kaons that decay via the mode is approximately the same as the signal efficiency for kaons that decay via the mode. This assumption is included in our sensitivity estimates below.
The dominant systematic uncertainty in the signal is expected to be due to the kaon FSI. To account for this uncertainty, kaon-nucleon elastic scattering () is re-weighted by in the simulation. The absolute uncertainty on the efficiency with this re-weighting is %, which is taken as the systematic uncertainty on the signal efficiency. The dominant uncertainty in the background is due to the absolute normalization of the atmospheric neutrino rate. The Bartol group has carried out a detailed study of the systematic uncertainties, where the absolute neutrino fluxes have uncertainties of approximately % [Barr:2006it]. The remaining uncertainties are due to the cross section models for neutrino interactions. The uncertainty on the CC 0 cross section in the energy range relevant for these backgrounds is roughly % [Mahn:2018mai]. Based on these two effects, a conservative % systematic uncertainty in the background is estimated.
With a % signal efficiency and an expected background of one event per , a % CL lower limit on the proton lifetime in the channel of can be set, assuming no signal is observed over ten years of running with a total of of fiducial mass. This calculation assumes constant signal efficiency and background rejection over time and for each of the FD modules. Additional running improves the sensitivity proportionately if the experiment remains background-free.
6.1.3 Sensitivity to Other Key Nucleon Decay Modes
Another potential mode for a baryon number violation search is the decay of the neutron into a charged lepton plus meson, i.e. . In this mode, , where is baryon number and is lepton number. The current best limit on this mode is from the FREJUS collaboration [Berger:1991fa]. The reconstruction software for this analysis is the same as for the analysis; the analysis again uses a BDT that includes image classification score as an input. To calculate the lifetime sensitivity for this decay mode the same systematic uncertainties and procedure is used. The selection efficiency for this channel including the expected tracking improvements is with a background rejection of , which corresponds to background events per . The lifetime sensitivity for a exposure is . The DUNE FD technology can improve the lifetime limit for this particular channel by more than two orders of magnitude from the current world’s best limit.
The sensitivity to the mode has also been calculated. For this analysis, reconstruction was not applied, and true quantities were used as inputs to a BDT to isolate events that contain a positron and two photons from the decay. Energy smearing simulated the effects of reconstruction. Applying the same selection to the atmospheric neutrino background and calculating the limit yields a sensitivity for an exposure of in the range of depending on the level of energy smearing (in the range 5-30%). This initial study indicates that with a longer exposure of DUNE could achieve a sensitivity comparable to Super–Kamiokande’s current limit of [Miura:2016krn].
6.1.4 Detector Requirements for Nucleon Decay Searches
As is the case for the entire FD non-accelerator based physics program of DUNE, nucleon decay searches require efficient triggering and event localization capabilities. The nucleon decay search program also relies on both the event imaging and particle identification (via ) capabilities of the LArTPC technology.
Event localization within the FD along the ionization drift direction is required in order to reject cosmic ray backgrounds via fiducial volume cuts. This can be achieved by requiring an event time () signal for nucleon decay candidates so that TPC anode signal times can be used to determine the drift time. Within DUNE, the is provided by the PD system, which must have high detection efficiency throughout the FD active volume for a scintillation photon signal corresponding to of deposited energy.
For nucleon decays into charged kaons, the possibility of using the time difference between the kaon scintillation signal and the scintillation signal from the muon from the kaon decay has been investigated. In the Super–Kamiokande analysis of , the corresponding timing difference (between the de-excitation photons from the oxygen nucleus and the muon from kaon decay) was found to be an effective way to reduce backgrounds [Abe:2014mwa]. Studies indicate that measuring time differences on the scale of the kaon lifetime () is difficult in DUNE, independent of photon detector acceptance and timing resolution, due to both the scintillation process in argon – consisting of fast (-scale) and slow (-scale) components – and Rayleigh scattering over long distances.
Given the energy release, the requirements for tracking and calorimetry performance are similar to those for the beam-based neutrino oscillation program described in Chapter 5. Especially important are the event imaging function and the measurement capability for particle identification. With a well-functioning LArTPC, nucleon decay search capabilities are ultimately limited by physics, namely complexities arising from final state interactions (such as nucleon emission) as well as ionization fluctuations for example, rather than by detector performance per se. This is the case provided that readout noise is small compared to the ionization signal expected for minimum-ionizing particles located anywhere within the active volume of the detector (see Sec. 1.2).
6.1.5 Nucleon Decay Summary
In summary, projecting from our current analysis of the sensitivity to proton decay via in DUNE with full simulation and reconstruction, we find that the sensitivity after a exposure is roughly twice the current limit from Super–Kamiokande based on an exposure of [Abe:2014mwa]. An analysis of the sensitivity to neutron decay via has also been completed; DUNE could improve the lifetime limits in this mode by more than two orders of magnitude from the current world’s best limit. Future studies of nucleon decay into kaons will focus on potential improvements in track reconstruction, improved methods of particle and event identification, and understanding kaon FSI models. Analysis of other modes of nucleon decay into kaons is underway, as well as the first investigations of the with full simulation and reconstruction.
6.2 Neutron-Antineutron Oscillations
Neutron-antineutron () oscillation is a baryon number violating process that has never been observed but is predicted by a number of BSM theories [Phillips:2014fgb]. Discovering baryon number violation via observation of this process would have implications about the source of matter-antimatter symmetry in our universe given Sakharov’s conditions for such asymmetry to arise [Sakharov:1967dj]. In particular, the neutron-antineutron oscillation () process violates baryon number by two units and, therefore, could also have further implications for the smallness of neutrino masses [Phillips:2014fgb]. Since the transition operator is a six-quark operator, of Maxwellian dimension , with a coefficient function of dimension (mass)-5, while the proton decay operator is a four-fermion operator, of dimension , with a coefficient function of dimension (mass)-2, one might naively assume that oscillations would always be suppressed relative to proton decay as a manifestation of baryon number violation. However, this is not necessarily the case; indeed, there are models [Nussinov:2001rb] in which proton decay is very strongly suppressed down to an unobservably small level, while oscillations occur at a level comparable to present limits. This shows the value of a search for transitions at DUNE. The process is one of many possible baryon number violating processes that can be investigated in DUNE. Searches for this process using both free neutrons and nucleus-bound neutron states have continued since the 1980s. The current best % CL limits on the (free) neutron oscillation lifetime are from free searches and from nucleus-bound searches [BaldoCeolin:1994jz, Abe:2011ky].
Neutron-antineutron oscillations can be detected via the subsequent antineutron annihilation with a neutron or a proton. Table shows the branching ratios for the antineutron annihilation modes applicable to intranuclear searches. This annihilation event will have a distinct signature of a vertex with several emitted light hadrons, with total energy of twice the nucleon mass and zero net momentum. Reconstructing these hadrons correctly and measuring their energies is key to identifying the signal event. The main background for these annihilation events is caused by atmospheric neutrinos. Most common among mis-classified events are NC deep inelastic scattering (DIS) events without a lepton in the final state. As with nucleon decay, nuclear effects and FSI make the picture more complicated.