Interpreting the Spitzer/IRAC Colours of 79 Galaxies: Distinguishing Between Line Emission and Starlight Using ALMA2019Interpreting the Spitzer/IRAC Colours of 79 Galaxies: Distinguishing Between Line Emission and Starlight Using ALMA–References
Abstract
Prior to the launch of JWST, Spitzer/IRAC photometry offers the only means of studying the rest-frame optical properties of 7 galaxies. Many such high redshift galaxies display a red [3.6][4.5] micron colour, often referred to as the “IRAC excess”, which has conventionally been interpreted as arising from intense [O III]+H emission within the [4.5] micron bandpass. An appealing aspect of this interpretation is similarly intense line emission seen in star-forming galaxies at lower redshift as well as the redshift-dependent behaviour of the IRAC colours beyond 7 modelled as the various nebular lines move through the two bandpasses. In this paper we demonstrate that, given the photometric uncertainties, established stellar populations with Balmer (4000 Å rest-frame) breaks, such as those inferred at 9 where line emission does not contaminate the IRAC bands, can equally well explain the redshift-dependent behaviour of the IRAC colours in 79 galaxies. We discuss possible ways of distinguishing between the two hypotheses using ALMA measures of [O III] 88 micron and dust continuum fluxes. Prior to further studies with JWST, we show that the distinction is important in determining the assembly history of galaxies in the first 500 Myr.
Keywords:
galaxies: evolution – galaxies: high-redshift – cosmology: reionization – cosmology: early Universe1 Introduction
The last few years has seen impressive progress in studies of galaxies in the so-called “reionisation era” corresponding to the redshift interval . However, the number of spectroscopically-confirmed examples remains limited and much has been deduced from spectral energy distributions (SEDs) of photometric samples. In addition to demographic studies based on star formation rate densities (Oesch et al. 2014; McLeod et al. 2016) and luminosity functions (Atek et al. 2015; Bouwens et al. 2015), a key area of interest is studies of the gaseous and stellar properties of early systems. The latter topic is central to understand both the ionising capability of early galaxies as well as the age of their stellar populations (for a recent review see Stark 2016).
Although much of the progress has been made using photometric samples based on Hubble imaging, both in deep fields (Grogin et al. 2011; Koekemoer et al. 2011; Ellis et al. 2013) and through lensing clusters (Bradley et al. 2014; Lotz et al. 2017; Salmon et al. 2018; Coe et al. 2019), the Spitzer Space Telescope has made a key contribution since, at 5, the two bandpasses at 3.6 and 4.5 m sample the rest-frame optical. At redshifts of 6.6-6.8, it is claimed that the redshift-dependent trend of the IRAC colours is consistent with intense nebular emission lines shifting through the bandpasses (Labbé et al. 2013; Smit et al. 2015; Roberts-Borsani et al. 2016), although the precision of this exercise is dependent mostly on samples with only photometric redshifts. With this in mind, the surprising spectroscopic confirmation with Lyman- (Oesch et al. 2015; Zitrin et al. 2015; Stark et al. 2017) of the 4 brightest galaxies in the CANDELS survey selected to display red Spitzer/IRAC 3.6 m 4.5 m colours (and hence an “IRAC excess”) of mag (Roberts-Borsani et al. 2016), reinforced the hypothesis that the IRAC excess arises from intense [O III] 4959,5007 Å plus H emission within the 4.5 m band. To explain the IRAC colours, the rest-frame equivalent widths (EWs) of [O III]+H must be of order 500 Å.
Although it will not be possible to confirm this suggestion with direct spectroscopy until the launch of JWST, the so-called “[O III] hypothesis" has been widely accepted for several reasons. Firstly, at lower redshift 6.6-6.8 where [O III] passes through the 3.6 m bandpass, the required blue 3.6 m4.5 m colour is seen for a sample of galaxies, several of which are now spectroscopically-confirmed with ALMA (Smit et al. 2018; see also Sobral et al. 2015,Pentericci et al. 2016,Matthee et al. 2017). Finally, as a proof of concept, galaxies whose rest-frame [O III] emission exceed EW1000 Å , while difficult to reproduce via modelling except in very young star-forming systems, have been studied at 2 (Maseda et al. 2014).
A more recent development has been the location of IRAC-excess galaxies whose photometric redshifts lie at 9; at these redshifts [O III] 5007 Å - the strongest contaminating emission line - is shifted beyond both IRAC filters. Although both H and [O III] 4959 Å remain in the filter until 9.3, their relatively low strengths make it difficult to reproduce strong IRAC-excesses. Thus far only one system, MACS1149-JD1, hereafter JD1, has been spectroscopically-confirmed at =9.11 (Hashimoto et al. 2018). Analysis of its SED attributes the IRAC excess to the Balmer break at 4000 Å consistent with a mature 200-300 Myr old stellar population providing a first tantalising glimpse of “cosmic dawn” at 153. This discovery raises the question of the extent to which the IRAC excess seen in galaxies at 79 might also, in part, be due to a similar Balmer break. The distinction is important since it would imply many luminous 7-9 galaxies may have older stellar populations and larger stellar masses than previously thought, with interesting consequences for the presence of earlier star formation. An additional issue is whether JD1 is representative of the galaxy population at (see Katz et al. 2019).
The goal of the present paper is to explore the extent to which an IRAC excess and its redshift-dependent trend might be due, in part, to starlight rather than solely intense [O III] line emission. A plan of the paper follows. In §2 we examine predicted IRAC colours in the context of both hypotheses, using carefully-chosen template galaxies as well as contemporary stellar population models that incorporate nebular line emission. In §3, we turn to what data might be needed to distinguish between the two hypotheses. Prior to spectroscopy with JWST, we consider the flux of [O III] 88 m which is accessible with ALMA and examine the IRAC colour for those spectroscopically-confirmed galaxies for which [O III] 88 m fluxes are available. In §4 we discuss our results and the implications on the early assembly of galaxies. Throughout this paper we refer to the HST F160W and Spitzer/IRAC 3.6 and 4.5 micron bands as H160, [3.6] and [4.5], respectively, for simplicity. We also assume H0=70 km/s/Mpc, 0.3, and 0.7. All magnitudes are in the AB system (Oke & Gunn 1983).
2 Modelling the IRAC Colours of 79 Galaxies
In exploring the redshift-dependent behaviour of the IRAC 3.6 and 4.5 m colours, under the hypotheses of contributions from [O III] line emission or a Balmer break due to a more mature stellar population, we begin by selecting two template SEDs fitted to actual data for spectroscopically-confirmed 7 galaxies. For the case of intense [O III] emission, we use a spectroscopic template fitted to the ground-based and HST/Spitzer photometry of EGSY8p7 at =8.68 (Zitrin et al. 2015), one of the four IRAC-excess bright sources first identified in the CANDELS survey (Roberts-Borsani et al. 2016). The template and HST/Spitzer photometry used here are taken directly from the latter study and we refer the reader to that paper for details on the construction of the templates and derivation of the photometric data points.
Similarly, for the case of a mature stellar population with a prominent Balmer break, we select the SED fit to MACS1149-JD1 at =9.11 from Hashimoto et al. 2018. This fit represents a composite of a mature 200-300 Myrs population augmented with a younger component invoked to match the intensity of [O III] emission at 88 m discovered with ALMA; full details can be found in Hashimoto et al. 2018. Since this spectral fit includes nebular line emission which, while not contributing significantly to the IRAC bands at 9 will do so at lower redshift, we also explore the effect of suppressing all optical emission lines from the fitted spectrum of JD1. The observed (rest-frame) EWs of the combined [O III] and H lines are EW([O III]+H)6690 Å (EW([O III]+H)770 Å) and EW([O III]+H)3408 Å (EW([O III]+H)375 Å) for EGSY8p7 and JD1, respectively. The adopted spectral templates and associated photometry are shown in Figure 1, and for all subsequent analysis, we normalise both spectra by their flux at 0.325 m (rest-frame), where the spectra are free from emission or absorption features, in order to ensure their 3.6 m and 4.5 m photometry can be directly compared.
We are now in a position to explore how these template spectra affect the IRAC colours over the redshift range 6.89. In Figure 2 we present the redshift evolution of the [3.6][4.5] and [3.6] colours in steps of for each of our fiducial spectra, following a similar approach by Labbé et al. 2013. At each redshift interval, the colours are measured directly from the redshifted spectrum using the relevant filter response curves. The simulation shows that the Balmer break in JD1 can mimic the effect of intense line emission to within 0.1 mag in the [3.6][4.5] colour, particularly at redshifts 7.5, and even produce redder colours at 8.5. Since the JD1 template includes a contribution from nebular emission lines (e.g., [O II], H and [O III]), including some from H and [O III] 4959 Å at =9.11 in the 4.5 m band, we explored suppressing all optical line emission in this template but find consistently red IRAC colours with virtually identical colour-colour evolution (particularly at 8) and little difference in normalisation: the masked spectrum consistently produces red IRAC [3.6][4.5] colours mag lower than its unmasked counterpart) on the simulated colours (see discussion below and Figure 2).
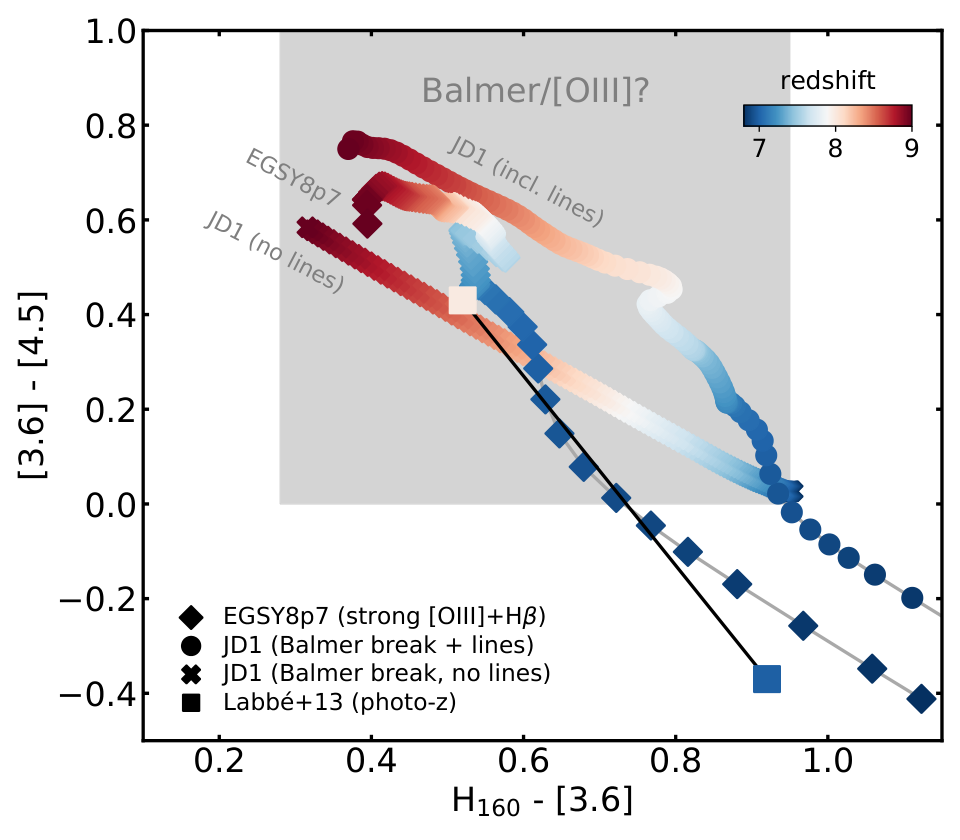
The similarity between the redshift-dependent trends of a Balmer break and intense line emission over the chosen redshift interval 79 may seem surprising given earlier conclusions of a similar exercise undertaken by Labbé et al. 2013. Those authors explored the effect by analysing average SEDs (containing nebular emission lines) of 7 and 8 galaxies selected as Lyman-break “dropouts” in the HUDF09+ERS and CANDELS-GOODS South fields. They were able to reproduce the average [3.6][4.5] and [3.6] colour differences only through the inclusion of high EW nebular emission lines (EW([O III]+H)560-670 Å), rejecting an increased dust content or stellar age as major contributors to the colour evolution. We show their average and colours together with our results in Figure 2.
However, while samples of 8 galaxies selected as -dropouts over the aforementioned fields have average photometric redshifts of 7.9 (Bouwens et al. 2011; Oesch et al. 2012; Bouwens et al. 2015), galaxies selected as dropouts have average redshifts of 6.8 (Bouwens et al. 2015). As shown by Smit et al. 2015 and Roberts-Borsani et al. 2016, the Spitzer/IRAC [3.6][4.5] colour changes dramatically from 76.8 due to the strong [O III]+H lines transiting between filters, resulting in a change from especially red to especially blue colours. Thus, the blue colours observed in the Labbé et al. 2013 stack are conceivably due to the presence of 6.8 galaxies which boost the 78 IRAC colour difference (as is clearly illustrated by our spectroscopic results where blue colours are apparent only at 7 and red colours at 7), thereby requiring more intense contributions to the colour evolution. The actual colour difference is in fact much smaller (0.3-0.4 mag as opposed to 0.8 mag, see Figure 2) and consistent with the trends observed for both strong nebular emission and Balmer break SEDs.
At this point we caution the reader that this exercise is not motivated to claim that the IRAC excess seen in many sources at cannot be due to intense [O III]+H emission. Rather, we wish to point out that the existence of a Balmer break for JD1 at may imply some contribution of starlight to the IRAC excess seen in sources at and to explore whether such starlight is prominent in existing spectroscopically-confirmed galaxies at . Of course, these results will depend on the choice of spectral template. In the case of JD1 we selected the only case known to date of a galaxy with an IRAC excess which cannot be explained solely via intense line emission (Hashimoto et al. 2018). For the line emitter template, the results will differ slightly depending on which object is chosen from the samples available in the literature. Given this uncertainty plus recent discussions on the possible exceptional case of JD1 (Bingelli et al. 2019), it is helpful to examine the redshift-dependent trends produced by stellar population synthesis models as well as to expand the discussion to compare all these predictions with actual data in the literature.
For the population synthesis models we use the Pégase3 suite (Fioc & Rocca-Volmerange 2019) which includes self-consistent modelling of nebular line emission and dust evolution. Clearly such models have an abundance of free parameters but, for the present exercise, our main goal is to demonstrate that relative contributions of synthetic galaxy spectra selected at various ages from a simple star formation history can also reproduce the trends we see using our observed spectral templates. For the current experiment, our simulated galaxy adopts a Chabrier 2003 IMF with a constant star formation history beginning at and ending at . We select simulated spectra at various time intervals corresponding to galaxy ages from 1 Myr (15) to 600 Myr (6). Nebular emission and dust evolution are included in the modelling and, for the former, we accommodate the possibility of a multiplicative factor L for the absolute strength of the lines in order to allow for extreme emission. As with the EGSY8p7 and JD1 spectra, the Pégase3 spectra are normalised to their flux at 0.325 m (rest-frame) prior to analysis.
Figure 3 shows the IRAC [3.6][4.5] colour versus redshift trend for our fiducial galaxy templates as well as the Pégase3 models. For each of our SEDs (i.e., EGSY8p7, JD1 and each of the Pégase3 spectra corresponding to various time intervals of the simulated galaxy’s evolution), the spectrum is redshifted across our range of interest and the colour measured through the relevant response filters, in order to assess the relative colour contributions from each spectrum’s features. To illustrate the effects of adopting normal (L=1) and extreme (L1) nebular emission for, respectively, this portion of the analysis and that adopted later, we also overplot the youngest galaxy spectrum with L=5, which is sufficient to match even those most extreme blue and red colours at 6.6-6.8 and 7-7.5, respectively. Additionally, the figure also shows the JD1 template adjusted to exclude the contribution from optical nebular lines. In order to compare with actual data, Table 1 represents a compilation of 13 7 spectroscopically-confirmed galaxies drawn from the literature, each with available HST and Spitzer/IRAC photometry, and we plot their photometric data alongside the spectroscopic results in Figure 3. For completeness we also add spectroscopically-confirmed sources at 6.8 sources with especially blue ([3.6][4.5]0.5 mag) colours Sobral et al. 2015; Laporte et al. 2017b; Smit et al. 2018; Matthee et al. 2019 which demonstrate the influence of [O III]+H emission in the 3.6 m band at lower redshift.
Focusing initially on the comparison between Pégase3 and our chosen galaxy templates, we can see very similar trends, albeit with some difference in normalisation. Within the redshift range, Pégase models corresponding to younger ages closely track the evolution of the EGSY8p7 template, whose red colours are dominated by strong nebular emission lines, whilst evolved stellar ages are required to explain the evolution of the JD1 templates (both with and without emission lines), where the red colour is primarily due to a Balmer break.
Considering next how the templates and synthesis models match the IRAC colours of 13 spectroscopically-confirmed galaxies, we can see that line emission in both Pégase3 and the EGSY8p7 (line emitting) template are required to explain the strong dip in [3.6][4.5] colour at 6.6-6.8 as indicated by Smit et al. 2018; as expected the JD1 template with masked emission lines has no dip. However, at higher redshift, where the [O III]+H lines enter the 4.5 m band, the red colour is initially more easily reproduced by cases with strong line emission. For SEDs with a flat continuum, as assumed by Roberts-Borsani et al. 2016, such a colour remains relatively constant until the lines leave the band at . However, in the case of a moderate to strong Balmer break and reduced (but not absent) line emission, the IRAC excess increases from 7.5 onwards as the Balmer break moves redward, thereby removing flux from the 3.6 m band whilst simultaneously providing a relatively constant amount of flux in the 4.5 m band. In the case where the rest-frame optical continuum is not flat, this impacts the slope of the [3.6][4.5] colour evolution. The impact of the Balmer break is particularly evident when comparing the evolution of the masked JD1 spectrum to the older-aged Pégase3 synthesis models which, despite including (normal) emission lines display virtually identical [3.6][4.5] evolution.
Examining the actual data, one can reasonably securely conclude that the large IRAC excesses at (e.g. Ono et al. 2012; Finkelstein et al. 2013; Roberts-Borsani et al. 2016; Hashimoto et al. 2019) are difficult to reproduce without an extreme [O III]+H contribution, as is clearly the case for IRAC colours for the sources at 6.8 studied by e.g., Sobral et al. 2015, Smit et al. 2018, Laporte et al. 2017b and Matthee et al. 2019. However, for the sources at (e.g., Watson et al. 2015; Hoag et al. 2017; Laporte et al. 2017a; Tamura et al. 2019 plus GN-z10-3 and EGSY8p7), the paucity of spectroscopic data makes it premature to conclude that the IRAC excess in galaxies beyond 7 arises entirely from line emission.

| ID | H160 | 3.6 m4.5 m | Reference | |
|---|---|---|---|---|
| MACS1149_JD1 | 9.11 | 25.700.01 | 0.910.10 | Hashimoto et al. 2018 |
| GN-z10-3 | 8.78 | 26.740.12 | 0.240.32 | Laporte et al. (in prep.) |
| EGS8p7 | 8.68 | 25.260.09 | 0.760.14 | Zitrin et al. 2015 |
| A2744_YD4 | 8.38 | 26.420.04 | 0.400.18 | Laporte et al. 2017a |
| MACS0416_Y1 | 8.31 | 26.040.05 | 0.38 | Tamura et al. 2019 |
| EGS-zs8-1 | 7.73 | 25.030.05 | 0.530.09 | Oesch et al. 2015 |
| MACS1423-z7p64 | 7.64 | 25.030.10 | 0.19 | Hoag et al. 2017 |
| z8_GND_5296 | 7.51 | 25.550.07 | 0.980.07 | Finkelstein et al. 2013 |
| A1689-zD1 | 7.50 | 24.700.10 | 0.300.30 | Watson et al. 2015 |
| EGS-zs8-2 | 7.48 | 25.120.05 | 0.960.17 | Roberts-Borsani et al. 2016; Stark et al. 2017 |
| GN-108036 | 7.21 | 25.170.07 | 0.580.18 | Ono et al. 2012 |
| COSY | 7.15 | 25.060.06 | 1.030.06 | Stark et al. 2017 |
| B14-65666 | 7.15 | 24.60 | Hashimoto et al. 2019 |
| ID | [O III] integrated flux | [O III] FWHM | continuum flux | ||||
|---|---|---|---|---|---|---|---|
| [m] | [Jy km/s] | [km/s] | [m] | Jy | |||
| MACS1149_JD1 | 9.11 | 10 | 893.86 | 0.2290.050 | 15439 | 917.63 | 35.4 |
| A2744_YD4 | 8.38 | 2 | 829.55 | 0.0300.008 | 49.84.2 | 842.70 | 99.023.0 |
| MACS0416_Y1 | 8.31 | 1.43 | 823.32 | 0.6600.160 | 14121 | 850.57 | 137.026.0 |
| B14-65666 | 7.15 | – | 720.78 | 1.5000.180 | 42937 | 733.68 | 470.0128.0 |
3 Distinguishing Between a Balmer break and Intense Line Emission
3.1 ALMA data and the origin of the [O III] line ratio
In Section 2 we have shown that red Spitzer/IRAC [3.6][4.5] colours for galaxies lying between could arise from contributions of both intense nebular line emission and starlight. We now consider whether it is possible to break this degeneracy prior to the use of spectroscopy with JWST. ALMA observations with Band 7 targeting the [O III] 88 m line and dust continuum may provide a potential way forward. [O III] 5007 Å and [O III] 88 m emission originate from the same star-forming regions and species, and thus constraints from the [O III] 88 m line should provide valuable limits to the strength of the [O III] 5007 Å emission and therefore Spitzer/IRAC [4.5] flux contributions. Furthermore, while the precise origin and nature of dust at high- remains an open debate, constraints from continuum emission can place additional (indirect) constraints on the rate of supernovae explosions and and thus the underlying stellar populations. Using detailed SED modelling with synthetic spectra from Pégase3, we now investigate whether ALMA observations can place constraints on the contribution from young stars via [O III] 88 m emission and mature stellar populations from the presence of a dust continuum.
Currently, four of the 13 7 spectroscopically-confirmed galaxies with Spitzer/IRAC excesses listed in Table 1 have the appropriate ALMA data: JD1, A2744_YD4, MACS0416_Y1 and B14-65666 (henceforth YD4, Y1 and B14 for convenience), see Table 2. To determine accurate SEDs, for each of the aforementioned galaxies we use the relevant references in Table 1 (and references therein) to compile HST ACS+WFC3/IR, (, , , , , and bands), VLT/HAWK-I Ks, as well as Spitzer/IRAC [3.6] and [4.5] photometry. For B14 we use near-infrared , , , and photometry from VISTA, in addition to data in the VLT/HAWK-I Ks and Spitzer/IRAC [3.6] and [4.5] bands. All HST upper limits and error bars represent 1 uncertainties, whilst those redward of these are 2.
To evaluate the relative contributions of nebular emission lines and starlight we create a repertoire of Pégase3 spectra with which to fit the above data for the four spectroscopically-confirmed 7 galaxies. We generate mass-normalised galaxy spectra for a young component dominated by a recent burst of constant star formation with duration =10 Myrs, and for a component with a less recent phase of constant star formation for a range of durations =[10, 50, 100, 200, 300, 400, 500] Myrs, where a Balmer break is allowed to form. We then extract spectra at 1 Myr intervals for the young component, and 20 Myr intervals from ages of 1 Myr to the age of the Universe at the redshift of each galaxy for the older component. For simplicity, we assume emission lines arise from the young component only, since these come from star-forming regions and are not seen in mature stellar populations. These models are used, sometimes in combination (i.e. recent burst + earlier star formation), with a custom SED-fitting code in a Bayesian framework, to maximise the log-likelihood of the model given the data, including an analytical treatment of upper limits (Sawicki 2012). The free parameters of the code are the mass of the galaxy system, M11 1 For a proper definition of how this translates in the Pégase3 formalism to stellar mass, see Fioc & Rocca-Volmerange 2019. (one for each stellar component) and a multiplicative factor, L, to scale the luminosity of the nebular emission lines, whose FWHM are fixed to that of the [O III] 88 m line presented in Table 2. The adopted priors are log M=[5,15] M⊙ and L=[0,50], allowing for both normal and extreme nebular emission contributions.
Throughout the subsequent analysis, we make the assumption that the [O III] 5007 Å line can be constrained from the flux of the [O III] 88 m line, since these originate from the same star-forming regions. However, the ratio of the two lines is highly dependent on the conditions of the surrounding gas (e.g., electron density and temperature, gas metallicity, the emission rate of ionising photons from the ionising star), given that the two species are characterised by different excitation energies and critical densities. We therefore provide a short description of Pégase3’s nebular emission treatment (for full details we refer the reader to Fioc & Rocca-Volmerange 2019) and consider the [O III] ratios probed by our young starburst component to ensure they are suitable for a meaningful analysis of the emission line contributions to the Spitzer/IRAC channels.
Pégase3 determines the integrated luminosities of a large suite of nebular emission lines by using a pre-computed luminosity grid from Cloudy (Ferland et al. 2017) and linking it to the stellar and ISM evolution of the galaxy model. The large emission grid was constructed as a function of ISM metallicity and emission rate of Lyman continuum photons (with ranges {0-0.1} and {1046-1053} s-1 respectively) for spherically symmetric, radiation bound H II regions filled with a constant gas density of =102 cm-3. Each of the Cloudy simulations were run out to a radial distance from the central ionising star where the free proton density drops below 10-2 cm-3. For each star cluster in a given Simple Stellar Population (SSP) with age , Pégase3 computes the ionising output and gas phase metallicity prior to determining the integrated line luminosity through interpolatation of the Cloudy grid. The emission lines from Pégase3 are thus computed in a self-consistent manner and directly linked to the underlying stellar and ISM evolution. As such, no prior assumptions on either the electron density or temperature need be supplied.
With the above in mind, we plot in Figure 4 the normalised line ratio as a function of time for the young starburst model, in addition to several relevant galaxy quantities. Our [O III] 88 m / [O III] 5007 Å values span a reasonably large range of {0.281.13}. Using rest-frame optical line ratios from our spectra as electron temperature () and density () diagnostics (Proxauf et al. 2014), we find our nebular emission also probe relatively low values of 8,500-11,000 and 102 cm-3, respectively. Given such values remain well below the critical densities of the two [O III] lines (510 cm-3 and 6.8105 cm-3 for the 88 m and 5007 Å line, respectively; Osterbrock & Ferland 2006), collisional de-excitation is unlikely to play a major role in regulating the luminosities of the lines. Instead, the large difference between the excitation potentials of the two lines (0.014 eV and 2.476 eV for the 88 m and 5007 Å line, respectively) suggests temperature fluctuations primarily due to the gas-phase metallicity acts as the primary regulator of the ratio, as is clearly illustrated in the figure. At very low metallicities, the increase in Lyman continuum photon production rate coincides with a rise in temperature and thus the number of collisions with energetic electrons and population of the [O III] 5007 Å upper energy level. Given the low excitation potential of the [O III] 88 m line however, its luminosity remains largely unaffected and thus does not vary significantly, maintaining a low line ratio. Once the production of metals becomes significant, however, cooling effects begin to take place and the luminosity of the [O III] 5007 Å line drops dramatically, thereby rapidly increasing the line ratio towards unity.
Prior to the launch of JWST, observations of the [O III] 5007 Å line at 6 are not possible, while the number of low- analogues with matched observations of both lines is limited. Since metallicity plays a key role in regulating the evolution of the line ratio, however, we compare the Oxygen abundances for each of our young starburst spectra (and therefore line ratios) to those of the local, low-metallicity dwarf galaxies in the Dwarf Galaxy Survey (DGS; Madden et al. 2013). To be consistent with the metallicity derivations of the DGS, we use the “R23” ([O II] 3727,3729 [O III] 4959,5007)/H parameterisations by Pilyugin & Thuan 2005 with a log([N II] 6584/[O II] 3727,3729)1.2 limit in order to break the R23 degeneracy (Kewley & Ellison 2008). Our derived values range from 12log (O/H)8.408.67 (0.50-0.93 ), characteristic of sub-solar abundances and consistent with the high end of the DGS metallicities.
Finally, we find our range of line ratios more than capable of producing extreme rest-frame optical emission, with 7 Spitzer/IRAC colours up to [3.6][4.5]1.4 mag. This is consistent with all of the red colours of 7 spectroscopically-confirmed galaxies in Figure 3 and much larger than those reported for the four galaxies selected above. Should our ratios have probed larger values only, characteristic of other areas in a simple grid, subsequent analyses would likely be biased against strong nebular emission. Thus, given the consistency of our line ratios with expected trends and data for low-metallicity systems, as well as the large Spitzer/IRAC excess allowed by our models, we deem the nebular emission generated here well-suited for the purposes of the present paper.
To illustrate how the ALMA observations may differentiate between intense nebular emission and starlight in explaining the IRAC colours, we consider the case of YD4 since, for this source, all photometric points redward of the Lyman break and the ALMA spectroscopic constraints are robustly measured. First we fit the data with a single-component young model (permitting a dust contribution), once with HST+VLT/HAWK-I+Spitzer/IRAC data only and then again incorporating the ALMA Band 7 constraints. The best-fit SEDs are shown in Figure 5. The continuum fits to the HST and HAWK-I photometry are satisfactory and comparable in each case. However, there is a major difference in the predicted Spitzer/IRAC photometry. Ignoring the ALMA constraints, the IRAC excess demands the presence of strong nebular emission lines in which case the [O III] 88 m line is considerably overpredicted (by a factor 10, not shown) and the continuum dust emission is similarly poorly matched. Additionally, the presence of nebular emission lines - namely the [O II] doublet at a rest-frame of 3730 Å - adds non-negligible boosting to the [3.6] band. Including the ALMA constraints, the nebular emission in the IRAC bands is modest, indicating the need for an additional component to fit these data, for example a Balmer break originating from star formation at earlier times.
3.2 SED-fitting & Results
We thus now proceed to fit all of the available data for each of the four galaxies with a two-component model comprising a contribution from young stars with intense nebular emission and an older stellar component. The two-component models are derived from all unique combinations of young and older spectra requiring only that age so that the recent burst of star formation from the young component occurs only when star formation in the older component has completed. In these two-component models, for simplicity, we assume the dust contributions arise only from the older component and specifically only if there is a Band 7 continuum detection. By comparing these two-component fits to those for a single-component (with dust included following the guidelines indicated above), we can determine, as suggested in the case of YD4, (i) whether the two-component fits are significantly better than the single young component ones and (ii) whether the first indicate the presence of an older, more mature stellar population.
The results of our best fit two-component models are presented in Figure 6, where we find generally good agreement with the observed photometric data sets and ALMA constraints. For two of the four galaxies (JD1 and YD4), the best-fit model correctly predicts the presence or upper limit of dust mass based on the ALMA continuum detections, whilst simultaneously reproducing the HST photometry, Spitzer/IRAC excess, and [O III] 88 m flux, within the error bars. For Y1 and B14, on the other hand, the HST photometry and Spitzer/IRAC excess are well reproduced, but the models are unable to simultaneously match both the [O III] 88 m flux and dust continuum (in the case of B14, the [O III] 88 m flux is matched but the dust continuum is underpredicted, and in the case of Y1 the [O III] 88 m flux is underpredicted and dust continuum overpredicted). In comparing these fits to those assuming a single-component only, although the HST photometry can be reasonably well-reproduced for JD1 and YD4, the single-component fits fail to simultaneously reproduce both the ALMA constraints and the Spitzer/IRAC excess. In the cases of Y1 and B14, the ALMA constraints are better matched by the one-component fit, however the Spitzer/IRAC excess is only partially matched.
In our two-component fits, a sizeable contribution to the IRAC flux arises from a more mature stellar component. For JD1, YD4 and Y1, the contribution to the IRAC fluxes from the recent burst of star formation is only 10-30% and the older component (characterised by Balmer ratios of 2) dominates the flux at 70%. This is due primarily to the relative weakness of the [O III]+H lines, for which we measure an equivalent width, EW([O III]+H)25-106 Å (compared to EW([O III]+H)450-7700 Å for a single-component). The exception to this trend is B14, whose IRAC fluxes remain dominated by the younger component by 60-75% (EW([O III]+H)200 Å for the two-component model and EW([O III]+H)3460 Å for the one-component model). The total stellar mass (corrected for lensing for those lensed sources) for all of these fits range from log M∗=8.88-10.19 M⊙, with virtually all of the total stellar mass also coming from the earlier period of star formation and the most recent burst contributing primarily through the presence of weak-to-moderate nebular emission.
Furthermore, we also note a difference in the ages of the galaxies, as determined by the onset of the earlier burst in the two-component model or the age of the single-component model. We find an increase in age for each of the four galaxies when multiple components are used, with ages of 80, 260, 140 and 20 Myrs characterising the two-component fits of JD1, YD4, Y1, and B14, and such ages decreasing down to 1, 2, 1 and 3 Myrs assuming on a single burst of recent star formation. In the case of Y1, the age estimate from the two-component fit is in fact a lower limit, since we only have an upper limit for the Spitzer/IRAC 3.6 m photometry. We note here that our preferred =10 Myrs value and the galaxy age estimate for JD1 are somewhat lower than those estimated by Hashimoto et al. 2018, whose best fit comprises an older stellar population with an episode of star formation lasting =100 Myrs and a galaxy age of 290 Myrs. However, as in their analysis, we find considerable statistical similarity with the best two-component fit assuming =100 Myrs, in which case our age estimate increases to 140 Myrs, closer to the lower limit of their assumed value.
Finally, to enable a quantitative comparison of the one- and two-component fits we examine the log-likelihoods and find, with the exception of Y1, that the two-component fits of each of the galaxies is considered a better fit. However, given the obvious danger of concluding better fits with an additional component with further free parameters, we compare the goodness-of-fit via a comparison of their Bayesian Information Criteria (BIC), which uses the log-likelihoods whilst penalising for additional free parameters. With this consideration, the additional free parameters in the fit to the B14 data are sufficiently penalised to justify only the one-component fit. Whilst such comparisons no doubt gloss over the complexities of defining the birth of such galaxies, they serve as an important illustration of the potential consequences from overlooking the consideration of multiple episodes of star formation. We provide a summary of the above comparison and the main properties of our fits in Table 3.
| JD1 | YD4 | Y1 | B14 | |||||
| 1-comp | 2-comp | 1-comp | 2-comp | 1-comp | 2-comp | 1-comp | 2-comp | |
| [Myrs] | – | 10 | – | 200 | – | 100 | – | 10 |
| galaxy age [Myrs] | 1 | 80 | 2 | 260 | 1 | 140 | 3 | 20 |
| M/M | – | 210-3 | – | 3.210-3 | – | 1.910-3 | – | 810-2 |
| log M [M⊙] | 8.230.01 | 9.880.01 | 8.710.02 | 10.260.06 | 8.930.01 | 10.350.03 | 9.250.04 | 9.490.99 |
| EW([O III]+H) [Å] | 7668793 | 10643 | 448133 | 259 | 73071211 | 5111 | 3462720 | 198260 |
| Dn4000 | 0.550.01 | 1.940.02 | 0.770.00 | 2.090.07 | 0.810.01 | 1.990.02 | 0.820.01 | 0.970.35 |
| 3.6 m flux contribution | (9.8, 90.2) % | (25.4, 74.6) % | (23.9, 76.1) % | (62.4, 37.6) % | ||||
| 4.5 m flux contribution | (8.2, 91.8) % | (18.4, 81.6) % | (30.8, 69.2) % | (75.5, 24.5) % | ||||
| log-likelihood | -188.81 | -12.22 | -9.44 | -3.02 | -62.47 | -66.92 | -6.17 | -4.86 |
| BIC | 403.21 | 62.84 | 44.02 | 43.76 | 150.33 | 171.94 | 38.10 | 48.37 |
3.3 Possible AGN contributions
Throughout the SED analyses described above, we assumed only thermal contributions to the heating of the metal-rich gas. However, given recent observations suggesting possible AGN contributions at high redshift (e.g., Tilvi et al. 2016; Laporte et al. 2017b; Mainali et al. 2018), it is natural to consider how our results might change should there be non-thermal radiation components in our four galaxies.
3.3.1 Influence on the [O III] ratio
To quantify differences in the FIR/optical [O III] ratio arising from excitation by stellar or AGN contributions, we run Cloudy using v2.1 of the Binary Population and Spectral Synthesis (BPASS; Eldridge et al. 2017) models as well as the code’s own AGN option (based on the model of Mathews & Ferland 1987). For both stellar and AGN cases the [O III] line ratio is computed over a range of electron densities ne=[3,10,100,1000] (cm-3) and gas-phase metallicities Z=[0.05,0.2,0.4,1] (Z⊙) for a fixed ionisation parameter log =2.5. We show the results of these simulations in Figure 7, which demonstrates the AGN case makes little difference at fixed electron density and gas-phase metallicity (a result, we note, is unaffected by a change in the ionisation parameter). The similarity between the stellar and AGN results is particularly evident for electron densities 1000 cm-3, where relatively large ratios ([O III] 88 m / [O III] 5007 Å0.1-1) are seen that increase with metallicity. Such a trend is consistent with the results in Section 3.1 and Figure 4 and arises because of relatively low electron temperatures (15,000-20,000 ) where, for low density regimes, the line ratio is influenced primarily by temperature fluctuations rather than by collisional de-excitation. As the electron density increases to 1000 cm-3, however, order-of-magnitude differences appear: while both the stellar and AGN cases probe line ratios 0.1 favouring particularly strong [O III] 5007 Å emission, collisional de-excitation of the [O III] 88 m line can occur and, combined with the higher temperatures (20,000 ) possible in the AGN case, this increases excitation of [O III] 5007 Å whereas [O III] 88 m is quenched. As a result the ratio is driven down to low values of 0.01. For our sample of four sources, the measured electron densities and temperatures (see Section 3.1) probe regions of the parameter space where AGN do not have a significant effect and thus our [O III] line ratios are unlikely to be strong affected by non-thermal radiation.
3.3.2 Observational evidence for AGN at ?
Although we have found that the [O III] line ratio is only affected by a AGN contribution in regions of very high temperature and electron densities unlikely to be representative of the general population, it is nonetheless informative to consider whether our sample of four galaxies and those in the extended list of IRAC-excess sources in Table 1 show any observational evidence for AGN activity, and if so at what level. At 7, the most useful diagnostics for distinguishing between thermal and non-thermal contributions are rest-frame UV emission lines and their ratios, in particular N V 1240,1243 Å, C IV 1549 Å, He II 1640 Å and C III] 1907,1909 Å (Feltre et al. 2016; Laporte et al. 2017b; Stark et al. 2017; Mainali et al. 2018). With an ionising energy of nearly 80 eV, the detection of N V alone is a strong indicator of non-thermal radiation (Feltre et al. 2016). Each of our four Spitzer/IRAC- and ALMA-selected objects have been targeted with NIR spectroscopy where the aforementioned emission lines reside at 7. 7.5-10 hrs of VLT/X-Shooter observations revealed only Ly in JD1 (Hashimoto et al. 2018) and YD4 (Laporte et al. 2017a) and no rest-frame UV lines were seen in Y1 (Tamura et al. 2019). Furthermore, 4 hrs of Subaru/FOCAS observations revealed only Ly in B14 (Furusawa et al. 2016). Of the remaining sources compiled in Table 1, all but GN-z10-3, MACS1423-z7p64 and GN-108036 have relevant NIR observations, albeit at varying depths. Only four of these reveal one or more detections of the relevant lines: EGSY8p7 (N V 1243 Å; Mainali et al. 2018), EGS-zs8-1 (both components of the C III] 1907,1909 Å doublet; Stark et al. 2017), z8_GND_5296 (C III] 1907 Å; Hutchison et al. 2019) and COSY (N V 1240 Å and He II 1640 Å; Laporte et al. 2017b). Given their large ionisation potentials, the detection of any of these lines is indicative of extreme radiation fields (Feltre et al. 2016; Stark et al. 2017). However, to place quantitative constraints on the powering mechanism, accurate measures of both C III] 1909 Å and He II 1640 Å lines are necessary. As shown in Figure 7 of Laporte et al. 2017b, while the ratio N V 1240 Å/He II 1640 Å constrains the strength of the radiation field, only the C III] 1909 Å/He II 1640 Å ratio can robustly distinguish a metal-poor stellar radiation field from one involving an AGN. With the available spectroscopic data, even upper flux limits on these lines do not usefully constrain the nature of the radiation field. Thus, while it is not yet possible to rule out a modest non-thermal contribution, specifically for the four ALMA sources under consideration here, given the absence of any detected high ionisation emission lines, it seems reasonable to conclude any AGN contribution cannot be dominant.
4 Discussion
We have shown that a Balmer break, arising from a mature stellar population, may be a significant contributor to the IRAC excess seen in spectroscopically-confirmed star-forming galaxies. While our analysis does not rule out the possibility that much of this excess arises, as has been conventionally assumed, from intense [O III] emission, using ALMA [O III] 88 m emission and dust mass measures, we have examined whether we can constrain the relative contributions of starlight and line emission.
The distinction between intense line emission, attributed to recent episodes of star formation from a young (10 Myr) stellar population, and a prominent Balmer break consistent with more mature stars, is important in considerations of the early assembly history of galaxies. Both the stellar masses and earlier star formation histories will differ depending on the relative contributions and this, in turn, will affect the inferred star formation activity beyond the current HST redshift horizon of 10. This was first demonstrated for the galaxy JD1 by Hashimoto et al. 2018 where the IRAC excess must arise primarily from starlight, leading to a stellar mass of 4.21.0109 M⊙ (lens-corrected for the preferred gravitational magnification) only 550 Myr after the Big Bang with an implied epoch of first star formation as early as 15.
As an illustration, if we adopt the significant contribution to the IRAC excess from starlight for those sources in Table 2 for which we fit two-components, their stellar masses increase by an average factor of 30 compared to contributions from young starlight alone. Although a single-component fit is probably an extreme comparison in this context, nonetheless our two-component fits with an earlier period of star formation must imply an assembly history beyond 10, as discussed by Hashimoto et al. 2018, with interesting consequences for the interpretation of 21cm experiments (Bowman et al. 2018) and the timing of “cosmic dawn”. In Figure 8, we plot the fractional stellar mass assembly history, averaged over our 4 galaxies, up to the epoch of observation in which it can be seen that 44% of the stellar mass was produced before a redshift 10. Although clearly a modest sample restricted largely to the brightest studied sources at , we can compare this fractional mass assembly history with the prediction of two star formation histories for galaxies with SFRs 0.7 M⊙yr-1 discussed by Oesch et al. 2014 similarly normalised at the mean redshift of our galaxies. Whilst the uncertainties are large due to small number statistics, if our galaxies are representative this would indicate a more gradual decline in the star formation history beyond 8 than Oesch et al. 2014 prefer (see McLeod et al. 2016). Whilst clearly a simplistic comparison, it serves to emphasise the importance of determining the true origin of the IRAC excess in galaxies. Ultimately NIRSpec on JWST will be well-placed to resolve the ambiguities explored in this paper via direct spectroscopy of a large sample of galaxies securing not only the strength of rest-frame optical lines such as [O III] 5007 Å but also absorption line measures such as H which is a further indicator of stellar ages.
Acknowledgements
We thank Rychard Bouwens, Ivo Labbé and Dan Stark for useful discussions regarding the interpretation of Spitzer/IRAC colours. We would also like to thank Michel Fioc and Brigitte Rocca-Volmerange for their help in generating Pégase3 models, as well as Isabella Lamperti for illuminating discussions on the development of the SED-fitting code. GRB also adds many thanks to Yuichi Harikane and Michael Topping for helping to generate the Cloudy models used in this paper and Roger Wesson for valuable conversations regarding the [O III] line ratio. The authors acknowledge funding from the European Research Council (ERC) under the European Union Horizon 2020 research and innovation programme (grant agreement No 669253). NL acknowledges support from the Kavli foundation.
Data availability
The data presented in this paper is available upon email request to the first author.
References
- Atek et al. (2015) Atek, H., Richard, J., Kneib, J.-P., et al. 2015, ApJ, 800, 18
- Bingelli et al. (2019) Bingelli, C., Zackrisson, E., Xiangcheng, M. et al. 2019, MNRAS, 489, 3
- Bouwens et al. (2011) Bouwens, R. J., Illingworth, G. D., Oesch, P. A., et al. 2011, ApJ, 737, 90
- Bouwens et al. (2015) Bouwens, R. J., Illingworth, G. D., Oesch, P. A., et al. 2015, ApJ, 803, 34
- Bowman et al. (2018) Bowman, J. D., Rogers, A. E. E., Monsalve, R. A., et al. 2018, Nature, 555, 67
- Bradley et al. (2014) Bradley, L. D., Zitrin, A., Coe, D., et al. 2014, ApJ, 792, 76
- Chabrier (2003) Chabrier, G. 2003, PASP, 115, 763
- Coe et al. (2019) Coe, D., Salmon, B., Bradač, M., et al. 2019, ApJ, 884, 85
- Eldridge et al. (2017) Eldridge, J. J., Stanway, E. R., Xiao, L., et al. 2017, Publ. Astron. Soc. Australia, 34, e058
- Ellis et al. (2013) Ellis, R. S., McLure, R. J., Dunlop, J. S., et al. 2013, ApJ, 763, L7
- Feltre et al. (2016) Feltre, A., Charlot, S., & Gutkin, J. 2016, MNRAS, 456, 3354
- Ferland et al. (2017) Ferland, G. J., Chatzikos, M., Guzmán, F., et al. 2017, Rev. Mex. Astron. Astrofis., 53, 385
- Finkelstein et al. (2013) Finkelstein, S., Papovich, C., Dickinson, M. et al. 2013, Nature, 502, 524
- Fioc & Rocca-Volmerange (2019) Fioc, M., & Rocca-Volmerange, B. 2019, A&A, 623, A143
- Furusawa et al. (2016) Furusawa, H., Kashikawa, N., Kobayashi, M. A. R., et al. 2016, ApJ, 822, 46
- Grogin et al. (2011) Grogin, N. A., Kocevski, D. D., Faber, S. M., et al. 2011, ApJS, 197, 35
- Hashimoto et al. (2018) Hashimoto, T., Laporte, N., Mawatari, K., et al. 2018, Nature, 557, 392
- Hashimoto et al. (2019) Hashimoto, T., Inoue, A., Mewatari, K et. al. 2019, PASJ, in press
- Hoag et al. (2017) Hoag, A., Bradač, M., Trenti, M., et al. 2017, Nature Astronomy, 1, 0091
- Hutchison et al. (2019) Hutchison, T. A., Papovich, C., Finkelstein, S. L., et al. 2019, ApJ, 879, 70
- Katz et al. (2019) Katz, H., Laporte, N., Ellis, R. et al. 2019, MNRAS, 484, 4054
- Kewley & Ellison (2008) Kewley, L. J., & Ellison, S. L. 2008, ApJ, 681, 1183
- Koekemoer et al. (2011) Koekemoer, A. M., Faber, S. M., Ferguson, H. C., et al. 2011, ApJS, 197, 36
- Labbé et al. (2013) Labbé, I., Oesch, P. A., Bouwens, R. J., et al. 2013, ApJ, 777, L19
- Laporte et al. (2017a) Laporte, N., Ellis, R. S., Boone, F., et al. 2017, ApJ, 837, L21
- Laporte et al. (2017b) Laporte, N., Nakajima, K., Ellis, R. S., et al. 2017, ApJ, 851, 40
- Lotz et al. (2017) Lotz, J. M., Koekemoer, A., Coe, D., et al. 2017, ApJ, 837, 97
- Madden et al. (2013) Madden, S. C., Rémy-Ruyer, A., Galametz, M., et al. 2013, PASP, 125, 600
- Mainali et al. (2018) Mainali, R., Zitrin, A., Stark, D. P., et al. 2018, MNRAS, 479, 1180
- Maseda et al. (2014) Maseda, M. V., van der Wel, A., Rix, H.-W., et al. 2014, ApJ, 791, 17
- Mathews & Ferland (1987) Mathews, W. G., & Ferland, G. J. 1987, ApJ, 323, 456
- Matthee et al. (2017) Matthee, J., Sobral, D., Boone, F., et al. 2017, ApJ, 851, 145
- Matthee et al. (2019) Matthee, J., Sobral, D., Boogaard, L. A., et al. 2019, ApJ, 881, 124
- McLeod et al. (2016) McLeod, D. J., McLure, R. J., & Dunlop, J. S. 2016, MNRAS, 459, 3812
- Oesch et al. (2012) Oesch, P. A., Bouwens, R. J., Illingworth, G. D., et al. 2012, ApJ, 759, 135
- Oesch et al. (2014) Oesch, P. A., Bouwens, R. J., Illingworth, G. D., et al. 2014, ApJ, 786, 108
- Oesch et al. (2015) Oesch, P. A., van Dokkum, P. G., Illingworth, G. D., et al. 2015, ApJ, 804, L30
- Oke & Gunn (1983) Oke, J. B., & Gunn, J. E. 1983, ApJ, 266, 713
- Ono et al. (2012) Ono, Y., Ouchi, M., Mobasher, B., et al. 2012, ApJ, 744, 83
- Osterbrock & Ferland (2006) Osterbrock, D. E., & Ferland, G. J. 2006, Astrophysics of gaseous nebulae and active galactic nuclei
- Pentericci et al. (2016) Pentericci, L., Carniani, S., Castellano, M., et al. 2016, ApJ, 829, L11
- Pilyugin & Thuan (2005) Pilyugin, L. S., & Thuan, T. X. 2005, ApJ, 631, 231
- Proxauf et al. (2014) Proxauf, B., Öttl, S., & Kimeswenger, S. 2014, A&A, 561, A10
- Roberts-Borsani et al. (2016) Roberts-Borsani, G. W., Bouwens, R. J., Oesch, P. A., et al. 2016, ApJ, 823, 143
- Salmon et al. (2018) Salmon, B., Coe, D., Bradley, L., et al. 2018, ApJ, 864, L22
- Sawicki (2012) Sawicki, M. 2012, PASP, 124, 1208
- Smit et al. (2015) Smit, R., Bouwens, R. J., Franx, M., et al. 2015, ApJ, 801, 122
- Smit et al. (2018) Smit, R., Bouwens, R. J., Carniani, S., et al. 2018, Nature, 553, 178
- Sobral et al. (2015) Sobral, D., Matthee, J., Darvish, B., et al. 2015, ApJ, 808, 139
- Stark (2016) Stark, D. P. 2016, ARA&A, 54, 761
- Stark et al. (2017) Stark, D. P., Ellis, R. S., Charlot, S., et al. 2017, MNRAS, 464, 469
- Tamura et al. (2019) Tamura, Y., Mawatari, K., Hashimoto, T. et al. 2019, ApJ, 874, 27
- Tilvi et al. (2016) Tilvi, V., Pirzkal, N., Malhotra, S., et al. 2016, ApJ, 827, L14
- Watson et al. (2015) Watson, D., Christensen, L., Knudsen, K. K. et al. 2015, Nature, 519, 327
- Zheng et al. (2017) Zheng, W., Zitrin, A., Infante, L., et al. 2017, ApJ, 836, 210
- Zitrin et al. (2015) Zitrin, A., Labbé, I., Belli, S., et al. 2015, ApJ, 810, L12