Luminous Ly Emitters with Very Blue UV-Continuum Slopes at Redshift Facilities: HST(WFC3)SExtractor, DrizzlePac, CIGALE
Abstract
We study six luminous Ly emitters (LAEs) with very blue rest-frame UV continua at . These LAEs have previous HST and Spitzer IRAC observations. Combining our newly acquired HST images, we find that their UV-continuum slopes are in a range of . Unlike previous, tentative detections of in photometrically selected, low-luminosity ( mag) galaxies, our LAEs are spectroscopically confirmed and luminous ( mag). We model their broadband spectral energy distributions (SEDs), and find that two galaxies can be well fitted with young and dust-free stellar populations. However, it becomes increasingly difficult to fit bluer galaxies. We explore further interpretations by including non-zero LyC escape fraction , very low metallicities, and/or AGN contributions. Assuming , we achieve the bluest slopes when nebular emission is considered. This can nearly explain the SEDs of two galaxies with and –2.9 (). Larger values and very low metallicities are not favored by the strong nebular line emission (evidenced by the IRAC flux) or the observed (IRAC 1 – IRAC 2) color. Finally, we find that the galaxy can potentially be well explained by the combination of a very young population with a high () and an old, dusty population. We are not able to produce two galaxies. Future deep spectroscopic observations are needed to fully understand these galaxies.
Keywords:
High-redshift galaxies — Lyman-alpha galaxies — Galaxy propertiesI Introduction
In recent years, a number of high-redshift galaxies have been discovered, thanks to the advances of instrumentation on the Hubble Space Telescope (HST) and large ground-based telescopes. These galaxies have played an important role in studies of galaxy formation and evolution at early epochs. Most known galaxies at are photometrically selected Lyman-break galaxies (LBGs) or candidates using the dropout technique (McLure et al. 2011; Yan et al. 2012; Ellis et al. 2013; Bouwens et al. 2015; Ono et al. 2018, e.g.,). Only a small fraction of them have been spectroscopically confirmed (Finkelstein et al. 2013; Oesch et al. 2015; Jiang et al. 2017; Laporte et al. 2017; Stark et al. 2017, e.g.,). The narrowband (or Ly) technique provides a complementary method to find high-redshift galaxies, and narrowband observations were mostly done by large-area ground-based observations (Kashikawa et al. 2011; Ota et al. 2017; Zheng et al. 2017; Ouchi et al. 2018; Hu et al. 2019, e.g.,). While ground-based observations provide samples of luminous galaxies, the majority of faint galaxies have to come from deep HST observations.
The physical properties of high-redshift galaxies are also being investigated. The combination of the HST and Spitzer (IRAC 1 and IRAC 2) observations covers the rest-frame UV and optical ranges for these galaxies, and is thus critical to characterize these objects and measure their stellar populations. The UV continuum slope () is of particular interest. It provides key information to constrain young stellar populations, yet it does not require Spitzer observations. Previous HST observations have tentatively found extremely steep slopes in photometrically selected, very faint galaxies at (Bouwens et al. 2010; Labbé et al. 2010, e.g.,). Such slopes have not been reported in lower-redshift galaxies, nor have they been predicted by cosmological simulations (Finlator et al. 2011; Ceverino et al. 2019, e.g.,). On the other hand, this finding is controversial, as others have demonstrated the likelihood that the extreme slopes could be caused by contamination and bias due to the nature of photometrically selected samples (McLure et al. 2011; Dunlop et al. 2012; Dunlop et al. 2013, e.g.,). As the debate goes on, the key is to construct a reliable sample of galaxies with .
We have carried out a detailed study of a sample of 67 spectroscopically confirmed galaxies at (Jiang et al. 2013a; Jiang et al. 2013b; Jiang et al. 2016), based on our Subaru optical, HST near-IR, and Spitzer mid-IR images. These galaxies have blue UV continua with a median slope at mag. In particular, a non-negligible fraction of them exhibit extreme slopes (see Figure 3 in Jiang et al. 2013a). Due to their brightness and secure redshifts, the measurements were not subject to the contamination or bias mentioned above. The uncertainties are around , mainly due to the short UV-continuum baseline or large photometric errors. In order to reduce , we have obtained new HST WFC3 data from HST Cycle 25 for seven relatively bright and promising candidates of extremely blue galaxies selected from the above sample.
In this paper, we present the new HST observations and confirm very steep slopes in six of the seven galaxies. The layout of the paper is as follows. In Section II, we introduce our HST observations and data reduction. In Section III, we present our main results of the measurements. In Section IV, we model the spectral energy distributions (SEDs) these galaxies and discuss our results. We summarize our paper in Section V. Throughout the paper, all magnitudes are expressed on the AB system. The HST F105W, F110W, F125W, F140W, and F160W bands are denoted as , , , , and , respectively. We use a -dominated flat cosmology with km s-1 Mpc-1, , and .
II Observations and data reduction
| ID | Redshift | Slope | IRAC 1 | IRAC 2 | |||||
|---|---|---|---|---|---|---|---|---|---|
| () | (mag) | (mag) | (mag) | (mag) | (mag) | (mag) | (mag) | ||
| ID07 | 5.691 | –3.380.35 | 26.240.14 | 26.660.14 | 26.740.12 | 27.100.17 | |||
| ID28 | 6.042 | –2.570.20 | 25.650.06 | 26.120.08 | 26.300.11 | 26.400.10 | 25.590.39 | ||
| ID30 | 6.062 | –2.600.25 | 25.720.07 | 25.680.09 | 25.940.11 | 26.040.13 | 25.500.35 | ||
| ID43 | 6.542 | –3.390.41 | 25.940.13 | 26.290.07 | 26.550.11 | 25.300.24 | |||
| ID61 | 6.599 | –1.410.30 | 26.020.09 | 26.010.12 | 25.900.07 | 24.080.07 | 24.500.18 | ||
| ID63 | 6.027 | –2.890.16 | 24.730.06 | 25.320.15 | 25.190.05 | 25.420.08 | 24.490.12 | 24.970.25 | |
| ID64 | 6.120 | –2.770.15 | 25.100.06 | 25.430.13 | 25.360.06 | 25.690.07 | 24.900.11 |
Note. — The ID numbers in Column 1 correspond to the numbers in Table 1 in Jiang et al. 2013a. For ID28, the photometry in Column 5 is for , and the photometry in Column 6 is for . The -band photometry in Column 8 is from Galametz et al. 2013. The IRAC photometry in Columns 9 and 10 is from Jiang et al. 2016.
We first briefly review our previous HST observations of 67 galaxies at (Jiang et al. 2013a). These galaxies were spectroscopically confirmed via Ly emission lines. They represent the most luminous galaxies in terms of Ly emission or UV-continuum emission. Most of them are located in the Subaru Deep Field (Kashikawa et al. 2004, SDF;), and the remaining are located in the Subaru XMM-Newton Deep Survey (Furusawa et al. 2008, SXDS;) field. They have deep optical images from the Subaru telescope. They also have deep near-IR and mid-IR images from our previous HST and Spitzer programs. The HST observations of the SDF galaxies were done with a mix of strategies. Most galaxies were observed in the WFC3 and bands, with a depth of two orbits per band. For the galaxies in the SXDS field, we have used the CANDELS (Grogin et al. 2011; Koekemoer et al. 2011) - and -band images. Based on these data, we previously found that our galaxies have blue UV slopes with a median value of . In addition, a small fraction of them show extreme slopes of , but the errors were relatively large ().
In order to study these extreme galaxies, we have carried out new HST WFC3 observations of seven LAEs (Table 1) in HST Cycle 25 program 15137 (PI: L. Jiang). These were selected from the above sample to be relatively bright ( detection in ) with . We took advantage of the existing data and improved the measurements by extending the UV continuum baseline, increasing the spectral sampling, and/or improving the photometry in . We observed all objects except ID28 in , which provides a longer UV continuum baseline. The depth was one HST orbit per object. Because of the very blue slopes, the galaxies were expected to be brighter in , but much fainter in . Therefore, we obtained new -band images for four objects (ID07, ID28, ID30, and ID61), and the depth was also one orbit per object. ID28 already had images in and , so we obtained one-orbit -band images to improve the spectral sampling.
We used the software package DrizzlePac and followed the standard procedure to reduce our HST images. For each galaxy, all images were drizzled onto the same WCS system. The new -band images of the two SXDS galaxies were drizzled to match the WCS in the CANDELS images. The ‘pixfrac’ parameter in DrizzlePac was set to be 0.8 and the output plate scale is pixel-1. We combined the old and new images in the individual bands. The final depth is roughly one orbit in , two orbits in , and three orbits in , corresponding to the detection limits (within a or 10-pixel circular aperture in diameter) of , 26.7, and 26.6 mag, respectively.
In addition to the HST images, we have used deep -band imaging data from Subaru Suprime-Cam to extend the UV-continuum baseline when calculating . These data have been used to select our galaxies, and the details were described in Jiang et al. 2013a. We have slightly improved the -band photometry of the galaxies. Furthermore, we have also used deep ground-based -band data to further extend the UV baseline for two SXDS galaxies (see Section III).
III Results
In this section, we will measure the photometry of the galaxies in multiple bands, and then calculate their UV-continuum slopes using the multi-band photometric data. We will show that our slopes are not estimated from a single UV color as many previous studies did for high-redshift galaxies. Instead, they are measured from 3–4 bands (Figures 1 and 2).
III.1 Photometry
We run SExtractor (Bertin & Arnouts 1996) to measure the photometry. The procedure is similar to those in the literature. Usually HST images in a longer wavelength band have a larger size (or FWHM) of the point-spread function (PSF). But this is not the case in our images. We performed sub-pixel dithering during the HST observations, which can improve the PSF. As mentioned earlier, the typical numbers of the HST orbits for our galaxies are 1, 2, and 3 in , , and , respectively. This results in nearly consistent PSF sizes (within the errors) in the different bands (Windhorst et al. 2011, see e.g.,). For example, the PSF FWHM values in the three bands, measured from bright stars by SExtractor, are , , and , respectively. Therefore, we skip PSF matching here. To do photometry for a given object, we first stack (inverse-variance weighted average) all its HST images to make a combined image. We then run SExtractor in the dual image mode, using the combined image as the ‘detection’ image. We calculate the total magnitude within a MAG_AUTO elliptical aperture with PHOT_AUTOPARAMS values of 1.8 and 2.5. The aperture corrections are computed using standard (larger) PHOT_AUTOPARAMS values of 2.5 and 3.5. The results are shown in Table 1.
The photometric uncertainties are also measured by SExtractor. We have converted the weight or variance maps (obtained from DrizzlePac) to rms images following the procedure of Dickinson et al. 2004 that includes correlated noise. The rms images are then fed to SExtractor. The average background noise is estimated using a -wide annulus (larger than the default value by 67%), and the total errors are calculated within the adopted aperture. We evaluate our error measurements using mock data. For a given galaxy in a given image, we generate 100 objects with the same brightness and shape as the galaxy, and put them randomly on the image. We then do photometry using SExtractor as we did for real objects, and compute the mean and standard deviation of the measurements. The new results are consistent with the results above.
The aperture size that we have adopted is roughly in diameter, larger than those in the majority of the previous studies of galaxies. This results in relatively larger measurement errors. On the other hand, this conservative approach reduces the effect from any possible PSF mismatches between different bands. Our galaxies are isolated in the HST images, and thus no obvious neighbors are included in the photometry. The two galaxies ID63 and ID64 are bright enough to test if the magnitudes that we have measured are close to ‘real’ total magnitudes. We measure their photometry again within a very large aperture of , and the results are well consistent with the values given in Table 1.
The -band photometry is done within a circular aperture in diameter using SExtractor. Aperture corrections are derived from bright stars. All galaxies except ID61 are compact in the HST images, so they are point-like sources in the ground-based -band images. Therefore, the usage of a circular aperture and the aperture corrections from stars are robust. The results are shown in Column 6 of Table 1. ID61 is likely an interacting system (Jiang et al. 2013a, see also), and its UV slope is not blue (Table 1).

III.2 UV continuum slopes
We measure UV-continuum slopes by fitting a power-law () to the photometric data above. The procedure is the same as what we did in Jiang et al. 2013a. Because AB magnitude and follow the linear relation , we actually perform a linear fit on and with the errors included, i.e., we do a standard (weighted) least-square linear regression by minimizing the error statistic. The errors propagate to the final parameters. The results are listed in Table 1. They are also illustrated in Figure 2. All galaxies except ID61 have steep slopes with .

The Ly emission line enters the band for galaxies, and enters the and bands for galaxies (see Figure 1). Hence, the Ly emission increases the relevant broadband flux. The Ly line flux of our galaxies was provided in Jiang et al. 2013a. Note that we do not use the band for galaxies. On the other hand, the flux blueward of Ly is nearly completely absorbed by the IGM at such high redshifts, which decreases the relevant broadband flux. These effects have been taken into account in this paper. The data points shown in Figure 2 have also been corrected for the IGM absorption and Ly emission. The details are as follows. To correct for the IGM absorption, we use the model in McGreer et al. 2013. Figure 1 shows two LAE model spectra with the IGM absorption at and 6.5. Since the Ly emission line of a (or 6.5) galaxy is at the edge of the (or ) filter, the uncertainty of the correction for the IGM absorption is negligible.
We use our spectroscopic redshifts and reliable Ly flux measurements to remove the Ly contribution in the - or -band photometry before we calculate UV continuum slopes or perform SED modeling. The system transmission, including the filter and detector, is considered. The typical rest-frame equivalent width of Ly in our sample is about 50 Å. The Ly contribution to the -band photometry is roughly 20% (10% in ), because the two filters are both very wide. Therefore, a 20% uncertainty on the Ly line flux measurement causes a 4% uncertainty in the -band photometry, or a 2% uncertainty in . We have added an additional error of 0.05 mag in quadrature to the relevant bands to include extra uncertainties introduced in this step.
The two SXDS galaxies ID63 and ID64 are the brightest in our sample, and can be well detected in the band from the ground. We have adopted the VLT HAWKI-I -band photometry from Galametz et al. 2013. The total magnitudes are and mag, respectively. We also find that the -band data points of the two objects largely deviate from the linear fits. The two galaxies are bright, compact, and isolated in the HST images, so their photometric measurements are robust. We check the four individual exposures (in four dither positions) for each galaxy, and find that the flux varies by 0.5 mag. Due to this unusually large variation, the actual errors (0.13-0.15 mag shown in Table 1) are much larger than the measurement errors (0.05 mag).
ID61 is the only galaxy that obviously has an elongated shape. It seems to be an interacting system, and its minor component is brighter at longer wavelengths. Our current HST images do not have enough resolution to reliably separate the two components. The magnitudes quoted in Table 1 are the total magnitudes, and the slope () is not steep. We will not discuss this galaxy later.
Among the six blue galaxies, two galaxies ID28 and ID30 have . Their slopes become flatter compared to our previous measurements ( and –3.5 with ) in Jiang et al. 2013a. This is mainly due to the significant improvement of the photometry in . The new photometry shows that the two objects become much ‘brighter’ in , resulting in the flatter slopes. If we do not use their -band data, the slopes become . Two galaxies ID63 and ID64 respectively have and –2.8 with , which are consistent with our previous measurements and –3.0, but with reduced errors. The main reason for the consistent results is that the two objects are bright, and the previous measurements were reliable. If we do not use their -band data, the slopes become . And if we further exclude the -band data (these data are poor as mentioned above), the slopes become . All these measurements are consistent within .
The other two galaxies ID07 and ID43 have very steep slopes . But the errors are also larger, because they are relatively faint. For ID43, if we exclude its -band data, the slope becomes . It would be important to improve their photometry or obtain their spectra in future observations.
Figure 3 compares our results with previous measurements of in photometrically selected LBGs from HST. Our six galaxies are luminous (by selection) with between –22 and –20 mag. In this luminosity range, typical star-forming galaxies have slopes around or even redder (Jiang et al. 2013a; Matthee et al. 2019). Our previous results show that LAEs have an average slope of (black square in Figure 3) in the range of mag. In addition, a small fraction of LAEs have , but with larger errors. Such extreme slopes were only reported in very faint ( mag or mag), photometrically selected LBGs from HST (Bouwens et al. 2010; Labbé et al. 2010, e.g.,). In this work, we have confirmed the existence of such extreme slopes in luminous and spectroscopically confirmed LAEs. We will discuss their nature in the next section.

IV Discussion
Generally speaking, higher-redshift galaxies are bluer. For example, Figure 3 shows that galaxies have on average, while low-redshift galaxies typically have . For LBGs at , some studies also found that the same redshift-dependence is still valid, and lower-luminosity galaxies tend to be bluer (Bouwens et al. 2012, e.g.,). These results are controversial (Dunlop et al. 2013, e.g.,). In addition, the existence of a population of LBGs at are also in debate, as we introduced in Section 1. A slope of usually means a very young stellar population with low metallicity and no dust content. But UV colors cannot be arbitrarily blue for a given initial mass function (IMF). Theoretically, it is difficult to explain using standard stellar population models when nebular emission is included (Raiter et al. 2010, e.g.,). For example, the bluest slopes are roughly from the BEAGLE code (Chevallard & Charlot 2016; Williams et al. 2018). The implications of extreme slopes have been discussed in the literature (Bouwens et al. 2010; Wilkins et al. 2011, e.g.,).
IV.1 SED modeling
In order to understand the nature of our galaxies with , we model their SEDs and explore the possible ranges of a few stellar population parameters. We include the IRAC data from Jiang et al. 2016. All galaxies except ID07 were detected in at least one IRAC band. We fit the broadband SEDs using the GALEV evolutionary synthesis models (Kotulla et al. 2009). We adopt a Kroupa (similar to Chabrier) IMF with a mass range of 0.1–100 , and assume a constant star formation rate (SFR). Metallicity is fixed to be 0.2 , a typical value in high-redshift galaxies (Finkelstein et al. 2012). We use the Calzetti reddening law (Calzetti et al. 2000) and include metallicity-dependent gaseous or nebular emission. The inclusion of nebular emission is important, because our wavelength range covers very strong emission lines (e.g., H, H, or [O iii]) that affect the broadband SEDs. Note that our spectroscopic redshifts remove one critical free parameter ‘redshift’ and ensure that strong emission lines are covered by proper filters. We mainly constrain three quantities: dust reddening E(B–V), SED age, and stellar mass. The best fits of four example galaxies are illustrated in Figure 4.
Our results show that the dust reddening is consistent with zero and the typical age is 4 Myr (the minimum allowed age) for all five galaxies with and IRAC detections. Two galaxies ID28 and ID30 with are well fitted. However, it becomes more difficult to fit the bluer galaxies with this model. This is demonstrated in Figure 4, where the best-fitted UV colors are significantly redder than the observed values. The best-fitted slopes are calculated using the same method as we did for the observed data, i.e., we first compute broadband photometry using the best-fitted spectra, and then estimate from the broadband photometry (blue crosses in the figure). From the model spectra, we note that the continuum slopes at 2 m (rest-frame 3000 Å for ) are slightly flatter than those at shorter wavelengths. In addition, only ID63 and ID64 (both at ) have -band data. For consistency, we do not use the band when we calculate slopes from the model spectra. Therefore, the rest-frame wavelength range used here is very similar to the originally defined range of 1250–2600 Å (Calzetti et al. 1994). The observed slopes of ID63 and ID64 nearly remain the same without the -band data points.
Previous studies have shown that standard models cannot produce . We adopt a top-heavy IMF by increasing to 120 . But this barely changes our results, because very massive stars are efficient ionizing sources that produce large amounts of nebular emission, which results in redder colors. The presence of strong nebular line emission is strongly suggested by our IRAC detections (Figure 4).

IV.2 Further exploration
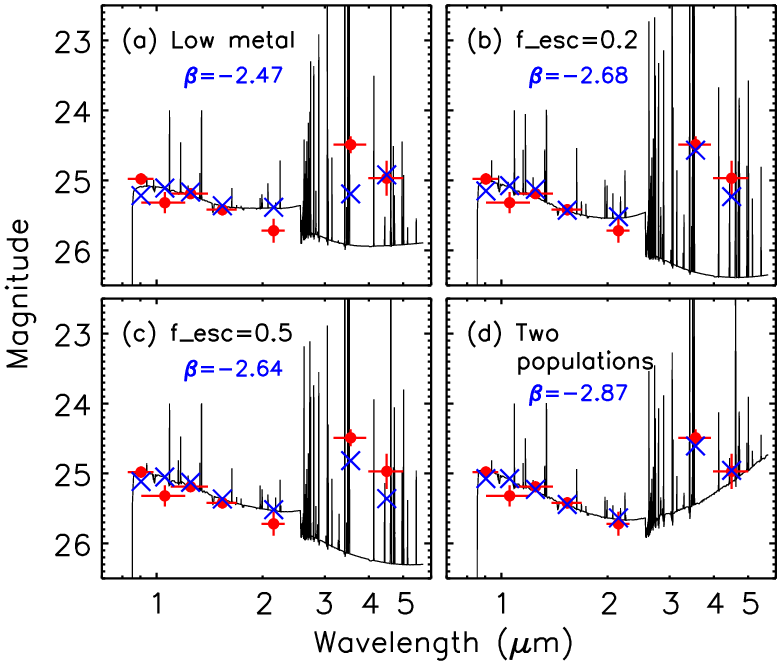
We use the CIGALE code (Noll et al. 2009; Serra et al. 2011; Boquien et al. 2019) to explore further possibilities, including lower metallicities, non-zero escape fractions () of Lyman continuum flux, and AGN contributions (). We modify the code to remove Ly emission lines since Ly emission is not a free parameter for our galaxies. We adopt a Chabrier IMF with a mass range of 0.1–100 and assume a constant SFR. We allow age to vary between 1 and 50 Myr, in steps of 1 Myr. We focus on ID63 that has more observed data points than the others. The results are shown in Figure 5. The best-fitted dust extinction is all (nearly) zero, and ages are 1–4 Myr. In panel (a), we try two low metallicities 0.02 and 0.005 , and find that the IRAC bands are poorly fitted. ID63 is much brighter in IRAC 1 than it is in IRAC 2. Many such galaxies have been found, and it is believed that the IRAC 1 flux is boosted by strong [O iii] line emission at this redshift. At a very low metallicity, however, the O/H ratio is reduced, which cannot produce the (IRAC 1 – IRAC 2) color seen in ID63.
Bouwens et al. 2010 have used the Schaerer 2003 models to explain . These models involve some extreme populations such as Population III and those with extremely low metallicities () and IMFs with . When a metallicity is as low as , can be as blue as –3.0 over a small age range of Myr. Bouwens et al. 2010 argue that this may explain some of the galaxies with . However, it does not likely apply to ID63, since such a low metallicity cannot explain its (IRAC 1 – IRAC 2) color. It is worth pointing out that we have used the same metallicity for the continuum and nebular emission in our models. The gas-phase nebular abundances could be much higher than the stellar metallicity (Steidel et al. 2016, e.g.,). We have not tried to use difference abundances for the two components.
In the above models, we have assumed the Lyman continuum escape fraction , which is consistent with previous observations that the majority of the low-redshift galaxies observed so far have %. A much higher (%) is required to reionize the Universe at . Meanwhile, a higher can apparently make a steeper slope, not only because a higher fraction of very blue stellar light directly leaks from the galaxy, but also because less UV radiation produces less nebular emission. We use with a metallicity of 0.2 (Smith et al. 2018, e.g.,), and we show the result in panel (b) of Figure 5. We obtain a better fit with , which can nearly explain the observed . We further increase to 0.5, and obtain a worse fit, shown in panel (c). This is because there are not sufficient ionizing photons that produce strong nebular line emission to match the IRAC flux. In the simplest case, a line intensity is proportional to , where is the ion (atom) responsible for the line emission and is the electron density. As we mentioned earlier, the IRAC 1 and IRAC 2 flux is mainly boosted by [O iii] and H. An increased or a decreased amount of ionizing photons means smaller and for H or smaller for [O iii]. Therefore, we cannot arbitrarily increase .
We have not considered AGN contributions so far. Our galaxies are spectroscopically confirmed and do not show type 1 AGN features, such as broad line emission. However, the existing X-ray data are not deep enough to fully rule out AGN activities in such faint objects. We add a small AGN contribution , with an assumption of . The AGN model has a central power source with a surrounding dust torus. The spectrum of the central source is a broken-power law, with slope , –1, and –1.5 at 10 Å Å, 300 Å Å, and 1250 Å m, respectively (Fritz et al. 2006). We take the nominal values for the torus parameters (Boquien et al. 2019). This is a coarse estimate, since we do not have observational constraints on the AGN contribution. The result is comparable to the case without the AGN contribution.
Finally, we try the combination of a young and an old stellar populations. This is motivated by the fact that a young population with a high can produce a very steep slope, but with weak IRAC flux (e.g., in case of ID63). The IRAC flux can potentially be boosted by an old population. Recent studies have shown that two populations may exist at , including an evolved population and a recent starburst likely induced by galaxy merging (Hashimoto et al. 2018, e.g.,). Given the limited number of the data points, we are not able to fully explore the parameter space. Instead, we make a simple case that includes a 1-Myr old, dust-free population with , and a 650-Myr old population with and E(B–V)=0.5. In this case, the young population dominates the wavelength range blueward of the Balmer break, and the contribution of the old population is negligible in this range. Both populations contribute to the IRAC flux redward of the Balmer break. We obtain a reasonable result with for ID63, shown in Figure 5 (d). Although this is not a real multi-population SED modeling, it provides a hint that the combination of different populations may be a solution to produce extreme slopes. A more comprehensive study is needed to physically explore this possibility.
For ID43 with , we are not able to find a reasonable fit to explain its extreme slope. Based on the above models with single populations, the bluest slopes that we can achieve is when nebular emission is included. In the two-population model, we can obtain . Steeper slopes cannot be well explained by these models. On the other hand, the measurement errors are still large. Deeper observations are needed to reduce the errors.
V Summary
We have carried out a study of six very blue LAEs at . These galaxies are luminous and spectroscopically confirmed, selected from a large galaxy sample that has previous HST near-IR and Spitzer IRAC observations. In HST Cycle 25, we obtained new WFC3 images. The combination of the new data and existing data have allowed us to reliably measure the UV-continuum slopes using 3–4 photometric data points. The slopes are in the range of , with a typical error of 0.2–0.4. In particular, four galaxies have . Such blue, luminous, spectroscopically confirmed galaxies have not been reported previously. We performed SED modeling using the multi-band data. The two galaxies can be well fitted using standard stellar populations with very young (a few Myr) ages and zero dust content. It is more difficult to fit bluer galaxies using single stellar populations. The bluest slopes that the models predict are . We note that our IRAC detections have put strong constraints on and metallicity, such that a larger cannot produce strong nebular line emission as evidenced by the IRAC flux, and an extremely low metallicity cannot produce the observed (IRAC 1 – IRAC 2) color for ID63. The inclusion of a small AGN contribution does not change our conclusion. Finally, we found that the combination of a young and an old populations can potentially explain the observed SEDs of the galaxies. In this case, the young population has zero dust content and a high , which produces a very blue slope and dominates the measurement. The old, dusty population with a strong Balmer break contributes little to . Both young and old populations contribute to the IRAC flux. This model is not able to produce UV slopes as blue as in the remaining two galaxies.
In order to fully understand these galaxies, further spectroscopic observations are required. In particular, they are expected to have strong nebular emission lines in the mid-IR. Given the brightness of these galaxies, JWST will be able to directly detect their continuum and line emission in the near future.
References
- Bertin & Arnouts (1996) Bertin, E., & Arnouts, S. 1996, A&AS, 117, 393
- Boquien et al. (2019) Boquien, M., Burgarella, D., Roehlly, Y., et al. 2019, A&A, 622, 103
- Bouwens et al. (2010) Bouwens, R. J., Illingworth, G. D., Oesch, P. A., et al. 2010, ApJ, 708, L69
- Bouwens et al. (2012) Bouwens, R. J.,Illingworth, G. D., Oesch, P. A., et al. 2012, ApJ, 754, 83
- Bouwens et al. (2015) Bouwens, R. J.,Illingworth, G. D., Oesch, P. A., et al. 2015, ApJ, 803, 34
- Calzetti et al. (1994) Calzetti, D., Kinney, A. L., Storchi-Bergmann, T. 1994, ApJ, 429, 582
- Calzetti et al. (2000) Calzetti, D., Armus, L., Bohlin, R. C., et al. 2000, ApJ, 533, 682
- Ceverino et al. (2019) Ceverino, D., Klessen, R. S., & Glover, S. C. O. 2019, MNRAS, 484, 1366
- Chevallard & Charlot (2016) Chevallard J. & Charlot, S. 2016, MNRAS, 462, 1415
- Dickinson et al. (2004) Dickinson, M., et al. 2004, ApJ, 600, L99
- Dunlop et al. (2012) Dunlop, J. S., McLure, R. J., Robertson, B. E., et al. 2012, MNRAS, 420, 901
- Dunlop et al. (2013) Dunlop, J. S., Rogers, A. B., McLure, R. J., et al. 2013, MNRAS, 432, 3520
- Ellis et al. (2013) Ellis, R. S, McLure, R. J, Dunlop, J. S, et al. 2013, ApJ, 763, L7
- Finkelstein et al. (2013) Finkelstein, S. L., Papovich, C., Dickinson, M., et al. 2013, Nature, 502, 524
- Finkelstein et al. (2012) Finkelstein, S. L., Papovich, C., Salmon, B., et al. 2012, ApJ, 756, 164
- Finlator et al. (2011) Finlator, K., Oppenheimer, B. D., & Davé, R. 2011, MNRAS, 410, 1703
- Fritz et al. (2006) Fritz, J., Franceschini, A., & Hatziminaoglou, E. 2006, MNRAS, 366, 767
- Furusawa et al. (2008) Furusawa, H., Kosugi, G., Akiyama, M., et al. 2008, ApJS, 176, 1
- Galametz et al. (2013) Galametz, A., Grazian, A., Fontana, A., et al. 2013, ApJS, 206, 10
- Grogin et al. (2011) Grogin, N. A., Kocevski, D. D., Faber, S. M., et al. 2011, ApJS, 197, 35
- Hashimoto et al. (2018) Hashimoto, T., Laporte, N., Mawatari, K., et al. 2018, Nature, 557, 392
- Hu et al. (2019) Hu, W., Wang, J., Zheng, Z., et al. 2019, ApJ, 886, 90
- Jiang et al. (2013a) Jiang, L., Egami, E., Mechtley, M., et al. 2013a, ApJ, 772, 99
- Jiang et al. (2013b) Jiang, L., Egami, E., Fan, X., et al. 2013b, ApJ, 773, 153
- Jiang et al. (2016) Jiang, L., Finlator, K., Cohen, S. H., et al. 2016, ApJ, 816, 16
- Jiang et al. (2017) Jiang, L., Shen, Y., Bian, F., et al. 2017, ApJ, 846, 134
- Kashikawa et al. (2011) Kashikawa, N., Shimasaku, K., Matsuda, Y., et al. 2011, ApJ, 734, 119
- Kashikawa et al. (2004) Kashikawa, N., Shimasaku, K., Yasuda, N., et al. 2004, PASJ, 56, 1011
- Koekemoer et al. (2011) Koekemoer, A. M., Faber, S. M., Ferguson, H. C., et al. 2011, ApJS, 197, 36
- Kotulla et al. (2009) Kotulla, R., Fritze, U., Weilbacher, P., & Anders, P. 2009, MNRAS, 396, 462
- Labbé et al. (2010) Labbé, I., González V., Bouwens, R. J., et al. 2010, ApJ, 716, L103
- Laporte et al. (2017) Laporte, N., Ellis, R. S., Boone, R., et al. 2017, ApJ, 837, L21
- Matthee et al. (2019) Matthee, J., Sobral, D., Boogaard, L. A., et al. 2019, ApJ, 881, 124
- McGreer et al. (2013) McGreer, I. D., Jiang, L., Fan, X., et al. 2013, ApJ, 768, 105
- McLure et al. (2011) McLure, R. J., Dunlop, J. S., de Ravel, L., et al. 2011, MNRAS, 418, 2074
- Noll et al. (2009) Noll, S., Burgarella, D., Giovannoli, E., et al. 2009, A&A, 507, 1793
- Oesch et al. (2015) Oesch, P. A., van Dokkum, P. G., Illingworth, G. D., et al. 2015, ApJ, 804, L30
- Ono et al. (2018) Ono, Y., Ouchi, M., Harikane, Y., et al. 2018, PASJ, 70, 10
- Ota et al. (2017) Ota, K., Iye, M., Kashikawa, N., et al. 2017, ApJ, 844, 85
- Ouchi et al. (2018) Ouchi, M., Harikane, Y., Shibuya, T., et al. 2018, PASJ, 70, 14
- Raiter et al. (2010) Raiter, A., Schaerer, D., & Fosbury, R. A. E., A&A, 523, 64
- Schaerer (2003) Schaerer, D. 2003, A&A, 397, 527
- Serra et al. (2011) Serra, P., Amblard, A., Temi, P., et al. 2011, ApJ, 740, 22
- Smith et al. (2018) Smith, B. M., Windhorst, R. A., Jansen, R. A., et al. 2011, ApJ, 853, 191
- Stark et al. (2017) Stark, D. P., Ellis, R. S., Charlot, S., et al. 2017, MNRAS, 464, 469
- Steidel et al. (2016) Steidel, C. C., Strom, A. L., Pettini, M., et al. 2016, ApJ, 826, 159
- Wilkins et al. (2011) Wilkins, S. M., Bunker, A. J., Stanway, E., et al. 2011, MNRAS, 417, 717
- Williams et al. (2018) Williams, C. C., Curtis-Lake, E., Hainline, K. N., et al. 2018, ApJS, 236, 33
- Windhorst et al. (2011) Windhorst, R. A., Cohen, S. H., Hathi, N. P., et al. 2011, ApJS, 193, 27
- Yan et al. (2012) Yan, H., Finkelstein, S. L., Huang, K.-H., et al. 2012, ApJ, 761, 177
- Zheng et al. (2017) Zheng, Z.-Y., Wang, J., Rhoads, J. E., et al. 2017, ApJ, 842, L22