Quantum correlations between the light and kilogram-mass mirrors of LIGO
Abstract
Measurement of minuscule forces and displacements with ever greater precision encounters a limit imposed by a pillar of quantum mechanics: the Heisenberg uncertainty principle. A limit to the precision with which the position of an object can be measured continuously is known as the standard quantum limit (SQL) CavesPRD1981; SQL1; SQL2; KLMTV. When light is used as the probe, the SQL arises from the balance between the uncertainties of photon radiation pressure imposed on the object and of the photon number in the photoelectric detection. The only possibility surpassing the SQL is via correlations within the position/momentum uncertainty of the object and the photon number/phase uncertainty of the light it reflects Unruh1982. Here, we experimentally prove the theoretical prediction that this type of quantum correlation is naturally produced in the Laser Interferometer Gravitational-wave Observatory (LIGO). Our measurements show that the quantum mechanical uncertainties in the phases of the 200 kW laser beams and in the positions of the 40 kg mirrors of the Advanced LIGO detectors yield a joint quantum uncertainty a factor of 1.4 (3 dB) below the SQL. We anticipate that quantum correlations will not only improve gravitational wave (GW) observatories but all types of measurements in future.
The Heisenberg uncertainty principle dictates that once an object is localized with sufficient precision, the momentum of that object must become accordingly uncertain. In a one-off measurement, this does not pose a problem. But in the case where the position of an object must be measured continuously, as in gravitational wave (GW) detectors, the momentum uncertainty from the act of measuring position evolves into position uncertainty for future position measurements – a process known as quantum backaction. In striking a balance between the precision of position measurements and the imprecision caused by quantum backaction, an apparent maximum precision for a continuous position measurement is reached. This is the SQL, and for an interferometric measurement, as long as the shot noise and QRPN are uncorrelated, the SQL is indeed the limit.
The SQL was first introduced by Braginsky et al. SQL1; SQL2 as a fundamental limit to the sensitivity of gravitational wave detectors. It should be possible to reach the SQL with objects that are macroscopic or even human-scale, because it is the quantization of the probe light that enforces the SQL (see, e.g., footnote 1 of KLMTV). In principle, the SQL can be surpassed when the shot noise and QRPN are correlated. Such correlations already exist in the interferometer, because incoming quantum fluctuations entering from its output port drive both the shot noise and the QRPN, giving rise to ponderomotive squeezing. An injected squeezed state, when combined appropriately with ponderomotive squeezing, enables surpassing the SQL (see Sec. IVB of KLMTV). Alternative methods for surpassing the SQL are presented in KLMTV, and extended to include optical spring effects in BnC1.
Here, we inject a laser mode in a squeezed vacuum state in a laser interferometric GW detector with 40 kg mirrors, and use the optomechanically-induced correlations of ponderomotive squeezing to surpass the free-mass SQL. This measurement marks two significant milestones of quantum measurement. First, we directly observe QRPN contributing to the motion of kg-mass objects, providing evidence that quantum backaction imposed by the Heisenberg uncertainty principle persists even at human scales. Second, we surpass the SQL, proving the existence of quantum correlations involving the position uncertainty of the 40 kg mirrors. This measurement is an important step toward further improvements in GW sensitivity through quantum engineering techniques KweePRD2014; KLMTV; BnC1; Danilishin2008; PurduePhysRevD2002; polzikBAE2017.
A significant barrier to revealing quantum correlations between light and macroscopic objects is the ubiquitous presence of thermal fluctuations that drive their motion. Previous demonstrations of QRPN have involved cryogenically pre-cooled, pico- to micro-gram scale mechanics qrpBoulder2013; schwabBAE2014; wilsonNature2015; teufelPRL2016; polzikBAE2017, with two exceptions cripeNature2019; sudhirPRX2017. Similarly, previous sub-SQL measurements of displacements have also been performed on cryogenically pre-cooled mechanical oscillators at the pico- teufelNatureNano2009 to nano-gram MasonNaturePhysics2019 mass scale. The present measurements are performed on the room-temperature, 40 kg mirrors of Advanced LIGO using 200 kW of laser light, and are enabled by injection of squeezed states and subtraction of classical noise to reveal quantum noise below the SQL.
We performed this experiment using the Advanced LIGO detector in Livingston, Louisiana. For the third astrophysics observing run, squeezed vacuum is injected into the interferometer with squeezing level and squeezing quadrature angle tuned to maximize the GW sensitivity O3Squeezing. In this experiment, the interferometer is maintained in the observing configuration instrO3paper, except data is taken with an increased squeezing level and over a range of squeezing angles, in order to fully characterize the quantum noise.

The Advanced LIGO detector is a Michelson interferometer with two 4-km Fabry-Perot arms, as well as power- and signal- recycling cavities at the input and output ports of the beamsplitter, respectively (see Fig. 1). The arm-cavity optics are 40 kg fused silica mirrors, suspended as pendulums inside an ultrahigh vacuum envelope O1instrPRL2016. During the measurement, kW of 1064 nm laser power circulates in each arm cavity. After passing through an output mode cleaner, the differential arm displacement signal () is detected as modulations of a small static field at the output due to a deliberate mismatch in the interferometer arm lengths O1instrPRL2016. The displacement signal is part of a closed servo loop, which is monitored by a continuous calibration procedure that also extracts the instrument sensing function by driving motion and measuring the optical response. Details of the squeezed light source and its operation, including the control method for adjusting squeezing angle, are found in O3Squeezing. For this measurement, injected squeezing results in 3.3 dB of squeezing and 7.7 dB of antisqueezing measured at the GW readout.

An analytic model of the displacement sensitivity in an idealized LIGO interferometer illustrates how the combination of ponderomotive squeezing and injected squeezing allows us to surpass the SQL. A model which builds on methods developed in KLMTV; BnC1, with extensions to account for losses and off-resonance cavities, is provided in the Methods section. Here, the idealized model is used for clarity. The Heisenberg uncertainty principle applied to interferometric measurement of differential displacement, , sets a limit to the one-sided spectral density of:
| (1) |
with
| (2) |
Here is the circulating arm power, the laser wavenumber, the sideband frequency of the GW readout, and each mirror mass. is the arm length of m and the signal bandwidth of Hz in LIGO. is the optical field transmissivity between the arm cavities and readout detector, making the sensing function relating to the emitted optical field that modulates the homodyne readout power.

The factors and capture the radiation pressure interaction whereby the mirror oscillator motion correlates the injected optical amplitude quadrature to the output phase quadrature, with the pondermotive interaction strength. The theory of pondermotive squeezing is detailed in Sec. IVA-B of KLMTV. accounts for injection of squeezed states. Without injected squeezing, , in which case the arm power may be chosen to minimize by balancing shot noise and radiation pressure noise. The resulting minimum is the free-mass SQL for a Michelson interferometer with a Fabry-Perot cavity in each arm KLMTV:
| (3) |
When injecting squeezed states at squeeze angle with squeeze factor , the squeezing measured at the readout, , becomes:
| (4) | ||||
| (5) |
is defined as the squeezing angle that reduces the shot noise power spectral density, where , by a factor of .
The expression characterizes the frequency-dependent interaction between pondermotive and injected squeezing. Eqn. 4 indicates that at frequencies where , the two conspire to produce a minimum in the quantum noise spectrum, appearing as a “dip” in the curves of Fig. 2. Whereas the case led to the SQL in Eqn 3, injecting squeezed states allows the SQL to be surpassed at measurement frequencies for which .
Fig 2 shows amplitude spectral densities of differential displacement. Exposing the sub-SQL dip requires reliably estimating and subtracting classical noise around 40 Hz. The data are acquired as three sets of spectral measurements in each of two operating modes – with and without squeezing injection. By alternating operation between the two modes, we establish that the noise is consistent within statistical variations, confirming that it is stationary over the duration of the experiment. To further address the concern that the classical noise between modes of operation may be changing, additional data at a range of squeezing angles are obtained, as shown in Fig. 3 .
In Fig. 2, the black trace is the measured total noise at the readout with squeezing disengaged, including both quantum and classical noise contributions. It is generated from a 90-minute average split across three non-contiguous time periods where the squeezer cavity is set off-resonance O3Squeezing, allowing the unsqueezed vacuum state to enter the interferometer. The blue trace is the modeled quantum noise contribution to the total noise measurement of the black trace. Subtracting the blue trace from the black trace gives the total classical noise contribution. We verify that this classical noise component is stationary, and independent of squeezer status (see discussion of Figure 3 below and details in Methods). The model shows that quantum noise dominates the interferometer sensitivity at high frequencies ( Hz), and accounts for 28% of the total measured noise power at 40 Hz. Of the remaining non-quantum noise, 24% is estimated to be coating and thermooptic noise, with the rest unidentified instrO3paper.
The green trace of Fig. 2 shows the inferred quantum noise spectrum with squeezing injected at . This angle, determined from the model fit, places the dip in the frequency region where the ratio of the total noise in the reference spectrum and the SQL curve is minimized. The green trace is calculated as the total measured displacement spectrum while the squeezer is engaged, minus the classical noise contribution previously established from the reference measurement. The purple trace shows the quantum noise model corresponding to squeezing, featuring a dip in the quantum noise that reaches down to 70% or 3 dB of the SQL at 40 Hz.
Squeezing measurements at three additional ’s are presented in Fig.3 . They show that QRPN contributes to the motion of the Advanced LIGO mirrors. At each , the quantum noise trace is calculated by subtracting the same classical noise contribution (determined from the reference data) from the measured displacement spectrum. We note that the modeled quantum noise plotted here requires the full functional form of in Eqn. 9 in Methods, rather than the simplified version of Eqn. 4. These additional measurements characterize contributions from an unwanted phase shift due a slight detuning of the signal cavity, which manifests as a squeeze angle shift of accumulating across the frequency region where . A total of 12 squeezing measurements are combined to plot in the Extended Data.
Uncertainty in both data and model are calculated here, with additional details in Methods. The statistical error in the power spectrum measurement of the quantum noise, after subtraction, is 8% at 40 Hz (for a 0.5 Hz bin width). We test for discrepancies between the three reference datasets, and find that the relative uncertainty in the classical noise stationarity is bounded by the same statistical error. Errors in the optical sensing function , along with the servo loop compensation, are determined from the online interferometer calibration procedure instrO3paper, and bounded to be 3% Cal_O2. Uncertainties in arm cavity power is 5%. Aside from the reference, the model curves of Figs. 2 and 3 require the squeeze factor and interferometer losses O3Squeezing, which are determined from fits across all datasets, along with the signal-recycling cavity detuning . Optical spring effects are accounted in the calibration but, at this , are insignificant for the quantum noise model.
The measurements presented here represent long-awaited milestones in verifying the role of quantum mechanics in limiting the measurement of small displacements generally, and in the sensitivity of GW detectors in particular.
First, we observe that QRPN contributes to the motion of the kilogram-scale mirrors of LIGO. This observation is also made in the Advanced Virgo GW detector VirgoQRPN. It is remarkable that quantum vacuum fluctuations can influence the motion of these macroscopic, human-scale objects, and that the effect is measured. This is quantum mechanics at its experimentally most macroscopic scale.
Second, revealing quantum noise below the SQL in the Advanced LIGO detector is the first realization of a quantum nondemolition technique in GW detectors SQL1; SQL2, where quantum correlations prevent the measurement device from demolishing the same information one is trying to extract. Exploiting quantum correlations allows a fundamental quantum limit to be manipulated to improve measurement precision.
Finally, we must not forget the foremost scientific objectives of the Advanced LIGO detectors: they are designed for astrophysical observations of GWs from violent cosmic events. During the third observing run, the squeezing angle is set to optimize the sensitivity to GWs from binary neutron star mergers O3Squeezing. This is not the squeeze angle where shot noise is minimized, but where the combination of shot noise and QRPN are minimized, implying that backaction evasion plays a role in optimizing the sensitivity of the Advanced LIGO detector. This is one of the factors that has allowed Advanced LIGO to go from detecting roughly one astrophysical event per month in observing runs 1 and 2, to about one astrophysical trigger per week in the third observing run. In the future, with further mitigation of classical noise, sub-SQL performance of GW detectors promises ever greater astrophysical reach.
References
- (1) Caves, C. M. Quantum-mechanical noise in an interferometer. Phys. Rev. D 23, 1693–1708 (1981). https://link.aps.org/doi/10.1103/PhysRevD.23.1693.
- (2) Braginsky, V. B. & Khalili, F. Y. Quantum nondemolition measurements: the route from toys to tools. Rev. Mod. Phys. 68, 1–11 (1996). https://link.aps.org/doi/10.1103/RevModPhys.68.1.
- (3) Braginsky, V. B., Khalili, F. Y. & Thorne, K. S. Quantum Measurement (Cambridge University Press, 1992).
- (4) Kimble, H. J., Levin, Y., Matsko, A. B., Thorne, K. S. & Vyatchanin, S. P. Conversion of conventional gravitational-wave interferometers into quantum nondemolition interferometers by modifying their input and/or output optics. Physical Review D 65, 022002 (2001). http://link.aps.org/doi/10.1103/PhysRevD.65.022002.
- (5) Unruh, W. G. Quantum Optics, Experimental Gravitation, and Measurement Theory (Plenum, 1982).
- (6) Buonanno, A. & Chen, Y. Quantum noise in second generation, signal-recycled laser interferometric gravitational-wave detectors. Phys. Rev. D 64 (2001).
- (7) Kwee, P., Miller, J., Isogai, T., Barsotti, L. & Evans, M. Decoherence and degradation of squeezed states in quantum filter cavities. Phys. Rev. D 90, 062006 (2014). https://link.aps.org/doi/10.1103/PhysRevD.90.062006.
- (8) Danilishin, S. et al. Creation of a quantum oscillator by classical control (2008).
- (9) Purdue, P. & Chen, Y. Practical speed meter designs for quantum nondemolition gravitational-wave interferometers. Phys. Rev. D 66, 122004 (2002). https://link.aps.org/doi/10.1103/PhysRevD.66.122004.
- (10) Møller, C. B. et al. Quantum back-action-evading measurement of motion in a negative mass reference frame. Nature 547, 191–195 (2017). http://www.nature.com/nature/journal/v547/n7662/full/nature22980.html.
- (11) Purdy, T. P., Peterson, R. W. & Regal, C. a. Observation of Radiation Pressure Shot Noise on a Macroscopic Object. Science 339, 801–804 (2013). http://www.sciencemag.org/cgi/doi/10.1126/science.1231282.
- (12) Suh, J. et al. Mechanically detecting and avoiding the quantum fluctuations of a microwave field. Science 344, 1262–1265 (2014). http://www.sciencemag.org/content/344/6189/1262.
- (13) Wilson, D. J. et al. Measurement-based control of a mechanical oscillator at its thermal decoherence rate. Nature 524, 325–329 (2015). http://www.nature.com/nature/journal/v524/n7565/abs/nature14672.html.
- (14) Teufel, J., Lecocq, F. & Simmonds, R. Overwhelming Thermomechanical Motion with Microwave Radiation Pressure Shot Noise. Physical Review Letters 116, 013602 (2016). http://link.aps.org/doi/10.1103/PhysRevLett.116.013602.
- (15) Cripe, J. et al. Measurement of quantum back action in the audio band at room temperature. Nature 568, 364–367 (2019). https://www.nature.com/articles/s41586-019-1051-4.
- (16) Sudhir, V. et al. Quantum Correlations of Light from a Room-Temperature Mechanical Oscillator. Physical Review X 7, 031055 (2017). https://link.aps.org/doi/10.1103/PhysRevX.7.031055.
- (17) Teufel, J. D., Donner, T., Castellanos-Beltran, M. A., Harlow, J. W. & Lehnert, K. W. Nanomechanical motion measured with an imprecision below that at the standard quantum limit. Nature Nanotechnology 4, 820–823 (2009).
- (18) Mason, D., Chen, J., Rossi, M., Tsaturyan, Y. & Schliesser, A. Continuous force and displacement measurement below the standard quantum limit. Nature Physics 15, 745–749 (2019). https://doi.org/10.1038/s41567-019-0533-5.
- (19) Tse, M., Yu, H., Kijbunchoo, N. et al. Quantum-enhanced advanced ligo detectors in the era of gravitational-wave astronomy. Phys. Rev. Lett. 123, 231107 (2019). https://link.aps.org/doi/10.1103/PhysRevLett.123.231107.
- (20) Buikema, A. et al. Sensitivity and performance of the advanced ligo detectors in the third observing run. in preparation (2019).
- (21) Abbott, B. P. et al. Gw150914: The advanced ligo detectors in the era of first discoveries. Phys. Rev. Lett. 116, 131103 (2016). https://link.aps.org/doi/10.1103/PhysRevLett.116.131103.
- (22) Cahillane, C. et al. Calibration uncertainty for advanced ligo’s first and second observing runs. Phys. Rev. D 96, 102001 (2017). https://link.aps.org/doi/10.1103/PhysRevD.96.102001.
- (23) Acernese, F. et al. Quantum back-action on kg-scale mirrors - observation of radiation pressure noise in the advanced virgo detector. in preparation (2020).
- (24) Kiwamu, I. Time domain implementation of dcpd cross correlation. Tech. Rep. (2017). https://dcc.ligo.org/LIGO-T1700131.
METHODS
This section expands on four topics related to the measurement: a) the augmented model for a non-ideal interferometer, b) measurement uncertainty, c) quantum noise model uncertainty, d) non-stationary noise uncertainty, and e) the additional plots in Extended Data.
The model curves present in Figures 2-5 are calculated from the full coupled-cavity equations of BnC1, which are exact and omit only effects from high-order transverse optical modes. The model provided by equations 1-5 represents an idealized interferometer with all cavities on resonance and no optical losses. Here we extend the model to consider the dominant experimental deviations from the ideal case, without the complexity of the exact equations. This extension includes imperfect input and output efficiency, as well as the additional frequency-dependent effect on the squeezing angle from the small, unintended phase shift within the signal-recycling cavity. For the parameters of this paper, the following model is accurate to 5% of the exact model quantum power spectral density between 10Hz to 100Hz.
The input and output efficiency of the interferometer are introduced using two new parameters, and respectively. The input efficiency represents the total fractional coupling of optical power between the squeezer cavity and the interferometer, and the output efficiency is the total from the interferometer to the readout homodyne detector. They must be considered separately due to differences in their interaction with QRPN, leading to the expressions:
| (6) | ||||
| (7) | ||||
| (8) | ||||
| (9) | ||||
| (10) |
External output loss does not change the dark-port to arm cavity optical field transmissivity , but it does modify the dark-port to readout transmissivity, lowering the sensing function to be . This leads to the terms in Eqn. 6, where shot-noise scales as , but the QRPN term does not. QRPN pertains to real motion, and its reduced influence on the optical quantum noise is compensated by the calibration.
A frequency-dependent effective efficiency, , accounts for the output loss not being able to affect the real motion of the masses due to radiation pressure, while the squeezed state is degraded by both input and output losses. The form of Eqn. 7 reflects the relation of the input, output and effective losses rather than efficiencies, and it is accurate for small losses.
The total squeezing angle shift due to the signal recycling cavity is encoded in the parameter . It appears alongside the pondermotive effect on the squeezing angle in Eqn. (10), except it accumulates through the cavity pole transition. This formulation is accurate for small detunings of the interferometer signal cavity, and is related to the physical phase shift within the signal recycling cavity by , calculated for the LIGO Livingston mirror parameters. Notably absent from this non-ideal model but present in BnC1, is the contribution of the optical-spring effect due to . We note that the above non-ideal model is accurate to 1% in the zero detuning case . While strong optical springs are an alternative method of achieving sub-SQL quantum noise sensitivity, the accuracy of the above augmented model indicates that the spring contribution is mostly negligible for this measurement.
Figure 2 shows that quantum noise accounts for only 28% of the total interferometer noise power at 40 Hz. For this reason, classical noises must be subtracted in order to reveal the quantum limited displacement sensitivity. The interferometer is a complex instrument with such sensitivity that the following considerations must be addressed to validate the subtraction. First, the fiducial quantum noise model of the reference dataset and the parameters it relies on must be established and the data must be calibrated. Second, the classical noise established for the reference operating mode must be representative of the classical noise during squeezing operation. In particular, the classical noise during the reference period must not be higher than during squeezing, which would bias our inference to underestimate the quantum noise contribution during squeezing. The reference and squeezing datasets are taken in multiple, alternating segments and we test for variations arising from non-stationary (time-varying) noise. Furthermore, the non-stationary noise power contributions are mitigated by using a statistically “robust” median based computation to calculate the sampled power spectra.
The following paragraphs proceed by detailing the measurement sequence used to characterize the stationarity, then describe how uncertainty propagates through the data analysis for the post-subtraction quantum noise curves. We then show how the calibration and interferometer data outputs are combined with external measurements to establish our quantum noise model. The statistical uncertainty is then outlined, followed by the methodology for characterizing the noise stationarity between squeezing and reference datasets. Finally, the spectral density estimator is described.
The data shown in Fig. 2 were taken over a 5 hour period on the advanced LIGO detector. To avoid variations of classical noise and calibration, the interferometer power is held constant across all measurements. To minimize statistical error, the majority of the measurement time is spent in the two modes plotted: three 30-minute “reference” segments with the squeezer disabled, alternating with three 30-minute segments with squeezing at . Each reference segment is following by a squeezing segment, alternating three times to establish that the classical noise contribution is constant across the total duration. The remaining time is split across nine additional segments at varying input squeezing angles, and the final segment is a fourth reference without squeezing.
Here we describe how the uncertainty propagates through the subtraction in our measured quantum noise curves. The symbols for the frequency dependent reference and squeezing data are , , and , for the models. The post-subtraction inferred quantum noise is given as in the expression
| (11) |
The relative error of the post-subtraction squeezed quantum noise is given by , composed of the quadrature sum of relative errors due to the optical sensitivity calibration, ; the servo loop calibration, ; the modeling uncertainty, ; statistical fluctuations , ; and relative stationarity uncertainty terms, , and . All of these uncertainties are frequency-dependent, but the argument is suppressed for space. The definitions of these components are clarified in the text following, but contribute to the expression:
| (12) |
The lines of the above relation represent terms with different magnitudes of scaling terms. Given that , the top line for the calibration and model error has terms with order-1 coefficients, indicating that the relative errors quoted in the main text remain small for the comparison to the dip model. The lower two lines of eq. 12 show that the relative statistical fluctuations and stationarity uncertainties are magnified by the ratio, , of the total classical PSD to the squeezed quantum PSD, approximately a factor of , at 40 Hz.
The first line of Eqn. 12 includes the calibration and unsqueezed reference quantum noise model uncertainty terms, , , . The LIGO online calibration system determines the optical sensing function which affects both the model and calibration uncertainties. To prevent double-counting in the incoherent sum, this optical gain has been isolated to the factor and should not be considered in or . The sensing function is monitored continuously by injecting displacement signals at several frequencies. Some of these appear as narrow lines in the measured spectra of Figure 2. From these continuous injections, the bandwidth and the product , are determined. In addition, parameters related to the optical spring are measured Cal_O2, but primarily affect the sensing function at frequencies Hz for the measured detuning. Additional lines monitor the servo loop actuators to apply the frequency-dependent correction for the servo closed loop response, which is contained in . The quoted calibration uncertainty of 3% is the incoherent sum .
Having factored out of , any error in subtracting the classical noise estimate between reference data and model can only arise from estimating the shot noise and QRPN components represented by the term . Here, is a scale factor relating homodyne power to optical field. It is unknown because the calibration system exports its sensing function in an end-to-end fashion with the photodectors in arbitrary voltage digitization units; however, the may be well estimated using a cross-correlation method detailed below. The remaining contribution may be estimated from the factors . Independent measurements establish the quoted arm power kW, and this, combined with the optical sensing gain calibration, allows us to determine the output efficiency, . The squeezing level at high frequencies is determined by and (see Eqns. 7-8), and using the extended datasets with , the input efficiency may be determined from the observed readout squeezing level.
The parameters describing the status of the interferometer and squeezer during the experiment are listed in Table 1 of Extended Data with uncertainties. They are also the values used in the modeling of quantum noise calculation. Immediately before the 5 hour dataset, the nonlinear parameter of the squeezer was measured to calculate . The squeezing angle is determined ultimately through a model fit, but it agrees with our knowledge of the nonlinear conversion from the coherent control field demodulation angle to the observed squeezing angle and the settings during the shot-noise squeezing () and antisqueezing () datasets. The frequency-dependent contributions of the squeezing and arm power modeling uncertainties are shown in Fig. 4, and they do not strongly influence the model at the sub-SQL dip.
The following cross-correlation method IzumiCrossCorr2017 is used to determine the factor , that relates the arbitrary experimental photodetector units back to the physical optical field units. Two photodetectors are located at the readout port of the LIGO interferometer (see figure 1). When squeezing is not injected, shot-noise and readout electronics noise (i.e. dark noise) are uncorrelated between the two photodetectors, while QRPN and all of the classical noises are correlated. If the cross correlation and dark noise is subtracted from total noise power for the reference dataset, then only the shot noise remains, calibrated to displacement. This precisely determines the optical sensing gain in physical units, up to the uncertainty . The dark noise is only of the shot noise power and so contributes negligibly to the uncertainty in this subtraction.
The statistical uncertainty arises in that the fluctuations intrinsic to noise also limit our ability to estimate it. With total measurement time for a given dataset , and bin width of in the spectral density calculation, the relative statistical uncertainty of the inferred quantum noise power is , with the statistical efficiency accounting for the spectral estimation method. For the median method detailed below, we determine through numerical experiments on white noise that for single-bin error bars. The bin-bin covariance due to the apodization window causes when averaging multiple adjacent datapoints. The total statistical uncertainty of 8% includes both datasets and and their scaling by in Eqn. 12.
Here we describe and characterize the terms , in the uncertainty budget of Eqn. 12. We label these terms together the stationarity uncertainty, and they are intended to quantify potential variations between the classical noise power as estimated from the unsqueezed reference dataset and the classical noise power actually present in the squeezing measurements. Under the presupposition that the models, , and are perfect, and the statistical noise is small, these uncertainties are defined as the relative difference . The two are distinguished as the changes to classical noise arising from variations in time, , and from switching the physical operating mode between the reference and squeezing, .
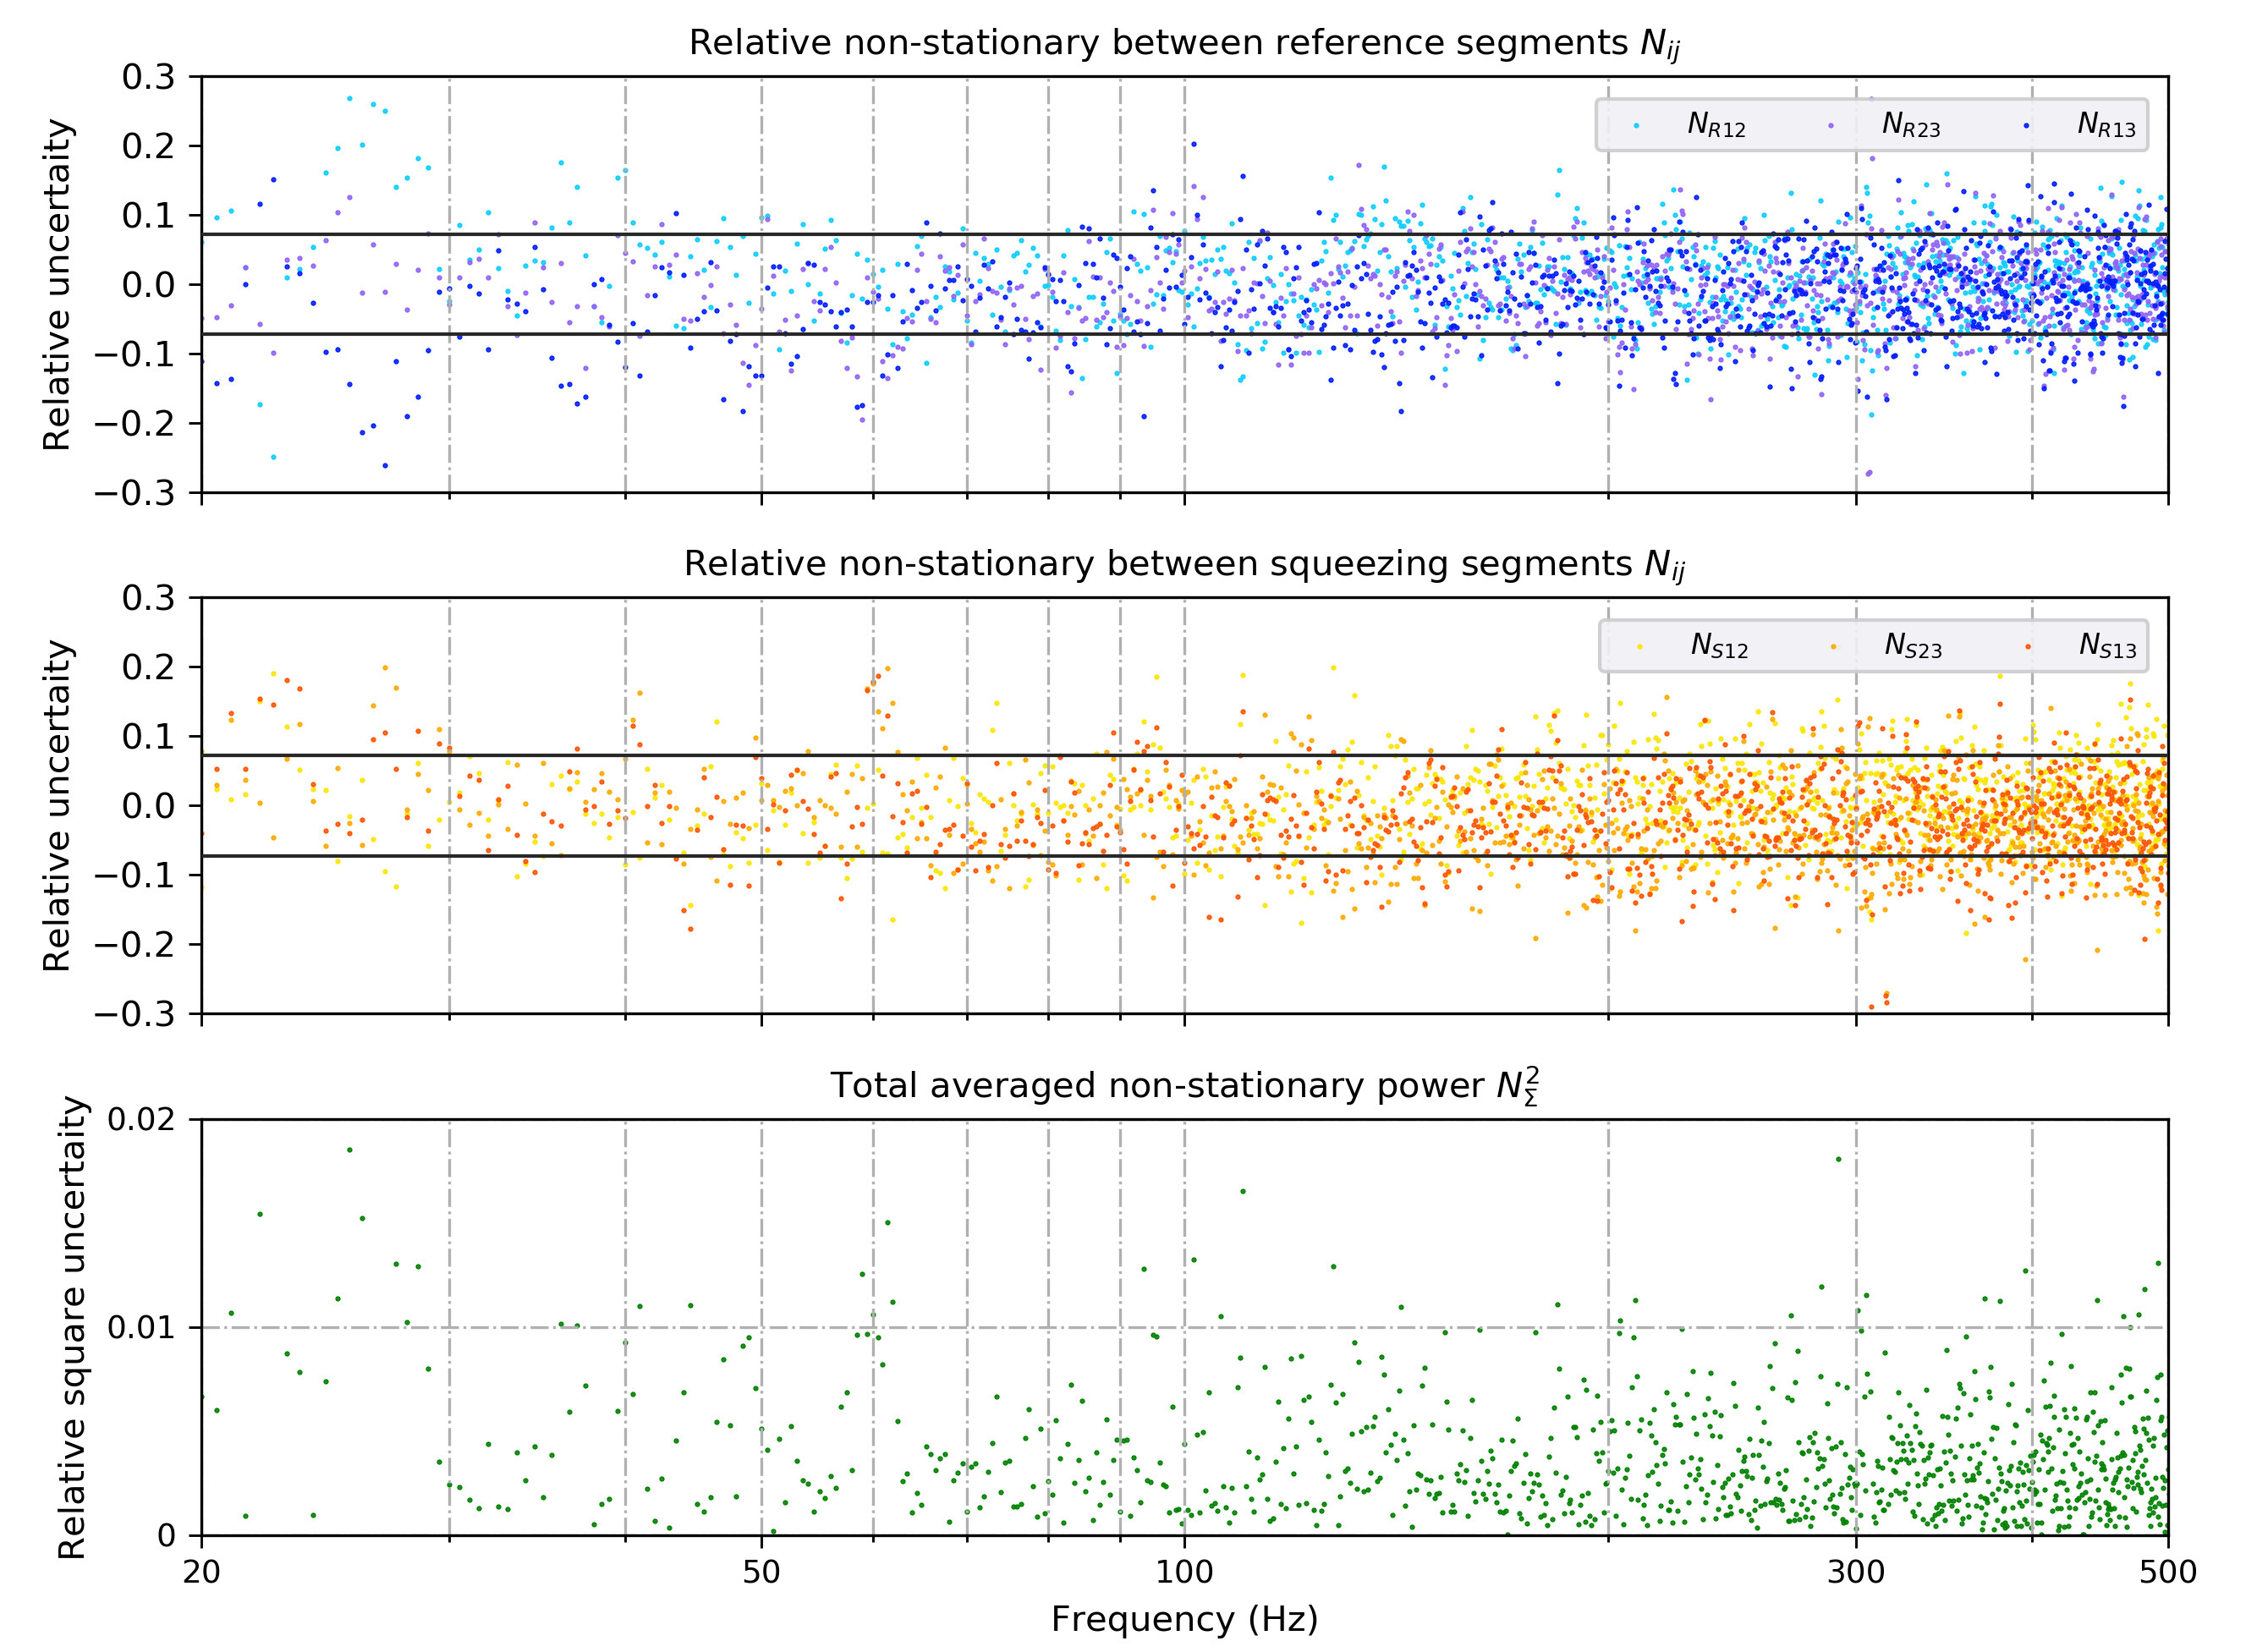
The time variation contribution to non stationarity, , is mitigated both through the spectral density estimation method and the use of three alternating segments for the reference and squeezed data. The aim of the alternating segments is for the operating mode to switch on a timescale faster than the environmental variation. The environmental timescale is not known or even well-defined, so instead the discontiguous segments of reference time are compared, setting a limit to the non-stationarity of the squeezing segment between them. This is done likewise for the squeezing segments surrounding a reference segment. We define a metric for the relative non-stationarity between two such discontiguous segments to be
| (13) |
Each pair of datasets makes an estimate of the noise contribution varying at and below the separation timescale of the datasets, here 1 hour. Each estimate is limited by the statistical error of the constituent datasets, and they are shown in Fig. 6. Since each pair only constitutes a fraction of the full data, the multiple estimates are combined to reduce the statistical uncertainty.
| (14) |
Finally, these metrics must be related to the stationarity term . The averaged nonstationary power represents an estimate of the time-varying contibution between adjacent reference and squeezing segments, of which there are three. For many such segments, assuming random fluctuations to the environmental noise level at the alternation time scale, the contributions add in quadrature to give . We then propagate the statistical noise limits for segments one third the length of the total reference time . This arrives at the statistical limit to our stationarity uncertainty of . Because the total squeezing data time is also , our limit to the time variation contribution to non-stationarity evaluates to be the same as the total statistical uncertainty from both the squeezing and unsqueezed datasets, . In addition to the individual pairs, Fig. 6 also shows the combined estimate .
The operating-mode varying component of non-stationary noise is constrained by the following arguments. The first is that it is quantitatively constrained by the data at additional squeezing angles depicted in Fig. 3 of the main text and Fig. 5 of the Extended Data. There, the same classical noise estimate is subtracted and the model curves maintain their agreement with the inferred quantum noise at alternate squeezing angles. Those datasets however have limited statistical bounds due to their short duration. The term may be considered small for the following physical reasons. The primary reason is that during the without-squeezing time, the optical path is not changed, only the squeezer OPO is operated off of resonance to stop its nonlinear parametric interaction. This means that environmental scatter noise - the very low-power light leaking from the interferometer to the squeezer system - does not impinge on different scattering surfaces between the two modes. In the event that such scatter does matter, the fourth reference taken at the end of the entire measurement period uses an in-vacuum beam diverter to block the path to the squeezer. Testing that fourth reference against the other three through the method shows no significant changes to the classical noise.
In the event that the classical noise does change from the switch to squeezing, we argue that the addition of the nonlinear parametric interaction from the squeezer on this scattered light is more likely to increase the noise only during the squeezing segments. This implies that the measurement should not be biased low and will not over-estimate how much we have surpassed the SQL. Indeed, the few data points in Figs. 2 and 4 that exceed the model beyond the statistical fluctuations may be due to such a squeezer-specific noise source. We attribute the minimal classical noise contribution to the use of a traveling wave OPO cavity, in-vacuum suspended layout and coherent control implementation O3Squeezing.
Finally, we describe the median method used for our spectral density estimation. We claim through the above arguments that the classical noise is established to be stationary in these datasets, however it is known from astrophysical analysis that these complex detectors have intermittant time-resolved glitches and artifacts of varying strengths. Intervals of excess noise are nontrivial to identify due to the inherently random nature of noise, and time-resolved noise power vetoes can introduce selection bias. We use the Welch - Bartlett overlap method to estimate the power spectral density with no selection vetoes. Instead, rather than averaging the individual spectra independently at each frequency, the sample median at each frequency is taken. This generates a bin-by-bin median strain spectral power density.
Initially, the entire period for a given spectral density estimate is split into N 2-second segments, where each segment overlaps the segment before it by 50%, implementing the Welch method. For each segment, the time-series is linear detrended and a Hann window is applied, then converted to a displacement spectrum by a Fourier Transform. The collection of segments gives N estimates of the power density in each frequency bin, each nominally following a chi-square distribution on two variables (the real and imaginary parts of the Fourier transform), but the distribution has an extended tail due to glitches and transients of the detector. The median is picked for each frequency bin, and then a computed scale factor is applied to convert the distribution median to the mean noise power. This technique is unbiased for stationary noise, and greatly improves the robustness to glitches and nonstationary contributions, without selection bias from time-domain band-limited noise vetos. The downside is that the statistical efficiency is approximately worse than the typical Welch method for a given spectrum averaging time.
Fig. 4 of Extended Data shows a variation of Figure 2 spanning a wider frequency range. The figure includes the frequency-dependent uncertainties of Eqn. 12 in its model curves and subtracted quantum noise plots.
Fig. 5 shows a measurement of (upper) and model of (lower) the squeezing term of the augmented model. The quantum noise spectrum at ten additional ’s is determined by subtracting the classical noise contribution (previously established through the reference measurement) from the measured displacement spectrum at each . Each inferred quantum noise spectrum is then divided by the modeled quantum noise spectrum without injected squeezing (blue trace in Fig.2) to obtain the observed squeezing term . The dashed lines indicate cross-sections in other figures. Green is in Fig. 2, and yellow blue and purple correspond to the angles of Fig. 3 .
Acknowledgements: LIGO was constructed by the California Institute of Technology and Massachusetts Institute of Technology with funding from the National Science Foundation, and operates under Cooperative Agreement No. PHY-0757058. Advanced LIGO was built under Grant No. PHY-0823459. The authors also gratefully acknowledge the support of the Australian Research Council under the ARC Centre of Excellence for Gravitational Wave Discovery, grant No. CE170100004 and Linkage Infrastructure, Equipment and Facilities grant No. LE170100217 and Discovery Early Career Award No. DE190100437; the National Science Foundation Graduate Research Fellowship under Grant No. 1122374; the Science and Technology Facilities Council of the United Kingdom, and the LIGO Scientific Collaboration Fellows program.
| Interferometer Parameter | Value |
| Laser power in the arm cavity, () | kW |
| Optical loss before IFO, (1-) | 17.2% |
| Optical loss after IFO, (1-) | 17.4% |
| SRM phase detuning, () | mrad |
| Squeezer Parameter | Value |
| Measured OPO nonlinear gain | 4.40.1 |
| Squeezing ideally generated by OPO () | dB |
| Squeezer phase noise () | 0-50 mrad |
| Squeezing quadrature rotation angle () | |
| Max phase squeezing in IFO | 3.3 dB |
| Max phase anti-squeezing in IFO | 7.7 dB |