Measurement of the permanent electric dipole moment of the neutron
Abstract
We present the result of an experiment to measure the electric dipole moment (EDM) of the neutron at the Paul Scherrer Institute using Ramsey’s method of separated oscillating magnetic fields with ultracold neutrons (UCN). Our measurement stands in the long history of EDM experiments probing physics violating time reversal invariance. The salient features of this experiment were the use of a co-magnetometer and an array of optically pumped cesium vapor magnetometers to cancel and correct for magnetic field changes. The statistical analysis was performed on blinded datasets by two separate groups while the estimation of systematic effects profited from an unprecedented knowledge of the magnetic field. The measured value of the neutron EDM is .
Keywords:
electric dipole moment, time reversal violation, beyond Standard Model physics, magnetic resonance spectroscopyA nonzero permanent electric dipole moment for a non-degenerate particle with spin implies the violation of time-reversal symmetry. Invoking the CPT theorem Luders1954; Pauli1955 for quantum field theories, this also indicates the violation of the combined symmetry of charge conjugation and parity (CP). The standard model of particle physics (SM) contains two sources of CP violation: the phase of the CKM matrix resulting in the observed CP-violation in - and -meson decays, and the coefficient of the still-unobserved CP-violating term of the QCD Lagrangian tHooft1976. Both are too small to account for the observed baryon asymmetry of the Universe Morrissey2012NJP which requires CP violation as one of three essential ingredients Sakharov1967. Furthermore, many theories beyond the SM naturally have large CP-violating phases Engel2013PPNP that would result in an observable neutron EDM (nEDM). In combination with the limits from searches for the electron Andreev2018 and Graner2016PRL EDM, the limit on the nEDM confirms and complements stringent constraints upon many theoretical models Chupp2015PRC. In particular, the nEDM alone stringently limits . This unnaturally small upper limit on is known as the strong CP problem; it gave rise to searches for a Goldstone boson, the axion Wilczek1978; Peccei1977, which is also an attractive candidate to solve the dark matter mystery Swart2017.
An overview of the spectrometer used for the measurement is shown in Fig. 1, while a detailed technical description of the apparatus (upgraded from that used for the previous best limit Baker2006; Baker2014; Pendlebury2015PRD) and of data taking may be found in Ref. Abel2018nEDMProc. A total of 54068 individual measurement cycles, during 2015 and 2016, were used to determine the change in the Larmor precession frequency of the neutron,
| (1) |
correlated with the change of polarity of the electric field , where is the magnetic dipole moment and a co-linear magnetic field (). For this purpose we used Ramsey’s method of separate oscillating fields Ramsey1950PR.

In each cycle UCN from the Paul Scherrer Institute’s UCN source Anghel2009; Lauss2014 were polarized by transmission through a superconducting solenoid; spin flipper 1 (SF1) then allowed the selection of the initial spin state (up or down). The switch directed the incoming neutrons to the cylindrical precession chamber situated above the beam line. The precession chamber (radius , height ) was made of diamond like carbon coated Atchison2006PLB; Atchison2006PRC aluminum electrodes and a deuterated-polystyrene (dPS) Bodek2008 coated insulator ring milled from bulk polystyrene. After an equilibrium density of up to inside the precession chamber was attained, and a UCN shutter in the bottom electrode was closed to confine the UCN for a total of . A small valve was opened for to release a sample of polarized vapor, that was used as a co-magnetometer (HgM). A first low-frequency (LF) pulse of duration and frequency tipped the spin by . Ramsey’s technique was then applied to the neutrons, with an LF pulse (also of duration) at a frequency tipping the UCN spins by . After a period of free precession a second neutron LF pulse, in phase with the first, was applied. During data taking, the LF pulses were alternated between four frequencies in the steep regions of the central Ramsey fringe.
Immediately after the second neutron LF pulse the UCN shutter in the bottom electrode was opened. The switch was also moved to the “empty” position connecting the precession chamber with the UCN detection system Afach2015EPJA; Ban2016EPJA, which counted both spin states simultaneously in separate detectors. The state of the spin flippers (SF2a/SF2b) above each detector was alternated every fourth cycle, with one of them being off while the other was on, to average over detection, spin flipper, and spin analyzer efficiencies. For each cycle , we recorded an asymmetry value between the number of spin up () and spin down neutrons (): . On average, neutrons were counted per cycle.
In addition, for each cycle we obtained a frequency from the analysis of the mercury precession signal, as well as 15 frequencies from cesium magnetometers (CsM) positioned above and below the chamber.
There are 22 base configurations of the magnetic field within the dataset. Each base configuration was defined by a full degaussing of the four-layer magnetic shield and an ensuing magnetic field optimization using all CsM described in detail in Ref. Elise2019. This procedure was essential to maintain a high visibility, which was measured to be on average. A base configuration was kept for a duration of up to a month, during which only the currents of two saddle coils on the vacuum tank, above and below the chamber, were changed to adjust the vertical gradient in a range of approximately Afach2015PRD. Within a base configuration, all cycles with the same applied magnetic gradients were grouped in one sequence. The analyzed dataset consists of 99 sequences. The voltage applied to the top electrode was changed periodically: eight cycles at zero volts followed by 48 cycles at kV, with the pattern then being repeated under reversed polarity. During the analysis sequences were split into sub-sequences having polarity patterns of or .
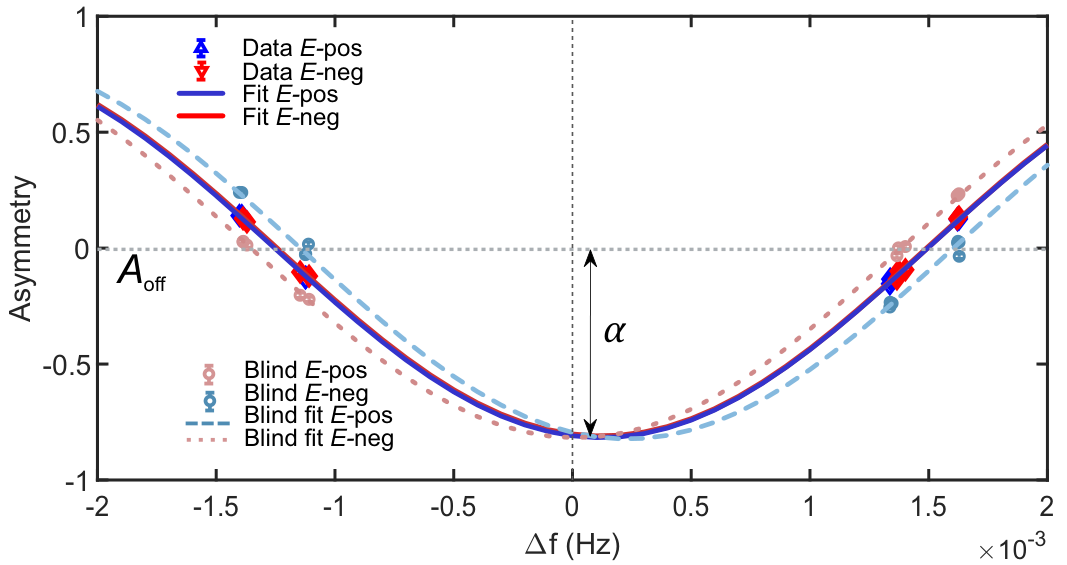
The analysis searched for shifts in the neutrons’ Larmor precession frequency that were proportional to the applied electric field . To determine the neutron frequency for each cycle from the measured asymmetry we fitted the Ramsey resonance
| (2) |
to the data of each sub-sequence (see Fig. 2), with negative (positive) sign for SF1 turned off (on). In Eq. (2) is the resonance linewidth, is the applied spin-flip frequency corrected for magnetic-field changes 11 1 One analysis team has chosen to use and , while the other team used and the phase ., and , , and , are free parameters: offset, fringe visibility, and phase, respectively. Individual values of per cycle were extracted by keeping the fit parameters fixed and rearranging Eq. (2) for .
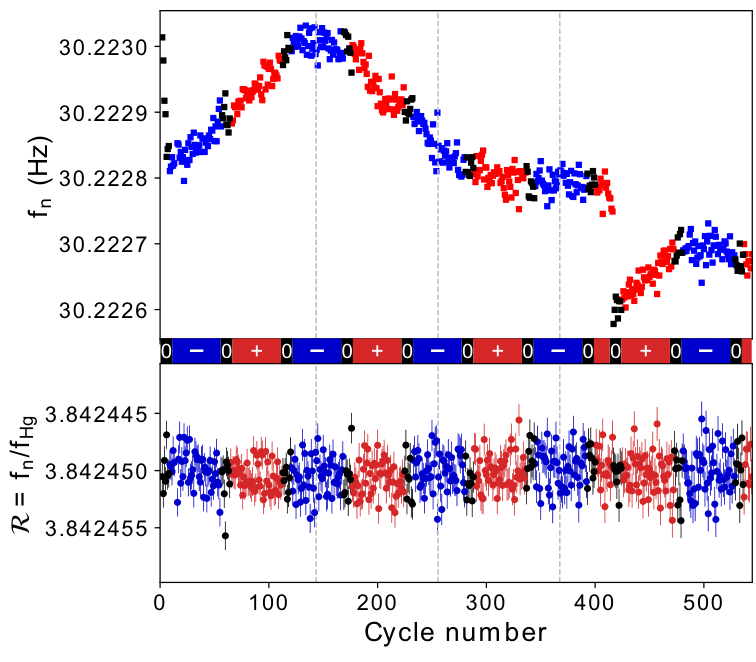
The ratio of frequencies was then used to compensate for residual magnetic-field fluctuations and drifts as shown in Fig. 3. In what follows, the statistical analysis and the evaluation of systematic effects take into account all known effects affecting the ratio . These are summarized in the formula
| (3) | ||||
where the true EDM term is written
| (4) |
and neglecting the index for the following. The EDM, measured to be Graner2016PRL, induces a bias of the EDM term by , which we quote as a global systematic error.
Subsequent terms are undesirable effects that influence the neutron or mercury frequencies. We now discuss them individually.
The gravitational shift induced by the effective vertical magnetic-field gradient is due to the center of mass offset of the UCNs in the chamber. We deduced in an auxiliary analysis from an estimation of the slope by combining the CsM-array readings and offline magnetic-field maps. The static part of induces a shift of the mean value of in a sequence, whereas the fluctuating part induces a drift in within each sub-sequence. This gradient drift is compensated for at the cycle level using a combination of the HgM and the CsMs below the grounded bottom electrode. The CsMs mounted on the top electrode were not included in order to avoid any possible HV susceptibility in their readings.
In each sub-sequence, we extract the EDM signal by fitting the values, compensated for the gradient drift, as a function of time and electric field, and allowing in addition for a linear time drift. This assumes perfect compensation of , and that is the only -field dependent term in Eq. (3). Deviations from this hypothesis are treated as systematic effects.
The dominant systematic effects arise from a shift linear in due to the combination of the relativistic motional field Pendlebury2004 and the magnetic field gradient:
| (5) |
where is the effect of a possible net motion of the UCNs (discussed later) and is due to the the random motion of the UCNs and atoms in a non-uniform magnetic field. The latter is largely dominated by the mercury and is written as Pignol2012PRA; AbelPRA2019:
| (6) |
where is the higher-order gradient term, which does not produce a gravitational shift. We used magnetic-field maps, measured offline, to extract a value of for each sequence and calculate a corrected EDM value . The main contribution in Eq. (6) depending on is then dealt with by the crossing-point analysis, shown in Fig. 4: is plotted as a function of , and we fit two lines with opposite slopes corresponding to the sequences with up and down. At the crossing point we have , and the main systematic effect is canceled. In the fit the free parameters are the coordinates of the crossing point and ; the slope was fixed to the theoretical value . Because of the uncertainty on , the slope has an error that propagates to become an additional error of on . As a check we also considered the slope as a free parameter in the fit and found , in agreement with the values found in Ref. AbelPRA2019.
In order to have at the crossing point we had to correct for all shifts other than the gravitational shift: namely the shift due to Earth’s rotation , and the shift due to transverse fields AbelPRA2019. The transverse shift for each sequence was calculated from the offline magnetic-field maps. The vertical corrections, related to , shifted the crossing point by . The horizontal corrections, related to , shifted the crossing point by .
The corrections for the effect of the magnetic non-uniformities and are based on the mapping of the apparatus without precession chamber, hence possibly missing the contribution of magnetic impurities in the precession chamber. All inner parts were scanned for magnetic dipoles before and after the data taking in the Berlin Magnetically Shielded Room-2 at the Physikalisch Technische Bundesanstalt in Berlin. Initially we verified, that all parts showed no signals above the SQUID system’s detection threshold of ; the second scan revealed a dozen dipoles with a maximum strength of . The corresponding systematic error was evaluated to be .
In addition to the false EDM due to the random motional field , a net ordered motion of the UCN could generate a systematic effect , where is the mean net velocity of the ordered motion orthogonal to and , and is the misalignment angle between the electric and magnetic fields. Three possible sources of ordered motion were identified in the past Pendlebury2015PRD: a vertical motion due to micro heating, and initial transverse and rotational motions that are destroyed by collisions on the wall surfaces. Using the same trap geometry as in Ref. Pendlebury2015PRD and a softer initial UCN spectrum Bison2019b, we use the same value for and . The error from heating was estimated to be , while the error from rotational motion dominates: .
The motional field also induces a shift quadratic in of Pignol2015, where we consider only the (dominant) shift on the mercury frequency. We were able to exclude any possible polarity dependence of the -field magnitude to a level of and therefore state a conservative error of for this effect.
Next, imperfect compensation of the term by the CsMs can lead to a direct systematic effect in case of a correlation between the -field polarity and the magnetic-field uniformity. We evaluated the possible effect by de-activating the gradient drift compensation in both analysis and found mean difference of ; we quote the full shift as a systematic error. Leakage currents could be one source of such a correlation.
The term corresponds to a mercury frequency shift proportional to the power of the UV probe light Cohen-Tannoudji1962. We estimate that the largest shift of this type is at the level of parts per million in our experiment. This can constitute a systematic effect if the power of the probe light is correlated with the polarity of the electric field, which we cannot exclude below the level of . This results in a systematic error of for mercury light shifts.
Ultracold neutrons co-precessing with polarized atoms are exposed to a pseudo-magnetic field Abragam due to a spin-dependent nuclear interaction quantified by the incoherent scattering length NistDataBase. The mercury polarization could have a residual static component in case of an imperfect pulse; this would generate a systematic effect if correlates with the electric-field polarity. We deduced from the photomultiplier signal of the probe beam during the flip. The product was estimated by comparing the ratio of precession amplitude to total light absorption in the -lamp read-out and matching this to a laser measurement to calibrate for a pure light source. The systematic error induced by the term was estimated to be .
Table 1 lists the above-mentioned systematic effects. Additionally, the mercury pulse causes a small tilt of the neutron spin prior to the Ramsey procedure, and is responsible for the shift . This shift is not correlated with the electric field; it behaves as an additional random error, and was accounted for in the statistical analysis. Further effects that were also studied and found to be negligible (smaller than ) include: the effects of AC fields induced by ripple of the high voltage supply; noise of the current supplies, or Johnson-Nyquist noise generated by the electrodes; the movement of the electrodes correlated with electric field; and a correlation of the orientation of the magnetic field with the electric field in combination with the rotation of the Earth.
| Effect | shift | error |
| Error on | - | 7 |
| Higher order gradients | 69 | 10 |
| Transverse field correction | 0 | 5 |
| Hg EDMGraner2016PRL | -0.1 | 0.1 |
| Local dipole fields | - | 4 |
| UCN net motion | - | 2 |
| Quadratic | - | 0.1 |
| Uncompensated G drift | - | 7.5 |
| Mercury light shift | - | 0.4 |
| Inc. scattering | - | |
| TOTAL | 69 | 18 |
During data-taking a copy of the files with the neutron detector data was modified by moving a predefined randomly distributed number of neutrons from one UCN detector to the other (see Fig. 2). This injection of an artificial EDM signal into the data was applied twice, and two datasets with different artificial EDMs were distributed to two distinct analyses groups KrempelEtAl. This double-blind procedure enforced the independence of the two analyses, in particular for the data selection criteria. Once the two analyses had been completed using only double-blind datasets, it was confirmed that they gave consistent results when run on an identical blind dataset. Finally both groups performed their analysis on the original never-blinded dataset. The results of the crossing-point fit are , with and , with .
The small difference between the two results can be explained by the different selection criteria and we take as a final value the midpoint of the two. After adding the extra systematic effects quoted in the second part of Table 1, the final result, separating the statistical and systematical errors, is:
| (7) |
The result may be interpreted as an upper limit of (90% C.L.). This has been achieved through an unprecedented understanding and control of systematic effects in the experiment. In particular, those related to magnetic-field nonuniformity were assessed with dedicated measurements that resulted in a significant correction, equivalent to 60% of the statistical uncertainty, that arose from higher-order magnetic-field gradients. Overall the systematic error has been reduced by a factor of five compared to the previous best result Pendlebury2015PRD.
Acknowledgments
We are profoundly grateful for the fundamental contributions to the field in general and to this project in particular of J.M. Pendlebury, the intellectual giant on whose shoulders we stand, and to K.F. Smith and others also involved with the original development of the nEDM spectrometer with Hg co-magnetometer. We acknowledge the excellent support provided by the PSI technical groups and by various services of the collaborating universities and research laboratories. In particular we acknowledge with gratitude the long term outstanding technical support by F. Burri and M. Meier. We thank the UCN source operation group BSQ for their support. We acknowledge financial support from the Swiss National Science Foundation through projects No. 117696, No. 137664, No. 144473, No. 157079, No. 172626, No. 126562, No. 169596 (all PSI), No. 181996 (Bern), No. 162574 (ETH), No. 172639 (ETH), and No. 140421 (Fribourg). University of Bern acknowledges the support via the European Research Council under the ERC Grant Agreement No. 715031-BEAM-EDM. Contributions of the Sussex group have been made possible via STFC grants ST/M003426/1, ST/N504452/1, and ST/N000307/1. LPC Caen and LPSC Grenoble acknowledge the support of the French Agence Nationale de la Recherche (ANR) under Reference No. ANR-09-BLAN-0046 and the ERC Project No. 716651-NEDM. The Polish collaborators acknowledge support from the National Science Center, Poland, under Grants No. 2015/18/M/ST2/00056, 2016/23/D/ST2/00715 and 2018/30/M/ST2/00319. P.M. acknowledges Grant No. SERI-FCS 2015.0594. This work was also partly supported by the Fund for Scientific Research Flanders (FWO), and Project GOA/2010/10 of the KU Leuven. We acknowledge the support from the DFG (DE) specifically projects BI 1424/2-1 and /3-1. In addition we are grateful for access granted to the computing grid PL-Grid infrastructure.
References
- (1) G. Luders. Mat.-fys. Medd. 28 (1954) 5.
- (2) W. Pauli. Niels Bohr and the Development of Physics Pergamon Press, New York (1955) 30-51.
- (3) G. t’Hooft Phys. Rev. Lett. 37 (1976) 8.
- (4) D. E. Morrissey & M. J. Ramsey-Musolf. New J. Phys. 14 (2012) 125003.
- (5) A. D. Sakharov. JETP Lett. 5 (1967) 24.
- (6) J. Engel, M. J. Ramsey-Musolf, & U. van Kolck. \ppnp71 (2013) 21 .
- (7) V. Andreev et al. [ACME Collaboration], Nature 562 (2018) 355.
- (8) B. Graner, Y. Chen, E. G. Lindahl, & B. R. Heckel. Phys. Rev. Lett. 116 (2016) 161601.
- (9) T. Chupp & M. Ramsey-Musolf. Phys. Rev. C 91 (2015) 035502.
- (10) F. Wilczek. Phys. Rev. Lett. 40 (1978) 279.
- (11) R. D. Peccei & H. R. Quinn. Phys. Rev. Lett. 38 (1977) 1440.
- (12) J. de Swart, G. Bertone & J. van Dongen. Nat. Astron. 1 (2017) 0059.
- (13) C. A. Baker, D. D. Doyle, P. Geltenbort, et al. Phys. Rev. Lett. 97 (2006) 131801.
- (14) C. Baker, Y. Chibane, M. Chouder, et al. \nima 736 (2014) 184.
- (15) J. M. Pendlebury, S. Afach, N. J. Ayres, et al. Phys. Rev. D 92 (2015) 092003.
- (16) C. Abel, N. J. Ayres, G. Ban, et al. EPJ Web Conf. 219 (2019) 02001.
- (17) N. F. Ramsey. Phys. Rev. 78 (1950) 695.
- (18) A. Anghel, F. Atchison, B. Blau, et al. Nucl. Instrum. Methods A 611 (2008) 272.
- (19) B. Lauss. Phys. Proc. 51 (2014) 98.
- (20) F. Atchison, B. Blau, M. Daum, et al. Phys. Lett. B 642 (2006) 24.
- (21) F. Atchison, B. Blau, M. Daum, et al. Phys. Rev. C 74 (2006) 055501.
- (22) K. Bodek, M. Daum, R. Henneck, et al. Nucl. Instrum. Methods A 597 (2008) 222.
- (23) S. Afach, G. Ban, G. Bison, et al. Eur. Phys. J. A 51 (2015) 143.
- (24) G. Ban, G. Bison, K. Bodek, et al. Eur. Phys. J. A 52 (2016) 326.
- (25) C. Abel, S. Afach, N.J. Ayres et al. ArXiv 1912.04631 (2019).
- (26) S. Afach, N. Ayres, C.A. Baker, et al. Phys. Rev. D 92 (2015) 052008.
- (27) J. M. Pendlebury, W. Heil, Y. Sobolev, et al. Phys. Rev. A 70 (2004) 032102.
- (28) G. Pignol & S. Roccia. Phys. Rev. A 85 (2012) 042105.
- (29) C. Abel, N. J. Ayres, T. Baker, et al. Phys. Rev. A 9 (2019) 042112.
- (30) G. L. Greene, N. F. Ramsey, W. Mampe, et al. Phys. Rev. D 20 (1979) 2139.
- (31) B. Cagnac Ann. Phys. 6 (1961) 467.
- (32) G. Bison, M. Daum, K. Kirch, et al. accepted by EPJA, ArXiv 1907.05730 (2019).
- (33) G. Pignol, M. Guigue, A. Petukhov, R. Golub Phys. Rev. A 72 (2015) 053407.
- (34) C. Cohen-Tannoudji Ann. Phys. Paris 13 (1962) 423.
- (35) A. Abragam and M. Goldman Nuclear Magnetism: Order and Disorder, Oxford University Press, Oxford (1982).
- (36) V. F. Sears Neutron News 3 (1992) 29.
- (37) N.J. Ayres, G. Ban, G. Bison et al. ArXiv 1912.09244(2019).