Encounters of Merger and Accretion Shocks in Galaxy Clusters and their Effects on Intracluster Medium2019Encounters of Merger and Accretion Shocks in Galaxy Clusters and their Effects on Intracluster Medium–References
Abstract
Several types/classes of shocks naturally arise during formation and evolution of galaxy clusters. One such class is represented by accretion shocks, associated with deceleration of infalling baryons. Such shocks, characterized by a very high Mach number, are present even in 1D models of cluster evolution. Another class is composed of “runaway merger shocks”, which appear when a merger shock, driven by a sufficiently massive infalling subcluster, propagates away from the main-cluster center. We argue that, when the merger shock overtakes the accretion shock, a new long-living shock is formed that propagates to large distances from the main cluster (well beyond its virial radius) affecting the cold gas around the cluster. We refer to these structures as Merger-accelerated Accretion shocks (MA-shocks) in this paper. We show examples of such MA-shocks in 1D and 3D simulations and discuss their characteristic properties. In particular, (1) MA-shocks shape the boundary separating the hot intracluster medium (ICM) from the unshocked gas, giving this boundary a “flower-like” morphology. In 3D, MA-shocks occupy space between the dense accreting filaments. (2) Evolution of MA-shocks highly depends on the Mach number of the runaway merger shock and the mass accretion rate parameter of the cluster. (3) MA-shocks may lead to the misalignment of the ICM boundary and the splashback radius.
Keywords:
hydrodynamics – shock waves – methods: numerical – galaxies: clusters: intracluster medium1 Introduction
The self-similar spherical collapse model provides an insightful framework for understanding the formation and evolution of galaxy clusters in the expanding Universe (Fillmore & Goldreich 1984; Bertschinger 1985; Adhikari et al. 2014; Shi 2016b). Characteristic sizes of both gaseous and dark matter (DM) components of galaxy clusters naturally co-exist in this model, i.e. the radius of the accretion shock (Birnboim & Dekel 2003) and the splashback radius (More et al. 2015). They coincidentally align with each other () if the gas adiabatic index is (Shi 2016b, see e.g.)11 1 Specifically, the alignment of the and holds when only if the cluster mass accretion rate parameter () is in the range of (Shi 2016b; see the definition of in Section 2)..
However, the evolution of galaxy clusters is more complicated than those one-dimensional (1D) self-similar solutions. Two major processes tend to break the self-similarity (and also spherical symmetry) of galaxy clusters, i.e. active galactic nucleus (AGN) feedback (see e.g. Werner et al. 2019, for a recent review) and cluster mergers (Sarazin 2002, e.g.). The former process perturbs the gas in cluster cores (e.g. ); the latter one, however, could re-distribute both gas and DM on Mpc scales (Ricker 1998; Poole et al. 2006, e.g.). Unlike the prediction of the self-similar model, in cosmological simulations, the accretion shocks are found beyond , and are sometimes even significantly farther outside (e.g. Lau et al. 2015; Schaal et al. 2016; Zinger et al. 2018; see also Walker et al. 2019 for a review). On average, in simulations is throughout the evolution of galaxy clusters (see fig. 1 in Walker et al. 2019). Mergers of galaxy clusters presumably play an important role in this regard.
During the merger process, the cluster splashback radius, as the outermost caustic in the DM density profile, is mainly affected through the change of the gravitational potential of the merging systems. However, due to the collisional nature of the gas, the impact of mergers on accretion shocks is more complicated. One important effect is the encounter of the merger and accretion shocks, which is able to change dramatically the shock radius (Birnboim et al. 2010). Zhang et al. 2019b have demonstrated that the merger shocks could detach from the infalling subclusters that drive them, and propagate to large distances. They could maintain their shock strength or even get stronger when moving in the diffuse intracluster medium (ICM; say the regions between the high-density filaments), where the radial gas density profile is rather steep. In Zhang et al. 2019b, these shocks were called “runaway merger shocks”. On the other hand, galaxy clusters are supposed to frequently experience merger events. For example, the merger rate is a few per halo per unit redshift for the merger mass ratio (Fakhouri & Ma 2008). Therefore, collisions of the merger and accretion shocks could be very common.
From the theoretical point of view, the collision of two 1D shocks is a Riemann problem. Three discontinuities are subsequently formed after the shock interaction, including forward and reverse shocks/rarefactions and a contact discontinuity (CD) in between (Landau & Lifshitz 1959). More specifically, in our problem, the two colliding shocks are: a runaway merger shock with a moderate Mach number (Zhang et al. 2019b) and an accretion shock with high Mach number (Borgani, & Kravtsov 2011, see), respectively. They both move radially outwards in the rest frame of the cluster. In this case, a strong forward shock is formed with Mach number , moving away from the cluster center (Birnboim et al. 2010)22 2 At the same time, a reverse rarefaction wave is formed and moves towards the cluster center, which however is quickly diminished when travelling into the denser ICM region.. In this work, it is referred to as the Merger-accelerated Accretion shock (MA-shock hereafter).
In principle, MA-shocks should naturally appear in all hydrodynamic cosmological simulations if their spatial resolution in the cluster outskirts is high enough to resolve the structures (Miniati et al. 2000; Ryu et al. 2003; Skillman et al. 2008; Vazza et al. 2010; Vazza et al. 2011; Paul et al. 2011; Schaal et al. 2016; Zinger et al. 2016; Ha et al. 2018, see e.g.). These shocks shape atmospheres of galaxy clusters, producing a “blossom-like” morphology (see e.g. fig. 2 in Vazza et al. 2017). By definition, MA-shocks are a subset of the external shocks classified in Ryu et al. 2003, which, however, are expected to behave quite differently from the ordinary accretion shocks. It is therefore worth studying the nature of MA-shocks and their implications in cluster formation. In this work, we argue that most of the time, clusters are encompassed by MA-shocks rather than canonical accretion shocks.
This paper is organized as follows. In Section 2, we illustrate formation of MA-shocks in a 1D cluster model, and explore the evolution of the MA-shock structures and its dependence on the cluster environment. In Section 3, we extend our exploration to full 3-dimensional (3D) cosmological simulations, and make a direct comparison of a 3D cluster with our 1D model. In Section 4, we discuss the impacts of MA-shocks on the ICM and make conclusions.
2 Modelling MA-Shocks
For the purposes of demonstrating the formation of MA-shocks, we performed 1D cosmological simulations in this section. These simulations are similar to those used in Birnboim & Dekel 2003, where both gas and DM components of the Universe are simulated in the cosmological comoving background. The 1D model is computationally fast and isolates the formation of MA-shocks from the much more complicated merger/accretion configurations in 3D (see Section 3 for a comparison of the 1D and 3D simulation results).
Here we briefly describe the numerical method and the initial conditions used in the 1D model (see more details in Appendix A). Our simulations employ a hybrid N-body/hydrodynamic method (Bryan et al. 1995, see e.g.), where Eulerian scheme is used to solve the gas dynamics while the DM is modelled as Lagrangian shells. All our simulations presented in this section start from the redshift . The initial gas and DM density profiles are designed so that the cluster grows in a self-similar way with a constant mass accretion parameter defined as
| (1) |
where is the cluster mass at present and is the cosmic scale factor (Fillmore & Goldreich 1984). We stress that, instead of applying more realistic initial conditions (Birnboim & Dekel 2003, e.g.), our choice helps to understand the relation of the MA-shock evolution and the state of the cluster growth. Our results show that the trajectory of the MA-shock front strongly depends on the value of (see Figs. 4 and 5 below, and Section 2.3 for more discussions). We have also used more sophisticated initial conditions in the 1D simulations in Section 3.2, and directly compare the 1D results with the 3D cosmological simulations.
To generate a MA-shock, an additional “merger” shock is initiated at the cluster center at the moment by suddenly increasing the gas pressure in the innermost cell by a factor of . We vary to obtain “runaway” shocks with different Mach number when they encounter the cluster accretion shock (see Table 1 for a summary of the main parameters used in our simulations). This method has been used and proved to be robust in Zhang et al. 2019b when they studied the propagation of runaway merger shocks in cluster outskirts.
| IDs | 33 3 The cluster mass accretion rate parameter used to set-up the initial gas/DM density profiles. | (Gyr)44 4 The time a blast wave is initiated at the cluster center. No blast wave is included in the runs S1 and S3. | (Gyr)55 5 The time the MA-shock is formed. Its uncertainty is , determined by the time interval between two successive snapshots. | 66 6 The Mach number of the “runaway” shock at the moment just before it encounters the accretion shock. |
| S1 | - | - | - | |
| S1T2M15 | 3.0 | 1.5 | ||
| S1T2M20 | 2.8 | 2.0 | ||
| S1T2M23 | 2.8 | 2.3 | ||
| S1T6M23 | 6.7 | 2.3 | ||
| S3 | - | - | - | |
| S3T2M20 | 2.7 | 2.0 | ||
| S3T2M25 | 2.7 | 2.5 | ||
| S3T6M20 | 7.0 | 2.0 |
2.1 Formation of MA-shocks and their structures
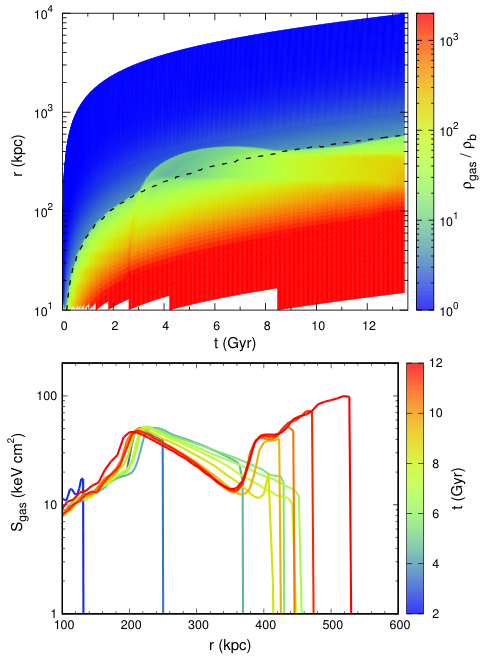
Fig. 1 shows the evolution of the gas density profile in the simulation S1T2M23. The initial accretion shock forms at the very beginning of the simulations once the collapsing gas decouples from the Hubble flow. Since there is no radiative cooling involved in the simulations, the stable gas atmosphere could exist even when the cluster mass is small (cf. Rees & Ostriker 1977; Birnboim & Dekel 2003). A secondary shock is artificially initiated at the cluster center at to mimic a merger shock, which propagates with a high speed in the ICM and rapidly catches up with the accretion shock. As expected, a rarefaction, CD, and MA-shock are formed after the shock collision (marked in the figure; see also Birnboim et al. 2010). Both CD and MA-shock are subsequently decelerated by the inflowing unshocked gas. Their trajectories, however, depend on the environment of the cluster (i.e. mass accretion rate parameter ) and the strength of the MA-shock (cf. Fig. 9; see Section 2.2 for more detailed discussions on these dependence). When the is moderate (like the case shown in Fig. 1), a long time is needed for the MA-shock to re-fall back (even possibly longer than the Hubble time). It is interesting to note that the runaway shock in our model develops an N-shaped wave profile due to its blast-wave nature and the spherical symmetry of the system (Dumond 1946)77 7 A similar N-wave form of the runaway merger shock is also seen in our idealized simulations of the mergers between two galaxy clusters (see the right-most panel in fig. 1 in Zhang et al. 2019b).. The front of the N-wave encounters the accretion shock at . The rear part of the N-wave, however, firstly meets the re-infalling CD at . Its velocity increases significantly after crossing the CD from the cold side to the hot side.

To illustrate the structures associated with the MA-shock more clearly, we zoom in on gas profiles where the MA-shock forms, shown in Fig. 2. We can clearly see the aforementioned rarefaction, CD, and MA-shock in the gas density profiles. The CD separates the low- and high-entropy gas on its two sides. On the left (radii smaller than CD) side the gas is successively compressed and heated by the runaway and accretion shocks, while on the right side (outside CD) the gas passes only through the MA-shock, which has velocity comparable to the merger shock velocity. As a result, the gas density is higher but the temperature is lower on the left side of CD. Therefore, a high-entropy gas shell is formed between the CD and MA-shock, and this shell is a robust signature of the past shock collision.
It turns out that, within this high-entropy shell, the entropy is decreasing with radius. The entropy here is defined as ( and are gas temperature and density, respectively). The gas temperature behind the shock is proportional to , where is the MA-shock velocity, which is a decreasing function of time/radius for a propagating spherical shock (see Fig. 3, and more discussions in Section 2.2). The upstream cold gas density also decreases with the radius, but rather slowly (approximately before entering the ICM; see also fig. 1 in Shi 2016b). The net result of these competing effects is that the gas entropy profile between the CD and MA-shock is a decreasing function of radius (see bottom panels in Figs. 2 and 9).
Given the radially decreasing entropy profile, the high-entropy shell is convectively unstable (even though this instability is not captured in the 1D simulations). We note in passing that the temperature is also decreasing with radius and, therefore, the shell is unstable even when the magnetothermal-instability criterion (Balbus 2000) is used instead of the Schwarzschild one mentioned above. With time, convective motions should kick in and the shell would re-arrange itself to restore the non-decreasing entropy profile. The instability growth rate can be related to the characteristic Keplerian frequency () as , implying that the life-time of MA-shocks is likely shorter than that of the shell. Our estimates show that, given the slope of the entropy profile and its radial extent, the characteristic amplitude of the induced gas motions can be up to , where is the ICM sound speed. This implies that the resulting convection might make an important contribution to the non-thermal pressure in the cluster outskirts (Shi, & Komatsu 2014; Shi et al. 2015, see also).
2.2 Evolution of MA-shocks and their fate
The evolution of MA-shocks shows a very similar behavior to that of a strong blast wave (Ostriker, & McKee 1988, see e.g.). The accreted cold gas on the upstream side strongly decelerates the shocks. The velocity of the MA-shock front in the cluster frame can be represented as a sum of the shock velocity in the rest frame of the upstream gas and the infalling velocity of the upstream gas , i.e.
| (2) |
where is the location of the MA-shocks front. Generally, there are three possible fates for a MA-shock, i.e. (1) it survives until (like the case shown in Fig. 1); (2) it recedes and is eventually replaced with an ordinary accretion shock (like the case shown in Fig. 9); and (3) it is overrun by a new runaway merger shock and is accelerated again. To keep the problem simple, we merely address the first two possibilities in this section, and will discuss the last one in Section 3.
Fig. 3 shows the evolution of the shock velocities of the radially outermost shocks in our simulations. The MA-shocks behave differently from that of the genuine accretion shocks. The latter one follows , where (Fillmore & Goldreich 1984; Shi 2016b). The evolution of MA-shocks, however, is close to a Sedov-Taylor solution, i.e. for not too small , where (Sedov 1959, see). This is not surprising, since the MA-shocks are driven from inside, and have negligible upstream gas pressure. Note that the MA-shocks, when viewed as a function of , go through a transitional stage before approaching the Sedov-Taylor form (i.e. in our simulations), when the shock velocity is changing slowly. This is because, for small , the MA-shocks, which do not start from the cluster center, behave more like plane shock waves rather than spherical ones in their very early phase. In addition, the evolution of MA-shocks is also affected by (1) the gravity, (2) the Hubble expansion, and (3) non-uniform density distribution of the upstream gas, which cause slight deviations of the shock velocity curves from a simple power law. Eventually, some MA-shocks become the accretion shocks again (i.e. the shock velocity curves jump to high values). From the simulations, we find that, the deceleration of the MA-shocks (say the evolution of the shock velocity with time) only mildly depends on its formation time , runaway shock Mach number , and the mass accretion rate parameter . These allow us to model by a very simple form, i.e.
| (3) |
where (slightly steeper than ) and is a free parameter to take the shock transitional stage into account. With this approximation, the integration of Eq. (2) becomes straightforward. The self-similar solution of the spherical collapse model is applied to estimate the gas velocity (Bertschinger 1985; Shi 2016b).
Fig. 4 shows two groups of solutions of Eq. (2) (see Table 2 for the parameters used in the calculations). The line color encodes the Mach number of the runaway shocks just before they encounter the accretion shocks. As a reference, the evolution of the accretion shock radius and the turnaround radius in the self-similar solutions are shown as the black solid and dashed lines. One can see the modelled shock-front trajectories (color solid lines) show a good match with the simulations (dotted lines)88 8 Though not shown in figures, the analytical model matches the results of the simulation runs S1T6M23 and S3T6M20 as well.. The MA-shock could survive for a longer time and reach a larger radius when is smaller and/or the shock Mach number is higher. All the MA-shocks tend to move back to the radius in Fig. 4, even though in some cases the required timescale is longer than the Hubble time. In principle, if strong enough, a MA-shock is able to escape from the halo potential well (e.g. go beyond a few turnaround radii of the halo) and move into a nearly uniform but cosmologically expanding medium. In this case, the shock is described by the cosmological self-similar solution of blast waves found by Bertschinger 1983, where the shock radius evolves as . However, because the Mach number of merger shocks is usually , such a situation must be very rare.
| IDs | 99 9 The mass accretion rate. | (Gyr)1010 10 The moment MA-shock forms. | (kpc)1111 11 The radius where MA-shock forms at . | 1212 12 MA-shock starts to behave in a self-similar way at . | |
|---|---|---|---|---|---|
| G1 | 140 | ||||
| G2 | 120 |
Fig. 5 shows the same results as those in Fig. 4 but with and scaled by the accretion shock radius in the self-similar model and the time when forming the MA-shocks1313 13 Here we only show the results when (see Table 2). But we have compared the models with and , and found the curves show only weak dependence on .. This figure shows that, if , even a moderate runaway merger shock (e.g. ) could easily expand the size of atmospheres of galaxy clusters by a factor of , and the expansion could last for a few . However, when gets larger, it is harder for the MA-shocks to survive for longer time and reach larger cluster radii. The dependence of the upstream gas velocity profile on plays a key role in this result (see Eq. 2). For example, when , the MA-shocks produced by the runaway shocks with could only survive for a time period . Nevertheless, those MA-shocks in galaxy clusters with high would still make a significant impact on the ICM at low redshift (e.g. ).
2.3 Key parameters and shaping MA-shocks
The two parameters – the mass accretion rate and the Mach number of a runaway shock play crucial roles in shaping MA-shocks in our simulations, and are also tightly related with the cluster environment and growth history. In this section, we discuss them in detail.
The mass accretion rate that quantifies the global growth history of galaxy clusters, has been extensively explored in analytical and numerical studies (Zhao et al. 2009; Adhikari et al. 2014; Lau et al. 2015, e.g.). The infalling substructures and filaments contribute a large portion of the accreting mass (see the high peaks in the curves shown in the bottom panel of Fig. 7). However, we have to emphasize that the accretion rate defined there has a different meaning from the one used in our 1D model. Instead of characterizing the mass growth of a whole galaxy cluster, our parameter is used to set-up the matter distribution in the model. Zhang et al. 2019b has argued that prominent runaway merger shocks may only appear in the non-filamentary regions, and so do the MA-shocks. In this sense, the constant applied in our 1D simulations in Section 2 is supposed to represent the non-filamentary environment of the cluster rather than the total mass accretion rate of the cluster integrated over all directions.
Fig. 5 implies that runaway merger shocks with moderate Mach number (e.g. ) are generally required to generate relatively long-lived and significant MA-shocks. However, not all cluster mergers are powerful enough to drive such shocks. For example, one necessary condition is that the infalling subcluster should be sufficiently massive to keep its gas atmosphere after the primary pericentric passage. In this regard, the merger mass ratio is a key factor. We have explored the cluster merger process for a wide range of merger parameters in our previous works (Zhang et al. 2014; Zhang et al. 2016, see e.g.)1414 14 In those works, we simulated mergers between two idealized galaxy clusters, where each of the merging clusters contains spherical gas and DM halos. The initial gas and DM density profiles both follow in the cluster outskirts (see eqs. 1-4 in Zhang et al. 2014). A large merger-parameter space (including the cluster mass, mass ratio, initial relative velocity, and impact parameter) has been explored by those simulations., which provided some intuitions on this question. For example, Zhang et al. 2019a and Lyskova et al. 2019 presented analysis of two merging systems with and zero and large impact parameters respectively. In both cases, the merger shocks could reach the cluster outskirts with Mach number larger than 2. Our merger sample with and zero impact parameter, however, shows that only a weak runaway merger shock (Mach number ) is formed during the merger process. Overall, these results imply that is a reasonable mass-ratio range for cluster mergers to power significant runaway merger shocks. However, we emphasize that, besides the mass ratio, many other factors (like other merger parameters, initial cluster gas/DM profiles) could also affect the conclusion. To fully characterize this problem, more detailed studies need to be carried out in the future. Nevertheless, we suggest that mergers with mass ratio a few 10s would be able to drive runaway merger shocks with , and further excite MA-shocks.
3 MA-Shocks in 3D Cosmological Simulations
Even though MA-shock formation has been well captured in our 1D models, we extend our study of MA-shocks into the 3D simulations in this section for the following reasons. (1) Galaxy clusters gradually become asymmetric at large radii. Giant filaments penetrate into the ICM along some directions. (2) Only a single merger event is considered in our 1D models. But in reality, it is very common for galaxy clusters to experience multiple merger events in a short-time period.
We analyzed a galaxy cluster from the COMPASS1515 15 www.magneticum.org/complements.html#Compass zoom-in simulations. This simulation is a very high resolution re-simulation of the D.17 region as introduced in Bonafede et al. 2011. The cluster’s virial radius and virial mass are and 1616 16 is referred to as the virial radius of the cluster in this work, which encloses an average matter density times higher than the mean matter density of the Universe. is the cluster virial mass within ., respectively. It is simulated using P-Gadget3, a modernized version of P-Gadget2 (Springel 2005), that implements updated smoothed particle hydrodynamic (SPH) formulations regarding the treatment of viscosity and the use of kernels (Dolag et al. 2005; Beck et al. 2016), allowing a better treatment of turbulence within the ICM. It also includes a formulation of isotropic, thermal conduction at 1/20th of the classical Spitzer value (Spitzer 1962). The particle mass for DM and gas is and , respectively, and the softening for both, DM and gas particles is set to . The cluster at redshift is therefore resolved with particles within the virial radius and hosts almost identified substructures, making it to one of the most resolved, cosmological, hydrodynamical simulations of massive galaxy clusters.
3.1 MA-shocks in a 3D cluster
Fig. 6 shows a gas-entropy slice of the galaxy cluster at the redshift . The black solid lines mark the positions of the MA-shocks (or accretion shocks) identified in this map. We exclude the shocks in the direction of filaments, where the shock structures are complicated and are sometimes even pushed inside the virial radius by the strong inflowing gas streams (Zinger et al. 2016). In this figure, we can clearly see a high-entropy shell lying on the downstream side of the shock predicted by our 1D models, which implies that the cluster gas atmosphere is mostly covered by the MA-shocks but not the genuine accretion shocks along the non-filamentary directions.
We further trace the evolution of the averaged radii of the MA-shocks throughout the simulation within three sectors illustrated in Fig. 6. These sectors are selected as they are not affected by the large-scale filaments. The results are shown in the top panel of Fig. 7. One can see that the shock radii are located much beyond the cluster virial radius (black solid line) along all three directions. After (or ), the cluster experiences three-major merger events (merger mass ratio ; see three major peaks in shown in the bottom panel of Fig. 7). The merger mass ratios are , respectively. This merger rate is close to the averaged cluster major merger rate found in Fakhouri & Ma 2008. Thus, our cluster is representative to illustrate the effect of MA-shocks on the ICM for the purpose of this work. During these three mergers, the cluster virial radius shows rapid increases. At the same time, the variations of the MA-shock radii show a temporal correlation with that of the virial radius (also with the merger events). Two rapid increases of the shock radii start at and , which are approximately later than the corresponding mergers. This is generally consistent with the timescale of the merger shock crossing the cluster radius, i.e. . This correlation indicates that the cluster mergers play a dominant role in pushing the shock outwards.

3.2 A direct comparison of 1D and 3D clusters
In this section, we make a direct comparison of the 3D cluster presented in Section 3.1 with our 1D model to further clarify the effect of the mergers on the formation of MA-shocks. Ideally, we need a 1D model that reproduces the growth history of the 3D cluster but suppresses the effect of the merger process on the ICM (i.e. only radial accretion is included). For this purpose, we performed a 1D simulation with a specially designed initial condition. The gas (and/or DM) density, pressure, and velocity radial profiles of the 3D cluster at redshift 1717 17 Specifically, there is no halo structure at this redshift. We select the position of the peak of the strongest perturbation in the snapshot as the origin of the radial profiles. The main progenitor of the present cluster will form here at a later time. are directly used as the corresponding initial gas/DM profiles in the 1D simulation. The bottom panel of Fig. 7 shows a comparison of the parameter measured in the 1D and 3D simulations (here, ; see also Eq. 1). Both curves show a violent growth of the cluster at high redshift . But at lower redshift, the 1D curve becomes relatively smooth. Two prominent merger events appeared in the 3D simulation are absent in the 1D case.
Fig. 8 shows the evolution of the gas density profile in the 1D simulation. Even though only radial accretion is included, the growth of the gas halo is still not smooth. One can see a few high-density shells in the ICM, which are the angularly averaged infalling clumps. They compress the ICM and drive inner shocks inside the halo. As described in Section 2, these inner shocks eventually encounter the accretion shock and expand the cluster shock-heated atmosphere. Nevertheless, this “merger effect” has been much weaker than that in the 3D situation. In other words, mergers and smooth accretion are distinguishable in this regard. As a reference, the black and purple lines in Fig. 8 show the cluster virial radius in the 3D and 1D simulations, respectively. During , the virial radius of the 1D cluster shows a good match with that of the 3D calculation, but becomes smaller when , because of the absence of the two major mergers (see bottom panel in Fig. 7). The averaged shock radius, along the non-filamentary directions of the 3D cluster, is shown as the white line1818 18 Note that this curve is averaged over the entire cluster surface (excluding the filaments) but not only in the plane shown in Fig. 6.. The shock radius in the 1D model is found to be much smaller than this curve throughout the simulation. The (or ) is about and in our 3D and 1D clusters, respectively. The former value is generally consistent with that reported in Walker et al. 2019; and the latter one agrees with that in the self-similar model (Shi 2016b). The mismatch between the 1D and 3D clusters illustrates the importance of cluster mergers on the expansion of the boundary of the ICM through the shock collisions described in Section 2, and also provides a robust way to distinguish the ordinary accretion shocks and MA-shocks in the cosmological simulations and future observations. Furthermore, the DM splashback radius approximately aligns with the shock radius in our 1D simulation, i.e. 1919 19 However, it is not a trivial task to measure the splashback radius for an individual 3D cluster because of the complicated merger and accretion configurations (Mansfield et al. 2017).. It is interesting to note that both 3D cosmological simulations and the self-similar model show that depending on the mass accretion rate parameter (; see Lau et al. 2015; More et al. 2015; Mansfield et al. 2017 and also Shi 2016a). The mergers and radial accretion play similar roles in changing , which are quite different from that for the shock radii. This fact explains the misalignment between the shock and splashback radii in galaxy clusters.

4 Conclusion and Discussion
In this work, we have explored the encounter of the merger and accretion shocks in galaxy clusters through the 1D and 3D cosmological simulations. As one of the key players, the runaway merger shocks usually exist in the diffuse gas between the high-density filaments (Zhang et al. 2019b, see). During the shock collisions, merger-accelerated accretion shocks (MA-shocks) are formed and quickly propagate to larger cluster radii. A notable signature of the shock collisions is that high-entropy shells are generated in between the MA-shock fronts and the CDs (see Fig. 2). These entropy structures further excite hydrodynamic instabilities and contribute to the non-thermal pressure in the cluster outskirts. Generally, the same type of MA-shocks should be present for a wide range of halo masses, provided that radiative cooling does not affect the gas and a hot atmosphere forms naturally. Basically, genuine accretion shocks should be present only during relatively quiescent periods of the halo evolution, while, long after each significant merger, the “outer” shocks would be located far outside the virial radius (between the filaments) and would be powered by the merger rather than by accretion.
The evolution of the MA-shocks depends on the Mach number of the runaway merger shocks and the cluster mass accretion rate parameter . We found that, the MA-shock fronts could reach very large cluster radii (i.e. times larger than those of the ordinary accretion shocks; see Fig. 5) if and . These conditions imply that MA-shocks are not rare in galaxy clusters and could make strong impacts on the ICM. As the MA-shock fronts represent the outer boundaries of the ICM, the cluster gas atmospheres are prominently expanded after the shock collision. The formation of MA-shocks thus provides a natural explanation for the misalignment of the shock radii and the splashback radii found in the cosmological simulations (Lau et al. 2015, e.g.).
Since the MA-shocks always reside beyond the cluster virial radius , it is a big challenge to detect them through their X-ray signals. The Sunyaev-Zel’dovich (SZ) effect, which linearly scales with the integrated electron pressure, provides a unique opportunity to probe the hot but low-density ICM in cluster outskirts (Hurier et al. 2019). However, we have to note that, in the cluster outer region, the electron-ion equilibrium timescale could be very long (e.g. a few or even longer; see Avestruz et al. 2015). The non-equilibrium electrons would blur the imprints of MA-shocks on the cosmic microwave background (CMB). Nevertheless, given the nature of collisionless shocks, MA-shocks are ideal targets for the next generations of the X-ray and SZ instruments (e.g. ; see Mushotzky et al. 2019; Vikhlinin 2019) to explore the plasma physics of the ICM, e.g. magnetothermal instabilities, acceleration mechanisms of cosmic rays.
Furthermore, MA-shocks are expected to play an important role in boosting radio emissivity of fossil relativistic electrons beyond the cluster virial radius (Enßlin et al. 1998; Enßlin & Gopal-Krishna 2001; Lyskova et al. 2019; Zhang et al. 2019b). First, MA-shocks pass through a very large volume of the intergalactic medium (IGM). The swept gas (also the fossil electrons) tends to accumulate behind the shock fronts (see top panel of Fig. 2). Secondly, the low-efficiency issue of diffuse shock acceleration (DSA) in merger shocks is not a problem for the MA-shocks any more (see van Weeren et al. 2019, and references therein). The MA-shocks’ Mach number could reach a few tens to hundreds depending on the pre-heating process of the IGM.
Acknowledgments
The simulations performed at the Leibniz-Rechenzentrum are under the project pr86re. KD acknowledges support by the Deutsche Forschungsgemeinschaft (DFG, German Research Foundation) under Germany’s Excellence Strategy - EXC-2094 - 390783311. EC acknowledges partial support by the Russian Science Foundation grant 19-12-00369. WF acknowledges support from the Smithsonian Institution and the High Resolution Camera program, part of the Chandra X-ray Observatory Center, which is operated by the Smithsonian Astrophysical Observatory for and on behalf of the National Aeronautics Space Administration under contract NAS8-03060. IZ is partially supported by a Clare Boothe Luce Professorship from the Henry Luce Foundation.
Appendix A 1D Cosmological Simulations
Our 1D cosmological simulation traces the evolution of both gas and DM in the self-gravitational field. A second-order piecewise-parabolic method (PPM) is applied to solve the Euler equations of the gas (Fryxell et al. 2000) on a 1D spherical grid. The DM is however modelled as a series of collisionless shells, which are advanced in time through the leapfrog scheme (Ricker et al. 2000). In each time step, the DM shells are mapped to the grid to update the gravitational potential felt by the gas.
In all our simulations listed in Table 1, we used gas cells and DM shells. To simultaneously reach a high spatial resolution for the cluster and suppress the boundary effect on the large-radius side, we arranged 160 cells uniformly to cover the innermost comoving kpc (ckpc), and the remaining 40 cells to cover in the logarithmic scale2020 20 In Section 3.2, we present a special 1D simulation, which is used to compare with the 3D cosmological simulation directly. In this simulation, we used gas cells and DM shells. The size of the computational domain reaches . The cosmological parameters adopted in this run are the same as those used in the 3D simulation (different from other 1D simulations presented in this paper).. All cells contain the same number of DM shells in the initial condition. We set the initial gas and DM density profiles so that the cluster grows with a constant mass accretion rate (see Eq. 1). Meanwhile, both DM and gas have zero initial velocity. All these simulations start from redshift . We assumed a flat CDM cosmology model with , , , and in the calculation. The results of the simulations S1 and S3 show good match with the self-similar solutions (Fillmore & Goldreich 1984). We have also checked the convergence of our simulations in the spatial and mass resolutions. The run with the doubled numbers of gas cells and DM shells shows generally consistent results with those of the low-resolution run, but the excited discontinuities get sharper.
References
- Adhikari et al. (2014) Adhikari, S., Dalal, N., & Chamberlain, R. T. 2014, J. Cosmology Astropart. Phys., 2014, 019
- Avestruz et al. (2015) Avestruz, C., Nagai, D., Lau, E. T., et al. 2015, ApJ, 808, 176
- Balbus (2000) Balbus, S. A. 2000, ApJ, 534, 420
- Beck et al. (2016) Beck, A. M., Murante, G., Arth, A., et al. 2016, MNRAS, 455, 2110
- Bertschinger (1983) Bertschinger, E. 1983, ApJ, 268, 17
- Bertschinger (1985) Bertschinger, E. 1985, ApJS, 58, 39
- Birnboim & Dekel (2003) Birnboim, Y., & Dekel, A. 2003, MNRAS, 345, 349
- Birnboim et al. (2010) Birnboim, Y., Keshet, U., & Hernquist, L. 2010, MNRAS, 408, 199
- Bonafede et al. (2011) Bonafede, A., Dolag, K., Stasyszyn, F., et al. 2011, MNRAS, 418, 2234
- Borgani, & Kravtsov (2011) Borgani, S., & Kravtsov, A. 2011, Advanced Science Letters, 4, 204
- Bryan et al. (1995) Bryan, G. L., Norman, M. L., Stone, J. M., et al. 1995, Computer Physics Communications, 89, 149
- Dolag et al. (2005) Dolag, K., Vazza, F., Brunetti, G., et al. 2005, MNRAS, 364, 753
- Dumond (1946) Dumond, J. W. M. 1946, Acoustical Society of America Journal, 18, 97
- Enßlin et al. (1998) Enßlin, T. A., Biermann, P. L., Klein, U., et al. 1998, A&A, 332, 395
- Enßlin & Gopal-Krishna (2001) Enßlin, T. A., & Gopal-Krishna 2001, A&A, 366, 26
- Fakhouri & Ma (2008) Fakhouri, O., & Ma, C.-P. 2008, MNRAS, 386, 577
- Fillmore & Goldreich (1984) Fillmore, J. A., & Goldreich, P. 1984, ApJ, 281, 1
- Fryxell et al. (2000) Fryxell, B., Olson, K., Ricker, P., et al. 2000, ApJS, 131, 273
- Ha et al. (2018) Ha, J.-H., Ryu, D., & Kang, H. 2018, ApJ, 857, 26
- Hurier et al. (2019) Hurier, G., Adam, R., & Keshet, U. 2019, A&A, 622, A136
- Landau & Lifshitz (1959) Landau, L. D., & Lifshitz, E. M. 1959, Course of theoretical physics.
- Lau et al. (2015) Lau, E. T., Nagai, D., Avestruz, C., Nelson, K., & Vikhlinin, A. 2015, ApJ, 806, 68
- Lyskova et al. (2019) Lyskova, N., Churazov, E., Zhang, C., et al. 2019, MNRAS, 485, 2922
- Mansfield et al. (2017) Mansfield, P., Kravtsov, A. V., & Diemer, B. 2017, ApJ, 841, 34
- Miniati et al. (2000) Miniati, F., Ryu, D., Kang, H., et al. 2000, ApJ, 542, 608
- More et al. (2015) More, S., Diemer, B., & Kravtsov, A. V. 2015, ApJ, 810, 36
- Mushotzky et al. (2019) Mushotzky, R., Aird, J., Barger, A. J., et al. 2019, BAAS, 51, 107
- Ostriker, & McKee (1988) Ostriker, J. P., & McKee, C. F. 1988, Reviews of Modern Physics, 60, 1
- Paul et al. (2011) Paul, S., Iapichino, L., Miniati, F., Bagchi, J., & Mannheim, K. 2011, ApJ, 726, 17
- Poole et al. (2006) Poole, G. B., Fardal, M. A., Babul, A., et al. 2006, MNRAS, 373, 881
- Rees & Ostriker (1977) Rees, M. J., & Ostriker, J. P. 1977, MNRAS, 179, 541
- Ricker (1998) Ricker, P. M. 1998, ApJ, 496, 670
- Ricker et al. (2000) Ricker, P. M., Dodelson, S., & Lamb, D. Q. 2000, ApJ, 536, 122
- Ryu et al. (2003) Ryu, D., Kang, H., Hallman, E., et al. 2003, ApJ, 593, 599
- Sarazin (2002) Sarazin, C. L. 2002, Merging Processes in Galaxy Clusters, 1
- Sedov (1959) Sedov, L. I. 1959, Similarity and Dimensional Methods in Mechanics, New York: Academic Press, 1959
- Schaal et al. (2016) Schaal, K., Springel, V., Pakmor, R., et al. 2016, MNRAS, 461, 4441
- Shi, & Komatsu (2014) Shi, X., & Komatsu, E. 2014, MNRAS, 442, 521
- Shi et al. (2015) Shi, X., Komatsu, E., Nelson, K., et al. 2015, MNRAS, 448, 1020
- Shi (2016a) Shi, X. 2016a, MNRAS, 459, 3711
- Shi (2016b) Shi, X. 2016b, MNRAS, 461, 1804
- Skillman et al. (2008) Skillman, S. W., O’Shea, B. W., Hallman, E. J., et al. 2008, ApJ, 689, 1063
- Spitzer (1962) Spitzer, L. 1962, Physics of Fully Ionized Gases
- Springel (2005) Springel, V. 2005, MNRAS, 364, 1105
- van Weeren et al. (2019) van Weeren, R. J., de Gasperin, F., Akamatsu, H., et al. 2019, Space Sci. Rev., 215, 16
- Vazza et al. (2010) Vazza, F., Brunetti, G., Gheller, C., et al. 2010, New Astron., 15, 695
- Vazza et al. (2011) Vazza, F., Dolag, K., Ryu, D., et al. 2011, MNRAS, 418, 960
- Vazza et al. (2017) Vazza, F., Jones, T. W., Brüggen, M., et al. 2017, MNRAS, 464, 210
- Vikhlinin (2019) Vikhlinin, A. 2019, BAAS, 51, 30
- Walker et al. (2019) Walker, S., Simionescu, A., Nagai, D., et al. 2019, Space Sci. Rev., 215, 7
- Werner et al. (2019) Werner, N., McNamara, B. R., Churazov, E., et al. 2019, Space Sci. Rev., 215, 5
- Zhang et al. (2014) Zhang, C., Yu, Q., & Lu, Y. 2014, ApJ, 796, 138
- Zhang et al. (2016) Zhang, C., Yu, Q., & Lu, Y. 2016, ApJ, 820, 85
- Zhang et al. (2019a) Zhang, C., Churazov, E., Forman, W. R., et al. 2019a, MNRAS, 482, 20
- Zhang et al. (2019b) Zhang, C., Churazov, E., Forman, W. R., et al. 2019b, MNRAS, 488, 5259
- Zhao et al. (2009) Zhao, D. H., Jing, Y. P., Mo, H. J., et al. 2009, ApJ, 707, 354
- Zinger et al. (2016) Zinger, E., Dekel, A., Birnboim, Y., Kravtsov, A., & Nagai, D. 2016, MNRAS, 461, 412
- Zinger et al. (2018) Zinger, E., Dekel, A., Kravtsov, A. V., et al. 2018, MNRAS, 475, 3654