Solar-Metallicity Gas in the Extended Halo of a Galaxy at 2019Solar-Metallicity Gas in the Extended Halo of a Galaxy at –References
Abstract
We present the detection and analysis of a weak low-ionization absorber at along the blazar sightline PG , using spectroscopic data from both /COS and STIS. The absorber is a weak Mg ii analogue, with incidence of weak C ii and Si ii, along with multi-component C iv and O vi. The low ions are tracing a dense ( cm-3) parsec scale cloud of solar or higher metallicity. The kinematically coincident higher ions are either from a more diffuse ( cm-3) photoionized phase of kiloparsec scale dimensions, or are tracing a warm (T K) collisionally ionized transition temperature plasma layer. The absorber resides in a galaxy overdense region, with 18 luminous ( L*) galaxies within a projected radius of 5 Mpc and km s-1 of the absorber. The multi-phase properties, high metallicity and proximity to a galaxy, at kpc and km s-1 separation, favors the possibility of the absorption tracing circumgalactic gas. The absorber serves as an example of weak Mg ii-O vi systems as a means to study multiphase high velocity clouds in external galaxies.
Keywords:
quasars: absorption lines – galaxies: haloes – galaxies: evolution1 Introduction
Much of our knowledge of the gaseous halos of galaxies has come from quasar absorption line observations (see reviews by Putman et al. 2012, Tumlinson et al. 2017). The extended gaseous environment is best studied in the case of the Milky Way through observations of intermediate and high velocity clouds (IVCs, and HVCs), which are multiphase gas clouds moving through the hot halo of the Galaxy (e.g., Wakker & van Woerden 1997, Putman et al. 2003b, Savage & Wakker 2009, Richter et al. 2017, Bish et al. 2019). Along with being baryon-rich, these clouds that occupy the halo are also tracers of inflow and outflow processes that transport material between the star-forming disk and the intergalactic medium outside of the virial bounds of the galaxy.
Measuring the chemical abundances, ionization conditions, kinematics, and spatial distribution of these circumgalactic clouds is the most effective way to identify the gas accretion and feedback processes operating through the CGM of galaxies. For the Milky Way, such detailed insights through multiple sightline observations through the halo have lead to the understanding of the circumgalactic clouds having a variety of origins. The metal-rich clouds, most of which are at intermediate velocities of km s-1 km s-1 relative to the LSR, are presumed to be interstellar gas expelled from the disk as galactic fountains powered by supernova events (Shapiro & Field 1976, Bregman 1980, Norman & Ikeuchi 1989, Houck & Bregman 1990, Richter et al. 2001c, Sarkar et al. 2017). The spatially extended streams of sub-solar and higher metallicity gas in the halo are known to be gas tidally displaced from dwarf satellites (Lu et al. 1998, Sembach et al. 2001), whereas the metal poor pristine material is thought to be gas accreted from the intergalactic medium (Wakker et al. 1999, Sembach et al. 2004). Accurate estimation of chemical abundances for a wide range of elements has been a crucial piece of information in establishing these origins for the population of IVCs and HVCs (Wakker et al. 1999, Richter et al. 2001a, Richter et al. 2001b, Collins et al. 2003, Tripp et al. 2003, Sembach et al. 2004, Fox et al. 2005, Fox et al. 2010).
Ionization models of gaseous halos have also given deep insights on the multiphase complexity of the Circumgalactic Medium (CGM). Once again, in the case of the Milky Way, such models constrained by a mix of low (C ii, Mg ii, Si ii, and Fe ii), intermediate (C iii, O iii, Si iii, and O iv) and high ions (C iv, Si iv, N v and O vi), have offered information on the temperature, pressure and densities in these clouds, and have also indirectly established the presence of a fully ionized and hot ( K) corona enveloping the Galaxy, which is otherwise hard to detect (e.g., Savage & de Boer 1979, Savage & de Boer 1981, Sembach & Savage 1992, dnSavage et al. 1997, Wakker et al. 2003, Sembach et al. 2003, Fox et al. 2003). Identifying intervening absorbers that are close analogues of Milky Way HVCs is an important step in capturing baryon inflows, outflows and recycling in external galaxies (see Schulman et al. 1997a, Schulman et al. 1997b, Schulman et al. 1996 and Swaters et al. 1997 for examples). The weak Mg ii class of quasar absorption systems at have previously been proposed as proxies of high velocity gas in the CGM of other galaxies (Rigby et al. 2002, Milutinović et al. 2006, Narayanan et al. 2008, Richter et al. 2009, Muzahid et al. 2018).
The weak low ionization absorbers, traditionally characterized based on the rest-frame equivalent width of the Mg ii transition being Å, are unique in many ways. To begin with, unlike the strong Mg ii systems which are statistically consistent with being Lyman limit systems tracing the disks of luminous () galaxies (Churchill et al. 1999, Kacprzak et al. 2008, Gauthier et al. 2009, Bordoloi et al. 2011, Churchill et al. 2013), the weak absorbers are found to be optically thin in neutral hydrogen with metal lines that are unsaturated (e.g. Churchill et al. 1999). The metallicity of the low ionization gas, where the Mg ii absorption arises, typically has values greater than one-tenth solar. In many cases the best constraints are as high as ten times solar (Rigby et al. 2001, Charlton et al. 2003, Misawa et al. 2007, Narayanan et al. 2008). The high metallicities imply that these absorbers should be associated with galaxies or more generally environments that are enriched by feedback from star formation.
In the handful of studies that have explored the association of weak Mg ii absorbers with galaxies, one or more luminous galaxies () have been found within kpc of impact parameter of the absorber (Churchill et al. 2005, Nielsen et al. 2013), although the association with galaxies is not as firmly established as it is for strong Mg ii systems. Based on a census of weak absorbers at using /COS data (COS-WEAK survey), Muzahid et al. 2018 estimated a covering fraction of % for these absorbers in the CGM of galaxies brighter than , with a possible increase in covering fraction around higher luminosity galaxies (Nielsen et al. 2013). Interestingly, this is comparable to the covering fraction of neutral HVCs as traced using Ca ii in the extended halo of the Milky Way (Ben Bekhti et al. 2008, Ben Bekhti et al. 2012), pointing to the weak Mg ii absorbers as higher redshift counterparts of Milky Way HVCs. The identification of a population of low ionization clouds in the Milky Way halo by Richter et al. 2009 with cm-2 (and therefore undetected in 21 cm emission), with associated weak absorption from C ii, Mg ii, Si ii, and Ca ii further supports this idea.
A way to examine this further is to compare the ionization structure in weak Mg ii absorbers with Milky Way HVCs. Galactic HVCs are found to have a multiphase structure with a dense and parsec scale neutral gas phase, as well as a highly ionized diffuse kiloparsec scale component detected through C iv and O vi absorptions in the spectra of UV-bright background sources (Sembach et al. 2000, Murphy et al. 2000, Sembach et al. 2003, Wakker et al. 2003, Collins et al. 2004, Fox et al. 2004, Collins et al. 2005, Ganguly et al. 2005, Fox et al. 2005, Fox et al. 2006). Whereas the low ionization lines are found to be consistent with an origin in photoionized gas with K, the high ions (C iv, and O vi) are best understood to be produced through collisional ionization in gas with warm-hot temperatures of K. Shull et al. 2009 used the widespread detection of Si absorption in the low Milky Way halo to arrive at high infall rates ( M) for the Galactic HVCs and IVCs. Through pure photoionization models they inferred metallicities of less than a tenth of solar for such gas, but highlighted the large errors in the derived abundances and the possibility of unraveling hot collisionally ionized phases in such extraplanar clouds by bringing in absorption from other elements such as carbon. Such collisionally ionized gas can occur in conductive interface and/or turbulent mixing layers that form at the boundary of neutral high velocity clouds and the ambient hot coronal envelope of the Galaxy (Borkowski et al. 1990, Fox et al. 2004, Fox et al. 2005, Kwak et al. 2015). If some of the weak Mg ii absorbers are high redshift HVC analogs, then they should exhibit a similar multiphase structure while tracing the CGM of the galaxy coincident with the absorption.
In this work, we present an intervening weak low ionization metal line absorber at in the line of sight towards the blazar PG , using spectroscopic data from both the COS and STIS instruments aboard the . This weak Mg ii analog (based on the weak C ii and Si ii detections) shows strong multi-component C iv and O vi similar to multiphase HVCs. The absorber was featured in the COS-WEAK survey of Muzahid et al. 2018, where based on modelling of just the low ionization phase, solar or supersolar metallicity was suggested. In addition to examining this conclusion, we also investigate the properties of the high ionization gas in this absorber through photoionization, collisional ionization, and hybrid models that incorporate both photoionization and collisional ionization with constraints provided by a wide range of elements. We also incorporate information on galaxies in the absorber’s vicinity, and across a wider field using data from the SDSS.
In Section 2, we describe the /COS and STIS archival data that have been used for this work. Section 3 presents measurements of the lines associated with the absorber. The photoionization and hybrid models are discussed in Section 4. In Section 5 we present results from a search for SDSS galaxies in the environment centered on the absorber. A summary of the key results of the work and our conclusions on the astrophysical origin of the absorber are given in Section 6. Throughout this work we have adopted a flat CDM cosmology with H0 = 69.6 km s-1 Mpc-1, = 0.286, and = 0.714 (Wright 2006, Bennett et al. 2014).
2 Observations
PG , with an emission redshift of (Rovero et al. 2016), is one of the most distant blazars known. The target was observed by /COS in as part of a program (ID. ) to study weak intergalactic absorption towards blazars (PI. John Stocke). The COS spectral integrations were done with G130M and G160M gratings for ks, and ks respectively. We used the coadded version of the COS spectrum from the Spectroscopic Legacy Archive 11 1 https://archive.stsci.edu/hst/spectral_legacy/ (Peeples et al. 2017) for our analysis. The coadded spectrum retrieved from the archive had pixels per km s-1 resolution element of COS, which was rebinned to the Nyquist sampling rate. The rebinned spectrum carries a per resolution element over the wavelength range of Å, with the best between Å where the cumulative exposure time was highest. The blazar was also observed in with the STIS E230M grating (ID. , PI. Amy Furniss). The STIS separate exposures were downloaded from the MAST archive, and combined using the COADSTIS routine (Cooksey et al. 2008). The final STIS spectrum, with a total integration time of ks, spans the wavelength range Å at resolution of FWHM km s-1. The of the STIS data is significantly lesser than expected, a possible explanation for which is that the source could have gone into a low state when the observations were carried out.
3 DATA ANALYSIS
The absorber has H i, C ii, Si ii, Si iii, C iv, and O vi detected with significance. The adopted redshift is based on the centroid of the narrow Si ii line. The absorber is sufficiently displaced from the background AGN such that it is safe to assume it is intervening rather than intrinsic to the quasar. The continuum normalized velocity plot is shown in Figure 1. The C iv lines clearly suggest absorption from at least two different components. A simultaneous Voigt profile fit to the C iv doublets decompose the absorption into components at km s-1 and km s-1 (we refer to these as the central and the offset components). The Voigt profile fit results are listed in Table 1. The fitting models were computed using the Fitzpatrick & Spitzer 1997 routine after convolving the model profiles with the appropriate COS line spread functions22 2 http://www.stsci.edu/hst/cos/performance/spectral_resolution/. We refer to these two components as clouds since they are kinematically distinct, and thus also spatially distinct with possible differences in metallicity, density and temperature.
Coincident with the central component is absorption in C ii, Si ii and Si iii at a significance of . The low ionization C ii and Si ii lines are very weak and only detected for this central cloud. Although the combined wavelength range of the G130M and G160M gratings does not offer coverage of Mg ii absorption lines for this absorber, lower ionizations lines such as C ii and Si ii can be used as proxies for tracing low-ionization gas because of their similar ionization potentials (Narayanan et al. 2005, Muzahid et al. 2018). The rest-frame equivalent widths of mÅ and mÅ make this absorber a weak Mg ii analog (Narayanan et al. 2005). The equivalent widths for all transitions, in the rest-frame of the absorber, are given in Table 2. For all the lines, we have computed the integrated column densities using the AOD method developed by Savage & Sembach 1991, as reported in Table 2. While in the case of relatively strong lines such as C iv and O vi , the apparent optical depth (AOD) derived column densities are in agreement with the column densities derived from profile-fitting, for the much weaker detections (Si ii, Si iii and C ii), the profile-fitted values are dex higher than the column densities obtained by integrating the AOD. The difference, which is within the cumulative uncertainty between the two measurements, possibly stems from the low ionization lines being very weak. In the ionization models of Section 4, we have adopted the AOD-derived column density values for Si ii, Si iii and C ii, as the AOD measurements are more conservative, taking into account the uncertainty in continuum placement in addition to the statistical uncertainty in flux values. The C and Si abundances would come out as dex higher if the profile-fit column densities for their respective low ions are used. The C ii absorption feature appears slightly broader in comparison to Si ii and Si iii, which must be arising from the same phase. We attempted profile-fitting C ii by fixing the line centroid and -parameter of C ii to the same values as Si ii, which resulted in a column density of , which again is within the 1-sigma uncertainty of the free-fit measurement. The [C/H] abundance derived from the AOD column density is therefore, at worst, a lower limit.
The Ly line falls in a relatively higher region of the spectrum, but is strongly saturated. The H i absorption spans the same velocity range as C iv and O vi. A large kinematic spread for the high ions with a correspondingly broad H i in contrast with the narrow widths of low ions is characteristic of many weak absorbers and has been the basis for their proposed filamentary or sheet-like geometry (Milutinović et al. 2006). For the H i component information we rely on Ly where the saturation is mild or absent at velocities away from the core absorption. Driven by the two component kinematics of C iv, we applied simultaneous fits to the Ly and Ly lines with two components. In such a free fit, the routine recovered H i absorption at velocities close to the components seen in C iv. The low ionization gas also contributes to the bluer component through C ii, Si ii and Si iii absorption.
The O vi also shows absorption in two kinematically distinct clouds. Their centroids derived from profile fitting are offset from C ii, Si ii, C iv and H i absorption by km s-1 in both components. (see Table 1 and Figure 2). The difference is only slightly more than the typical residual wavelength calibration errors of km s-1 estimated for COS spectra (Savage et al. 2014). Since the O vi absorption spans the same velocity range as C iv, it is possible that the two ions are tracing the same gas phase, or different gas phases that are kinematically intertwined. Such offsets could be due to differences in the velocity fields across the absorbing region, especially when it is extended (Churchill et al. 2015). Even if the C iv and O vi are tracing intrinsically different gas phases, it is difficult to segregate their separate contributions in these adjacent absorptions. Thus, while exploring ionization models, we consider the C iv and O vi as tracing the same gas. However, we do note that in many stronger metal line systems, C iv and O vi are inferred to be from different phases of high ionization gas (Fox et al. 2007; Lehner et al. 2008, e.g.,).
Both members of the O vi doublet suffer varying levels of contamination over some limited velocity ranges of their profiles. The Å line is contaminated from km s-1 to km s-1 by Ly at . From modeling the Ly associated with this interloper, we estimate the extent of contamination (see Figure 1). The residual absorption, after removing the contamination, suggests the presence of O vi accompanying the central C iv component as well, consistent with the O vi at that same velocity. The O vi shows excess absorption over the velocity range km s-1, which we could not associate with absorption from any known metal line system along this sight line. The wavelength bins affected by contamination were not included during Voigt profile modeling of the O vi doublet lines. The -values of C iv and O vi set an upper limit on temperature of K, and K for the high ionization gas in the central and offset components respectively, whereas their uncertainties suggest that the gas can be hotter with K, and K respectively.
Alternatively, one could also use the H i-C iv and H i-O vi to get an ionization-model independent estimate of the temperature. However, one has to be cautious in doing so for a multiphase medium. Absorption line analysis of synthetic spectra derived from simulations with sub-kiloparsec scale resolutions show that metal ions in their high ionization states may not be associated with the observed H i even when they appear as coinciding in velocity space, which in turn adds a systematic bias to the temperature and metallicity estimates (Oppenheimer & Davé 2009, Churchill et al. 2015, Liang et al. 2018). Considering this, a more secure upper limit measurement for the temperature would be from the -parameter range for the C iv and O vi, as these are ions which tend to probe the same phase.
| Line | (km s-1) | log | (km s-1) | Component |
|---|---|---|---|---|
| H i | Central | |||
| Offset | ||||
| C iv | Central | |||
| Offset | ||||
| O vi | Central | |||
| Offset | ||||
| C ii | Central | |||
| Si ii | Central | |||
| Si iii | Central |
Comments - The absorption lines were fitted with Voigt profiles using the Fitzpatrick & Spitzer 1997 routine. The models were convolved with the empirically determined COS line-spread functions of Kriss 2011 at the redshifted wavelength of each line. (a) The O vi line is blended with Ly- absorption from (confirmed by the presence of corresponding Ly ). The contamination has affected the blue part of the O vi feature in the manner shown in Figure 1. Pixels beyond km s-1 were therefore deweighted during profile fitting. We found that shifting this velocity alters the -parameter significantly. The value given by the fitting routine does not account for the systematic uncertainty. Taking this contamination also into account, a more realistic measurement should be km s-1. The uncertainty in the corresponding column density is within the error given by the profile fitting routine.
| Line | (mÅ) | log | (km s-1) | Component |
|---|---|---|---|---|
| H i | [-100, 200] | Central | ||
| H i | [-100, 200] | Offset | ||
| C iv | [-60, 35] | Central | ||
| [35, 100] | Offset | |||
| C iv | [-60, 35] | Central | ||
| [35, 100] | Offset | |||
| O vi | [-60, 35] | Central | ||
| [35, 160] | Offset | |||
| O vi | [-60, 35] | Central | ||
| [35, 160] | Offset | |||
| Si iii | [-40, 17] | Central | ||
| [35, 100] | Offset | |||
| C ii | [-20, 15] | Central | ||
| [35, 100] | Offset | |||
| Si ii | [-20, 15] | Central | ||
| [35, 100] | Offset | |||
| Si ii | [-20, 15] | Central | ||
| [35, 100] | Offset | |||
| Si iv | [-60, 100] | Central | ||
| N v | [-60, 100] | Central | ||
| Al ii | [-60, 100] | Central | ||
| Al iii | [-60, 100] | Central | ||
| Al iii | [-60, 100] | Central |
Comments - The various columns list the equivalent width of the lines in the rest-frame of the absorber, the integrated apparent column density, and the velocity range for the integration. The upper limits correspond to lines which are not detected at significance. The lower limits for H i column density indicate that those transitions are heavily saturated. The O vi is contaminated by Ly- absorption from at the blue end. Hence the measurement here is given as an upper limit. The inconsistent apparent column densities for the O vi component at km s-1 suggests contamination to the O vi which we could not identify with any line associated with known absorbers along this quasar sightline. The plot of apparent column density with velocity (PLOT NOT INCLUDED) clearly shows this excess absorption is in the wings of O vi . The aluminum lines are from low STIS E230M grating observations.
4 IONIZATION & CHEMICAL ABUNDANCES IN THE ABSORBER
We rely on the measured column densities and their upper limits as constraints to determine the phase structure of the absorber. We consider both photoionization and collisional ionization scenarios. The photoionization models were computed using CLOUDY (Ferland et al. 2013, version 13.03), which models the absorbing gas as uniform density plane parallel slabs. The ionizing radiation we adopt is the upgraded extragalactic background radiation model given by Khaire & Srianand 2019, which incorporates the most recent measurements of the quasar luminosity function (Croom et al. 2009; Palanque-Delabrouille et al. 2013) and star formation rate densities (Khaire & Srianand 2015). The collisional ionization models were based on the calculations of Gnat & Sternberg 2007. In both cases, the gas is assumed to have solar abundances as given by Asplund et al. 2009.
4.1 Photoionization Modeling
4.1.1 The Central Component at km s-1
This H i component has detections of low (C ii, Si ii), intermediate (Si iii) and high ionization species (C iv, O vi). Figure 3 shows results from photoionization driven equilibrium models for densities in the range cm-3, for the observed . The models require the carbon abundance to be at least solar to recover the observed C ii for any gas density. The observed places a similar constraint of [Si/H] . For [C/H] = [Si/H] , the two ions can arise in a single gas phase with cm-3 (ionization parameter, ). As shown in Figure 3, the same gas phase also reproduces the observed and is simultaneously consistent with the non-detections of Si iv and N v. The model also predicts for this phase a total hydrogen column density of cm-2, equilibrium temperature of K, thermal pressure of cm-3 K, and a line of sight thickness of pc. The temperature is consistent with the narrow C ii and Si ii profiles. This phase, however, does not explain the C iv and O vi detected at the same velocity. The column density predictions for C iv and O vi are dex and dex lower than the corresponding observed values. A second phase is required to explain the origin of these high ions.
The presence of multiphase gas at the same velocity has implications for the metallicity estimates. The seen for this central component could largely be from the lower ionization C ii - Si ii gas. The neutral hydrogen accompanying a more highly ionized C iv - O vi phase coinciding in velocity will be comparatively less. In any case, the available data is not adequate to segregate the separate H i contributions from the two gas phases. If indeed is less the the upper limit of in C ii - Si ii phase, it would lead to a super-solar C and Si abundances in the weakly ionized gas they trace.
For the central component, the C iv and O vi have to come from a separate phase. Under ionization equilibrium, for a density of cm-3, which is two orders of magnitude lower than the density of the weakly ionized gas (see Figure 4). It is difficult to determine the exact chemical abundances, total hydrogen column density and size of this high ionization medium because of the uncertain H i. Considering the extreme possibility that most of the H i coinciding with the central component is associated with this C iv and O vi, we obtain a conservative lower bound of dex for the carbon and oxygen abundances. For smaller values of H i, higher values of abundances will be required to match the observed C iv and O vi from the same phase. As the abundances approach solar values, the models start producing appreciable amounts of C ii. Thus, solar and higher metallicities can be ruled out. The models predict this absorbing medium with cm-3 (assuming a solar [C/O] abundance pattern), with a total hydrogen column density of , K and a line of sight thickness of kpc. The temperature is much lower than the upper limit suggested by the -parameters of C iv and O vi.
4.1.2 The Offset Component at km s-1
At the velocity of this H i component there are no detections of low or intermediate ions, suggesting a predominance of higher ionization conditions in this cloud. The photoionization models are shown in Figure 5. The models require [C/H] dex to generate the observed . Within that abundance constraint, the observed C iv and O vi can come from a single gas phase with cm-3 (assuming solar [C/O] abundance pattern), , K and kpc. At this density, the model predictions for the low and intermediate ions are consistent with their non-detections. The [C/H] and [O/H] in this cloud are comparable to the abundance limits we derive for both these elements in the higher ionization phase of the central component. We emphasize that the metallicity, total hydrogen column density and absorber size estimates are based on the premise that the H i and the high ions are cospatial and tracing the same phase, an assumption that is contentious (see last paragraph of Sec 3 and Churchill et al. 2015). The photoionization equilibrium temperature predicted by the models is consistent with the upper limit indicated by the combined C iv and O vi line widths.
4.2 Is Collisional Ionization Significant?
In many intervening absorbers, O vi, by virtue of its comparatively high ionization potential ( eV), is found to have an origin in gas with K where the ionization is dictated by collisions between energetic free electrons and metal ions (Savage et al. 2002, Howk et al. 2002, Lehner et al. 2009, Narayanan et al. 2010a, Narayanan et al. 2010b, Savage et al. 2011, Narayanan et al. 2012, Savage et al. 2014, Pachat et al. 2016). The range of temperatures where the fractional abundances of C iv and O vi peak for collisional ionization equilibrium (CIE) conditions falls within the upper limits on the temperatures of the C iv - O vi phase in the central and the offset components, obtained from the different -values of C iv and O vi lines. We therefore consider the prospects of a warm collisionally ionized phase in the absorber.
In CIE, the ionic column density ratios are dependent only on the equilibrium temperature. The non-CIE scenario is valid for gas that is radiatively cooling from a high temperature, with faster cooling rates for gas of higher metallicity. Under non-equilibrium conditions, C iv and O vi ionization fractions do not decline as rapidly as CIE, for K (Savage et al. 2014, e.g., see Figure 3 of). Thus, one may expect to see these ions at temperatures of K. In Figure 5 are the CIE and non-CIE predictions for the C iv to O vi column density ratio based on the models of Gnat & Sternberg 2007.
In the offset component the observed column density ratio of one-tenth between C iv and O vi is reproduced at K, where both CIE and non-CIE have similar predictions. This estimate complies with the K given by the combined C iv and O vi line width ranges. The estimate is based on the assumption that the [C/O] relative abundance is solar. Additionally, the seen for this component is true only for K, which places a constraint on the temperature in this high ionization gas.
For the central component, the observed is valid at K, with the non-CIE models predicting a slightly lower temperature of K for solar metallicity, and [C/O] abundance. It needs to be emphasized that the metallicity in this higher ionization gas is uncertain as the H i at this velocity is more likely to be a part of the cooler photoionized gas traced by the low ions. At the model predicted temperature the H i ionization fraction is only . The temperature derived from the collisional ionization models for this component are consistent with the upper limit of K set by the combined line widths for C iv and O vi.
From the collisional ionization modelling, we conclude that the presence of C iv and O vi can be indicative of warm gas with a temperature of K for the central component and K for the offset component, with collisional ionization contributing in very substantial ways in maintaining the high ionization levels. An argument can also be made for the dominance of photoionization in a very diffuse medium ( cm-3) for the kinematically offset component.
4.3 Hybrid Models
A more vigorous approach to modeling should consider the effects of collisional and photoionization simultaneously. Such hybrid models were also computed to understand the origin of high ions in the central and offset components. Integrating time dependent collisional ionization models (non-CIE) with photoionization is an elaborate exercise beyond the scope of this work. Our hybrid models are restricted to CIE conditions. Hybrid models were computed for temperatures centered around K, as suggested by the CIE models and the absorption line widths. Since we do not have a measure on the amount of neutral hydrogen present in the higher ionization phase, the observed H i is taken as an upper limit. For the central and offset components, the hybrid models were able to recover the observed ratio between C iv and O vi column densities for [C/O] of solar, with the ionization dominated by collisions. For the warm gas phase in the central component, hybrid modelling gave us a solution at K, corresponding to gas densities of cm-3, a total hydrogen column density of cm-2, and oxygen and carbon abundances of [X/H] . The and abundance values are highly conservative limits because of the lack of knowledge about the H i associated with the warm gas phase. For the offset warm gas phase we obtain a hybrid solution at K, giving similar values of cm-3, cm-2, oxygen and carbon abundances of [X/H] and a line of sight thickness of kpc.
We note that the path length obtained for the high ionization gas through the different models are notably large. For example, while hybrid models for the highly ionized km s-1 offset component yield a line-of-sight thickness of kpc, photoionization modelling of the same cloud suggests a size of kpc. These size scales, though large, are consistent with the kpc transverse length scales and kpc line-of-sight thicknesses reported by Muzahid 2014 for a large-scale O vi-absorbing structure in the multiphase CGM of a 1.2L* galaxy at , observed using a pair of quasar sightlines, with one of the sightlines also showing a weak Mg ii analogue absorber.
5 GALAXIES NEAR THE ABSORBER
An important step towards deciphering the origin of the absorber is to extract information about galaxies located in its vicinity. In this section, we describe our search for galaxies neighbouring the z = 0.1212 absorber using the database of the Sloan Digital Sky Survey, which covers the PG sightline in its footprint. In the SDSS DR15 spectroscopic database, we queried for galaxies with spectroscopic redshifts that are within a projected separation of Mpc from the PG1424+240 quasar sightline and km s-1 of the absorber redshift (z = 0.1212). These constraints were adopted from the typical radius and velocity dispersion of galaxy clusters as reported in Bahcall 1988. This exercise revealed that there are two galaxies in the search field. Figure 6 shows a mosaic image of centered on the background quasar PG , with the two nearby galaxies labelled. The nearest of these two galaxies is located within 200 kpc of the absorber, and was identified by (Muzahid et al. 2018) as well. This galaxy, at a redshift of z 0.12118, also has a very small velocity offset of 11 km/s with respect to the absorber redshift, suggesting a possible association between the two.
42pc

42pc
In order to look for galaxy associations at scales larger than typical cluster sizes and check whether our absorber is in a galaxy overdensity region, we relaxed the SDSS database search criteria to encompass a projected separation of Mpc and a velocity offset of km s-1. This search identified a total of 18 galaxies with spectroscopic redshifts that are within the field of search. The particulars of these galaxies are listed in Table 3. In Figure 7, the spatial distribution of these 18 galaxies has been plotted with the axes denoting the RA and Dec offsets with respect to the position of the quasar. As evident from the table, all these galaxies have a Luminosity greater than the L* at this epoch. The detection of a significant number of >L* galaxies in the relatively narrow search field hints that our absorber is residing in a galaxy overdensity region.
| R.A. | Dec. | (km s-1) | (Mpc) | (mag) | Mg | ()g | |
|---|---|---|---|---|---|---|---|
Comments. - Galaxies within a projected separation of Mpc and km s-1 of the absorber. The values are SDSS spectroscopic redshifts. is the systemic velocities of the galaxies with respect to the absorber. The error in velocity separation comes from the uncertainty in the spectroscopic redshift. The projected separation was calculated from the angular separation assuming a CDM universe with parameters of km s-1 Mpc-1, , Bennett et al. 2014. While determining the absolute magnitudes, appropriate K-corrections were applied using the analytical expression given by Chilingarian et al. 2010. The Schecter absolute magnitude for was taken fromIlbert et al. 2005
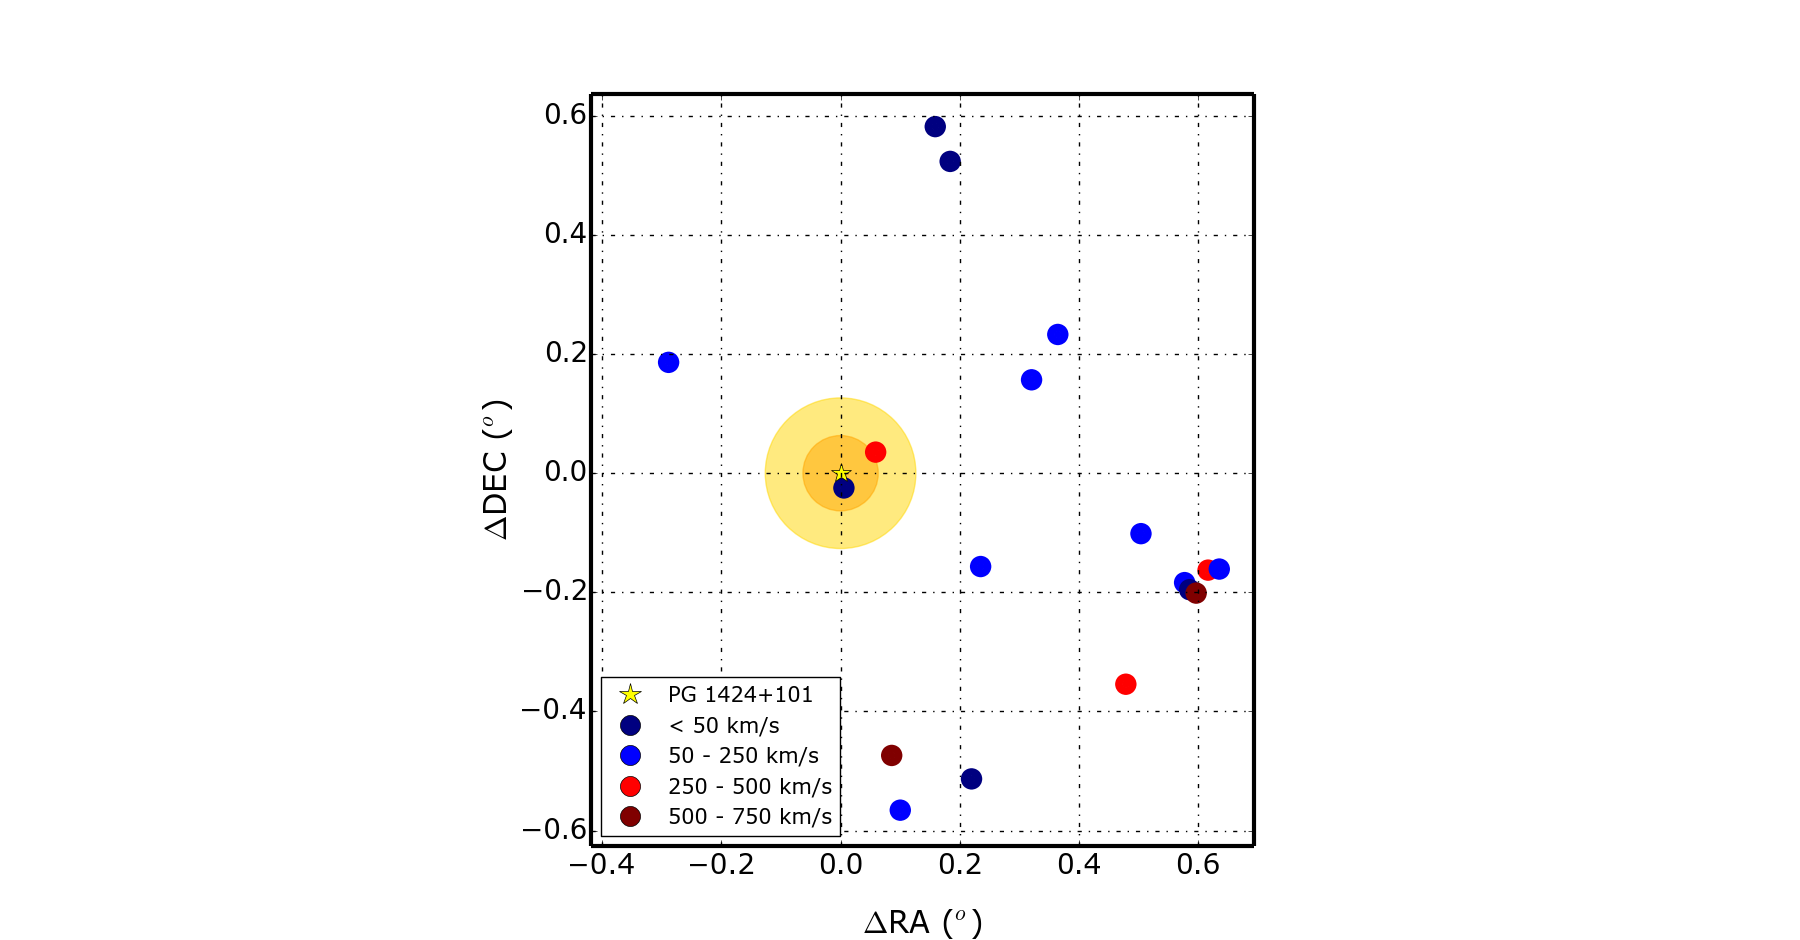


We performed a Monte Carlo sampling of the SDSS DR15 spectroscopic database, to explore whether the the number of bright galaxies detected in this field is higher than what is likely to be observed in a similar random patch of the sky at this redshift. One hundred regions covered in the SDSS footprint were selected at random, and were probed for SDSS-detected galaxies within 1000 km s-1 of our absorber redshift of z = 0.1212, and within a 5 Mpc search radius. Figure 8 (left panel) shows the frequency distribution of the galaxies found in these random search fields. The histogram shows a steep fall in the distribution for higher numbers of galaxies in the search regions, indicating that regions are more likely to have fewer galaxies. In 70% of the cases, we find less than 3 galaxies in the search field whereas, we find 18 galaxies in the neighbourhood of our absorber and this number is marked by the vertical red dashed line in the frequency distribution plot. From the Monte Carlo analysis, we find that that the probability of randomly detecting 18 or more galaxies in the sampled volume is exceptionally low ( 5 %), providing a strong evidence in favour of our absorber indeed tracing a galaxy overdensity region, such as a large scale structure of associated galaxies, with a size much larger than typical clusters.
We also need to verify whether the 18 galaxies detected by SDSS are in fact the only galaxies in the field around our absorber. The fact that all these galaxies have L* luminosity indicates that the SDSS is incomplete at sub-L* luminosities, and that we are unable to detect fainter galaxies in the region. To investigate this, we obtained the luminosity distribution of the galaxies detected in the Monte Carlo samples, as shown in the right panel of Figure 8. The distribution shows a distinct fall-off in the number of galaxies having a luminosity less than 1L*, revealing the poor completeness of the SDSS for sub-L* galaxies at z 0.1212. Hence, SDSS is only sampling the brightest galaxies in the region around our absorber, and even more galaxies such as dwarfs or other sub-L* galaxies are likely to be present in the vicinity of the absorber, that are too faint to be detected in the SDSS.
The inferred overabundance of galaxies near the z 0.1212 absorber suggests that the absorption is most likely tracing gas in a large group/cluster environment, with a probable origin in the extended halos of one of the galaxies belonging to that region. The length scales at which we are probing are much greater than those of typical galaxy cluster and group environments, suggesting that the overdensity we are probing is part of a much larger-scale galaxy association. We estimate the average velocity of the SDSS-detected group of galaxies within this association as km s-1, with respect to the absorber . The z 0.12118 galaxy identified by SDSS as closest to the absorber is a galaxy at an impact parameter of kpc, and a velocity offset, km s-1 with reference to the absorber redshift. Using the scaling relation kpc (Prochaska et al. 2011), we estimate a halo virial radius of kpc for this galaxy. The luminosity scaling relationship of Stocke et al. 2014, log Rvir 2.257 + 0.318C + 0.018 - 0.005 , where C = log (L/L*), also yields a comparable halo radius of kpc for this galaxy, meaning that the absorber is seemingly located at the fringes of the virial halo of the galaxy. This galaxy has an extended morphology, with an absorption line dominated spectrum (shown in Figure ), suggesting little ongoing star formation. The color of the galaxy is also consistent with with being late-type (E/S0, or Sa, Strateva et al. 2001). From the absence of emission-line flux at H-, the star formation rate in the galaxy is constrained to M (Kennicutt 1998). The presence of a luminous galaxy not too far in projected separation and velocity from the absorber, and the intriguing similarities between the absorber and multiphase Galactic HVCs, motivate us to consider the absorber as tracing high velocity gas in the extended halo of this galaxy. Alternate scenarios for the origin are also discussed in the final section.
6 SUMMARY & DISCUSSION
We have carried out absorption line analysis and ionization modelling of a multiphase system at towards the blazar PG , using high resolution HST/COS spectroscopic data. The key results are:
- 1.
The absorber contains low ionization C ii 1334 and Si ii 1260 lines, and an intermediate ionization Si iii 1206 line, coinciding in velocity with comparatively stronger detections of higher ionization C iv and O vi lines. The C ii 1334 and Si ii 1260 lines are very weak and their measured rest-frame equivalent widths (16 mÅ and 15 mÅ, respectively) are consistent with this absorber being a weak Mg ii analog.
- 2.
The C iv and O vi have at least two kinematically distinct components at km s-1 and km s-1. Absorption in H i also spans this same velocity range. The weak C ii, Si ii and Si iii are only detected in the central km s-1 component.
- 3.
While no single photoionized phase can simultaneously explain the low and high ions in the central component, a multiphase solution is possible with the low ions arising from solar metallicity gas with cm-3, and K, with a small line of sight thickness of parsec. The high metallicity and compact size of the cloud are typical of weak Mg ii absorbers. The strong C iv and O vi could arise in a warmer ( K) phase of the gas. These collisional ionization models together with the combined line widths of C iv and O vi limit the temperature in this phase to K. Alternatively, a photoionization origin in a low density medium with cm-3, K, kpc, and [C/H] [O/H] dex, cannot be ruled out. The multiphase nature of this cloud (parsec scale compact and cool low ionization gas coexisting with diffuse high ionization gas) has strong similarities with Galactic HVCs.
- 4.
For the C iv - O vi component offset in velocity, photoionization yields a feasible single-phase solution with cm-3, K, = 18.94, along with carbon and oxygen abundances of dex, assuming that the H i at this velocity is from the same phase as the high ions. The temperature prediction from the model is consistent with the upper limit obtained from the combined parameters of C iv and O vi. Collisional ionization conditions are also possible with temperatures of K.
- 5.
SDSS shows 18 luminous () galaxies within Mpc and km s-1 of systemic velocity from the absorber, indicating that the absorber is probing gas that is part of a galaxy rich environment such as a cluster or a massive group. The nearest galaxy to the absorber is at kpc and km s-1.
The impact parameter of and the close match in redshift with the nearest galaxy enhances the likelihood of the absorber being located within the CGM of this bright () galaxy. Such an origin is consistent with previous propositions of weak low-ionization absorbers as extragalactic analogs of the Milky Way HVCs (Lynch et al. 2006, Narayanan et al. 2007, Mshar et al. 2007, Narayanan et al. 2008, Richter et al. 2009). The solar metallicity for the low ionization dense gas is within the range found for cool circumgalactic clouds around luminous () galaxies even for projected distances of (e.g., Prochaska et al. 2017). Though our knowledge of the association of weak Mg ii absorbers with galaxies is limited (Churchill et al. 2005, Chen et al. 2010), both C iv and O vi are known to be strongly clustered around galaxies (Chen et al. 2001, Tumlinson et al. 2011, Prochaska et al. 2011, Werk et al. 2013, Stocke et al. 2013, Savage et al. 2014, Churchill et al. 2015, Kacprzak et al. 2015, Werk et al. 2016), with a higher covering fraction seen for more massive galaxies ( M⊙) than low mass ones (e.g., Burchett et al. 2016).
While we consider the possibility of the absorber being an HVC analog in the CGM of the 1.4L* galaxy, we note that the impact parameter of 200 kpc places the cloud much farther out in the halo compared to the highly ionized population of Galactic HVCs, majority of which are within 50 kpc from the Galactic center (Wakker 2001, Thom et al. 2006, Wakker et al. 2007, Thom et al. 2008, Wakker et al. 2008). The subgroup of Compact HVCs (CHVCs), located much farther, at distances of several hundred kiloparsecs, are postulated to have a Local Group origin (Blitz et al. 1999, Braun & Burton 1999, Sembach et al. 2003). Moreover, the low and high ionization properties in these Galactic compact clouds are not sufficiently well understood to draw a direct comparison with our absorber. Instead, insights can be drawn from a comparison of the absorber with M31’s CGM, which is well studied in both absorption and emission. Much of the high neutral column density gas surrounding M31 detected via 21 cm emission are within the inner halo at 0.2 Rvir (Thilker et al. 2004, Westmeier et al. 2005, Westmeier et al. 2007, Westmeier et al. 2008), with Rvir 300. However, a more extended study of the M31 CGM by Lehner et al. 2015 with better column density sensitivity over multiple background lines of sights has found the presence of metals tracing multiphase diffuse gas out to Rvir 300 kpc and possibly even beyond, with the ionization levels of the CGM increasing with projected separation. The 1.4L* galaxy at 200 kpc of projected separation from our absorber likely occupies a more massive and extended halo, suggesting that the absorber could, in fact, be tracing its multiphase CGM. The small column density ratio between low and high ions is also consistent with the dominance of higher ionization gas at large projected distances, as seen for the M31 CGM
Schaye
et al. 2007 had proposed that metals transported through the CGM by supernova driven winds or similar large-scale gas outflows could be confined as compact clouds poorly mixed with the ambient medium. These patchy clouds will be transient as they undergo free expansion due to pressure imbalance with the surrounding gas. The thermal gas pressure in the low ionization phase of our absorber ( cm-3 K) is an order of magnitude higher than the pressure in the higher ionization gas ( cm-3 K), if it is photoionized. The high-metallicity, higher density gas traced by C ii and Si ii could be a patchy transient cloud in a more diffuse higher ionization medium traced by C iv and O vi. As the ionization models indicate, the C iv and O vi coinciding with the weak low ionization gas can be collisionally ionized, in which case they could be transition temperature plasma at the conductive interface or turbulent mixing layers between the cool ( K) low ionization cloud and the K ambient corona of the luminous galaxy or a hot intragroup medium. For several extragalactic absorbers, collisional ionization in such interface layers has been the favored mechanism for the origin of O vi (Narayanan
et al. 2010a, Savage
et al. 2010, Savage
et al. 2011, Tumlinson
et al. 2011, Tripp
et al. 2011, Pointon et al. 2017, Stocke
et al. 2014, Stocke et al. 2017).
The same is also postulated for the origin of the highly ionized phase in Galactic HVCs (Borkowski et al. 1990, Slavin et al. 1993, Breitschwerdt & Schmutzler 1994, Murphy et al. 2000, Sembach et al. 2000, Sembach et al. 2003, Collins et al. 2005, Fox et al. 2005, Fox et al. 2008). Considering hybrid models (refer Section 4.3) for the higher ionization phase of the central component, if the higher ionization gas is indeed at an equilibrium temperature of K, then the two phases are more closer to being in pressure balance ( cm-3 K).
Using the length scale and temperature from the photoionization model for the low ionization gas, we compute its free expansion time-scale to be million years 33 3 Here is the size of the absorbing cloud, is the sound speed, and the average mass per particle for a predominantly ionized gas with mass fractions of H, He and heavier elements as 0.70, 0.28 and 0.02 respectively., which is much smaller compared to the Hubble time. This may imply a low likelihood of catching such transient structures in random lines of sight studies. However, weak low ionization clouds have a comoving number density that could be six orders of magnitude44 4 This estimate assumes spherical geometry for the absorbing clouds higher compared to bright L > 0.1L* galaxies (Rigby et al. 2002, Schaye et al. 2007). Though transient in nature, the far more numerous presence of these gas clouds in regions clustered around galaxies compensates for their short lifetimes, yielding a higher rate of incidence in absorption sightline surveys (Rigby et al. 2002, Lynch & Charlton 2007, Narayanan et al. 2008).
If the cloud is embedded in the CGM of the 1.4L* galaxy, a useful exercise is to compare the model-derived gas pressure values with the expected ambient pressure of the CGM at an impact parameter of 200 kpc from this galaxy. In the case of the Milky Way, Bouma et al. 2019 provide a scaling relation between CGM gas pressure and Galactocentric radius, based on the coronal gas model by Miller & Bregman 2015. Adopting this Galactic pressure profile for studying the CGM of the 1.4 L* galaxy, we compute a circumgalactic gas pressure of cm-3 K at kpc, where our absorber resides. This pressure falls in between the cm-3 K obtained for the low ionization phase and the cm-3 K for the higher ionization phase, derived via photoionization modeling for the central component. The computed CGM pressure value is also comparable to the cm-3 K derived through hybrid models for the higher phase of the central component.
Explanations tending towards both photoionization and collisional ionization can be made for the C iv and O vi in the offset cloud. In fact, the origin of C iv and O vi in intervening absorbers has always been ambiguous. The ionization fraction of both ions peak at temperatures slightly above K under collisional ionization conditions (Gnat & Sternberg 2007). At the same time photoionization can also contribute in very substantial ways in low density gas (Tripp et al. 2008, Hussain et al. 2017), and is likely to dominate in high-redshift absorbers due to a higher intensity of the UV extragalactic background radiation. The theoretical models of Oppenheimer & Davé 2009 categorized strong O vi absorbers ( cm-2) as tracing collisional ionization in warm gas, whereas weaker O vi lines were more in agreement with a photoionized scenario (also see Cen et al. 2001, Fang & Bryan 2001, Chen et al. 2003, Cen & Fang 2006). The mass of the dark matter halo of the host galaxy has a strong influence on the ionization mechanism in circumgalactic clouds. Massive halos possess virial temperatures sufficient to produce C iv and O vi through collisional ionization (e.g. Prochaska et al. 2011, Pointon et al. 2017, Mason et al. 2019), whereas in sub- halos (M 10) it is governed by photoionization (Churchill et al. 2014, Oppenheimer et al. 2016). In evaluating the present absorber, it may be apt to also think of the absorption arising from sub- halos, rather than the more massive and luminous galaxy identified by SDSS as closest to the absorber, which we discuss next.
While the association with a metal rich outflow in the CGM of the galaxy is a possibility, there are alternatives that can be considered. For example, this galaxy nearest in impact parameter is part of a massive group or cluster of several very bright galaxies (see Section 5 and Figure 7). The line-of-sight could very well be probing sub- galaxies undetected by SDSS and closer in separation. The luminosity distribution function of SDSS galaxies at the redshift of the absorber exposes the significant incompleteness of the SDSS galaxy spectroscopic database at fainter luminosities (see Figure 8). Weak low-ionization absorbers have previously been interpreted to be associated with dwarf galaxies. The redshift evolution of these absorbers peak at coinciding with the peak in global star formation rate in dwarf galaxies, hinting at a possible causal relation between dwarf galaxies and at least some fraction of weak Mg ii absorbers (Lynch et al. 2006, Narayanan et al. 2007, Lynch & Charlton 2007). More conclusive evidence is presented in other works, where weak low-ionization absorbers were found to be tracing supernova driven outflows in close proximity with starburst and post-starburst dwarf galaxies (Zonak et al. 2004, Stocke et al. 2004, Keeney et al. 2006).
Simulations show strong outflows from supernovae creating a widespread distribution of metals around star-forming dwarf galaxies ( M⊙, kpc) because of their shallow gravitational potential (Shen et al. 2014, Oppenheimer et al. 2016, Muratov et al. 2017, Christensen et al. 2018). On the other hand, absorption line studies probing the CGM of sub- and dwarf galaxies have consistently found a low covering fraction of metals, especially in their lower ionization states, even for impact parameters of , compared to massive galaxies (Prochaska et al. 2011, Bordoloi et al. 2014, Liang & Chen 2014, Burchett et al. 2016, Johnson et al. 2017). If this is the case, then our line of sight has to be probing the CGM at close projected distances, much less than half the virial radius from the central sub- galaxy.
At the same time, it is also important to factor in the environment in which these dwarf galaxies reside. Johnson et al. 2017 in their study of CGM absorbers have only considered isolated field dwarf galaxies. The weak absorber we study, instead, resides in a galaxy rich environment where tidal forces from massive galaxies and/or ram pressure induced by their hot circumgalactic corona can displace interstellar gas from dwarf satellite galaxies significantly enhancing the covering fraction of cool low ionization gas around them. Such gaseous tidal streams are known to be a source of high velocity gas in the CGM of Milky Way and M31 (Putman et al. 2003a, Thilker et al. 2004, Fox et al. 2005, Fox et al. 2010, Besla et al. 2010, Besla et al. 2012, D’Onghia & Fox 2016). Along similar lines, in the multiphase CGM simulations of Oppenheimer et al. 2018, the presence of neighboring galaxies within kpc, as in a group environment, is found to increase the incidence of low ionization gas at distances further out in the CGM ( kpc). Thus, the weak absorber originating in an undiscovered dwarf galaxy in an overdense environment remains an intriguing possibility. The C iv and O vi coincident in velocity with the low ions could be interface gas between a cooler cloud and a hotter medium, whereas the C iv and O vi offset in velocity could be tracing the ambient photoionized gas in a kiloparsec scale region within the CGM. The two C iv clouds have very similar conditions suggesting similar origins.
An alternative is for the weak absorber to be tracing intra-group gas common to the large scale galaxy environment, rather than the gaseous halo of an individual galaxy. Numerous previous absorption line studies of galaxy dense environments have found the presence of high metallicity gas in the intragroup/intracluster space (Rasmussen et al. 2006, McConnachie et al. 2007, Freeland & Wilcots 2011, Zavala et al. 2012, Boselli et al. 2016, Gavazzi et al. 2018, Burchett et al. 2018, Manuwal et al. 2019, Pradeep et al. 2019) beyond the of the nearest bright galaxies. The chemical enrichment of such gas is understood as due to the displacement of metals from galaxies via physical processes like feedback from supernovae, AGNs, tidal interactions between galaxies or stripping of interstellar gas due to ram pressures as galaxies move through the hot group/cluster medium. Such mechanisms have been proposed by previous studies to explain the origin of other weak Mg ii absorbers (Narayanan et al. 2008, Muzahid et al. 2018).
Finding weak low ionization absorbers with additional coverage of H i, C iv and O vi in the combined COS and STIS archive is potentially an important means for identifying metal-rich HVC analogues surrounding other galaxies. Even as large surveys capture the broad statistics of absorber populations, it is also important to assess individual absorption systems in detail, establish the chemical abundances of elements in them and the ionization phases they trace, all of which are vital for understanding their origin. The measurements in this paper demonstrate the need to do this with high spectral data complemented by deep galaxy observations that go down to faint luminosities in the extended volume encompassing the absorber.
Acknowledgements
We thank the anonymous referee for a useful and constructive review of the manuscript. Support for this work was provided by SERB through grant number EMR/2017/002531 from the Department of Science & Technology, Government of India. This work is based on observations made with the NASA/ESA Hubble Space Telescope, support for which was given by NASA through grant HST GO-14655 from the Space Telescope Science Institute. STScI is operated by the Association of Universities for Research in Astronomy, Inc. under NASA contract NAS 5-26555. VK was supported by NASA through grant number HST-AR-15032.002-A from the STScI. This research has made use of the HSLA database, developed and maintained at STScI, Baltimore, USA, and also the Sloan Digital Sky Survey (SDSS) data base. Funding for the Sloan Digital Sky Survey IV has been provided by the Alfred P. Sloan Foundation, the U.S. Department of Energy Office of Science, and the Participating Institutions. JC acknowledges support from NSF AST-1517816.
References
- Asplund et al. (2009) Asplund M., Grevesse N., Sauval A. J., Scott P., 2009, Annual Review of Astronomy and Astrophysics, 47, 481
- Bahcall (1988) Bahcall N. A., 1988, Annual Review of Astronomy and Astrophysics, 26, 631
- Ben Bekhti et al. (2008) Ben Bekhti N., Richter P., Westmeier T., Murphy M. T., 2008, Astronomy and Astrophysics, 487, 583
- Ben Bekhti et al. (2012) Ben Bekhti N., Winkel B., Richter P., Kerp J., Klein U., Murphy M. T., 2012, Astronomy and Astrophysics, 542, A110
- Bennett et al. (2014) Bennett C. L., Larson D., Weiland J. L., Hinshaw G., 2014, The Astrophysical Journal, 794, 135
- Besla et al. (2010) Besla G., Kallivayalil N., Hernquist L., van der Marel R. P., Cox T. J., Kereš D., 2010, The Astrophysical Journal, 721, L97
- Besla et al. (2012) Besla G., Kallivayalil N., Hernquist L., van der Marel R. P., Cox T. J., Kereš D., 2012, Monthly Notices of the Royal Astronomical Society, 421, 2109
- Bish et al. (2019) Bish H. V., Werk J. K., Prochaska J. X., Rubin K. H. R., Zheng Y., O’Meara J. M., Deason A. J., 2019, ApJ, 882, 76
- Blitz et al. (1999) Blitz L., Spergel D. N., Teuben P. J., Hartmann D., Burton W. B., 1999, The Astrophysical Journal, 514, 818
- Bordoloi et al. (2011) Bordoloi R., et al., 2011, The Astrophysical Journal, 743, 10
- Bordoloi et al. (2014) Bordoloi R., et al., 2014, The Astrophysical Journal, 796, 136
- Borkowski et al. (1990) Borkowski K. J., Balbus S. A., Fristrom C. C., 1990, The Astrophysical Journal, 355, 501
- Boselli et al. (2016) Boselli A., et al., 2016, A&A, 596, A11
- Bouma et al. (2019) Bouma S. J. D., Richter P., Fechner C., 2019, Astronomy and Astrophysics, 627, A20
- Braun & Burton (1999) Braun R., Burton W. B., 1999, Astronomy and Astrophysics, 341, 437
- Bregman (1980) Bregman J. N., 1980, The Astrophysical Journal, 236, 577
- Breitschwerdt & Schmutzler (1994) Breitschwerdt D., Schmutzler T., 1994, Nature, 371, 774
- Burchett et al. (2016) Burchett J. N., et al., 2016, The Astrophysical Journal, 832, 124
- Burchett et al. (2018) Burchett J. N., Tripp T. M., Wang Q. D., Willmer C. N. A., Bowen D. V., Jenkins E. B., 2018, MNRAS, 475, 2067
- Cen & Fang (2006) Cen R., Fang T., 2006, The Astrophysical Journal, 650, 573
- Cen et al. (2001) Cen R., Tripp T. M., Ostriker J. P., Jenkins E. B., 2001, The Astrophysical Journal, 559, L5
- Charlton et al. (2003) Charlton J. C., Ding J., Zonak S. G., Churchill C. W., Bond N. A., Rigby J. R., 2003, The Astrophysical Journal, 589, 111
- Chen et al. (2001) Chen H.-W., Lanzetta K. M., Webb J. K., 2001, The Astrophysical Journal, 556, 158
- Chen et al. (2003) Chen X., Weinberg D. H., Katz N., Davé R., 2003, The Astrophysical Journal, 594, 42
- Chen et al. (2010) Chen H.-W., Wild V., Tinker J. L., Gauthier J.-R., Helsby J. E., Shectman S. A., Thompson I. B., 2010, The Astrophysical Journal, 724, L176
- Chilingarian et al. (2010) Chilingarian I. V., Melchior A.-L., Zolotukhin I. Y., 2010, Monthly Notices of the Royal Astronomical Society, 405, 1409
- Christensen et al. (2018) Christensen C. R., Davé R., Brooks A., Quinn T., Shen S., 2018, The Astrophysical Journal, 867, 142
- Churchill et al. (1999) Churchill C. W., Mellon R. R., Charlton J. C., Jannuzi B. T., Kirhakos S., Steidel C. C., Schneider D. P., 1999, The Astrophysical Journal, 519, L43
- Churchill et al. (2005) Churchill C. W., Kacprzak G. G., Steidel C. C., 2005, IAU Colloq. 199: Probing Galaxies through Quasar Absorption Lines, p. 24
- Churchill et al. (2013) Churchill C. W., Nielsen N. M., Kacprzak G., Trujillo S., 2013, American Astronomical Society Meeting Abstracts #221, 221, 227.04
- Churchill et al. (2014) Churchill C. W., Klimek E., Medina A., Vander Vliet J. R., 2014, arXiv e-prints, p. arXiv:1409.0916
- Churchill et al. (2015) Churchill C. W., Vander Vliet J. R., Trujillo-Gomez S., Kacprzak G. G., Klypin A., 2015, The Astrophysical Journal, 802, 10
- Collins et al. (2003) Collins J. A., Shull J. M., Giroux M. L., 2003, The Astrophysical Journal, 585, 336
- Collins et al. (2004) Collins J. A., Shull J. M., Giroux M. L., 2004, The Astrophysical Journal, 605, 216
- Collins et al. (2005) Collins J. A., Shull J. M., Giroux M. L., 2005, The Astrophysical Journal, 623, 196
- Cooksey et al. (2008) Cooksey K. L., Prochaska J. X., Chen H.-W., Mulchaey J. S., Weiner B. J., 2008, The Astrophysical Journal, 676, 262
- Croom et al. (2009) Croom S. M., et al., 2009, Monthly Notices of the Royal Astronomical Society, 399, 1755
- D’Onghia & Fox (2016) D’Onghia E., Fox A. J., 2016, Annual Review of Astronomy and Astrophysics, 54, 363
- Fang & Bryan (2001) Fang T., Bryan G. L., 2001, The Astrophysical Journal, 561, L31
- Ferland et al. (2013) Ferland G. J., et al., 2013, Revista Mexicana de Astronomia y Astrofisica, 49, 137
- Fitzpatrick & Spitzer (1997) Fitzpatrick E. L., Spitzer L., 1997, The Astrophysical Journal, 475, 623
- Fox et al. (2003) Fox A. J., Savage B. D., Sembach K. R., Fabian D., Richter P., Meyer D. M., Lauroesch J., Howk J. C., 2003, The Astrophysical Journal, 582, 793
- Fox et al. (2004) Fox A. J., Savage B. D., Wakker B. P., Richter P., Sembach K. R., Tripp T. M., 2004, The Astrophysical Journal, 602, 738
- Fox et al. (2005) Fox A. J., Wakker B. P., Savage B. D., Tripp T. M., Sembach K. R., Bland-Hawthorn J., 2005, The Astrophysical Journal, 630, 332
- Fox et al. (2006) Fox A. J., Savage B. D., Wakker B. P., 2006, The Astrophysical Journal Supplement Series, 165, 229
- Fox et al. (2007) Fox A. J., Petitjean P., Ledoux C., Srianand R., 2007, The Astrophysical Journal, 668, L15
- Fox et al. (2008) Fox A. J., Bergeron J., Petitjean P., 2008, Monthly Notices of the Royal Astronomical Society, 388, 1557
- Fox et al. (2010) Fox A. J., Wakker B. P., Smoker J. V., Richter P., Savage B. D., Sembach K. R., 2010, The Astrophysical Journal, 718, 1046
- Freeland & Wilcots (2011) Freeland E., Wilcots E., 2011, ApJ, 738, 145
- Ganguly et al. (2005) Ganguly R., Sembach K. R., Tripp T. M., Savage B. D., 2005, The Astrophysical Journal Supplement Series, 157, 251
- Gauthier et al. (2009) Gauthier J.-R., Chen H.-W., Tinker J. L., 2009, The Astrophysical Journal, 702, 50
- Gavazzi et al. (2018) Gavazzi G., Consolandi G., Gutierrez M. L., Boselli A., Yoshida M., 2018, A&A, 618, A130
- Gnat & Sternberg (2007) Gnat O., Sternberg A., 2007, The Astrophysical Journal Supplement Series, 168, 213
- Houck & Bregman (1990) Houck J. C., Bregman J. N., 1990, The Astrophysical Journal, 352, 506
- Howk et al. (2002) Howk J., Sembach K., Savage B., Massa D., Friedman S., Fullerton A., 2002, The Astrophysical Journal, 569, 214
- Hussain et al. (2017) Hussain T., Khaire V., Srianand R., Muzahid S., Pathak A., 2017, Monthly Notices of the Royal Astronomical Society, 466, 3133
- Ilbert et al. (2005) Ilbert O., et al., 2005, Astronomy and Astrophysics, 439, 863
- Johnson et al. (2017) Johnson S. D., Chen H.-W., Mulchaey J. S., Schaye J., Straka L. A., 2017, The Astrophysical Journal, 850, L10
- Kacprzak et al. (2008) Kacprzak G. G., Churchill C. W., Steidel C. C., Murphy M. T., 2008, The Astronomical Journal, 135, 922
- Kacprzak et al. (2015) Kacprzak G. G., Muzahid S., Churchill C. W., Nielsen N. M., Charlton J. C., 2015, The Astrophysical Journal, 815, 22
- Keeney et al. (2006) Keeney B. A., Stocke J. T., Rosenberg J. L., Tumlinson J., York D. G., 2006, The Astronomical Journal, 132, 2496
- Kennicutt (1998) Kennicutt R. C., 1998, The Astrophysical Journal, 498, 541
- Khaire & Srianand (2015) Khaire V., Srianand R., 2015, The Astrophysical Journal, 805, 33
- Khaire & Srianand (2019) Khaire V., Srianand R., 2019, Monthly Notices of the Royal Astronomical Society, 484, 4174
- Kriss (2011) Kriss G. A., 2011, Technical report, Improved Medium Resolution Line Spread Functions for COS FUV Spectra
- Kwak et al. (2015) Kwak K., Shelton R. L., Henley D. B., 2015, The Astrophysical Journal, 812, 111
- Lehner et al. (2008) Lehner N., Howk J. C., Prochaska J. X., Wolfe A. M., 2008, Monthly Notices of the Royal Astronomical Society, 390, 2
- Lehner et al. (2009) Lehner N., Prochaska J. X., Kobulnicky H. A., Cooksey K. L., Howk J. C., Williger G. M., Cales S. L., 2009, The Astrophysical Journal, 694, 734
- Lehner et al. (2015) Lehner N., Howk J. C., Wakker B. P., 2015, The Astrophysical Journal, 804, 79
- Liang & Chen (2014) Liang C. J., Chen H.-W., 2014, Monthly Notices of the Royal Astronomical Society, 445, 2061
- Liang et al. (2018) Liang C. J., Kravtsov A. V., Agertz O., 2018, Monthly Notices of the Royal Astronomical Society, 479, 1822
- Lu et al. (1998) Lu L., Savage B. D., Sembach K. R., Wakker B. P., Sargent W. L. W., Oosterloo T. A., 1998, The Astronomical Journal, 115, 162
- Lynch & Charlton (2007) Lynch R. S., Charlton J. C., 2007, The Astrophysical Journal, 666, 64
- Lynch et al. (2006) Lynch R. S., Charlton J. C., Kim T.-S., 2006, The Astrophysical Journal, 640, 81
- Manuwal et al. (2019) Manuwal A., Narayanan A., Muzahid S., Charlton J. C., Khaire V., Chand H., 2019, MNRAS, 485, 30
- Mason et al. (2019) Mason C. A., et al., 2019, Monthly Notices of the Royal Astronomical Society, 485, 3947
- McConnachie et al. (2007) McConnachie A. W., Venn K. A., Irwin M. J., Young L. M., Geehan J. J., 2007, The Astrophysical Journal, 671, L33
- Miller & Bregman (2015) Miller M. J., Bregman J. N., 2015, The Astrophysical Journal, 800, 14
- Milutinović et al. (2006) Milutinović N., Rigby J. R., Masiero J. R., Lynch R. S., Palma C., Charlton J. C., 2006, The Astrophysical Journal, 641, 190
- Misawa et al. (2007) Misawa T., Charlton J. C., Eracleous M., Ganguly R., Tytler D., Kirkman D., Suzuki N., Lubin D., 2007, The Astrophysical Journal Supplement Series, 171, 1
- Mshar et al. (2007) Mshar A. C., Charlton J. C., Lynch R. S., Churchill C., Kim T.-S., 2007, The Astrophysical Journal, 669, 135
- Muratov et al. (2017) Muratov A. L., et al., 2017, Monthly Notices of the Royal Astronomical Society, 468, 4170
- Murphy et al. (2000) Murphy E. M., et al., 2000, The Astrophysical Journal, 538, L35
- Muzahid (2014) Muzahid S., 2014, The Astrophysical Journal, 784, 5
- Muzahid et al. (2018) Muzahid S., Fonseca G., Roberts A., Rosenwasser B., Richter P., Narayanan A., Churchill C., Charlton J., 2018, Monthly Notices of the Royal Astronomical Society, 476, 4965
- Narayanan et al. (2005) Narayanan A., Charlton J. C., Masiero J. R., Lynch R., 2005, The Astrophysical Journal, 632, 92
- Narayanan et al. (2007) Narayanan A., Misawa T., Charlton J. C., Kim T.-S., 2007, The Astrophysical Journal, 660, 1093
- Narayanan et al. (2008) Narayanan A., Charlton J. C., Misawa T., Green R. E., Kim T.-S., 2008, The Astrophysical Journal, 689, 782
- Narayanan et al. (2010a) Narayanan A., Savage B. D., Wakker B. P., 2010a, The Astrophysical Journal, 712, 1443
- Narayanan et al. (2010b) Narayanan A., Wakker B. P., Savage B. D., Keeney B. A., Shull J. M., Stocke J. T., Sembach K. R., 2010b, The Astrophysical Journal, 721, 960
- Narayanan et al. (2012) Narayanan A., Savage B. D., Wakker B. P., 2012, The Astrophysical Journal, 752, 65
- Nielsen et al. (2013) Nielsen N. M., Churchill C. W., Kacprzak G. G., 2013, The Astrophysical Journal, 776, 115
- Norman & Ikeuchi (1989) Norman C. A., Ikeuchi S., 1989, The Astrophysical Journal, 345, 372
- Oppenheimer & Davé (2009) Oppenheimer B. D., Davé R., 2009, Monthly Notices of the Royal Astronomical Society, 395, 1875
- Oppenheimer et al. (2016) Oppenheimer B. D., et al., 2016, Monthly Notices of the Royal Astronomical Society, 460, 2157
- Oppenheimer et al. (2018) Oppenheimer B. D., Schaye J., Crain R. A., Werk J. K., Richings A. J., 2018, Monthly Notices of the Royal Astronomical Society, 481, 835
- Pachat et al. (2016) Pachat S., Narayanan A., Muzahid S., Khaire V., Srianand R., Wakker B. P., Savage B. D., 2016, Monthly Notices of the Royal Astronomical Society, 458, 733
- Palanque-Delabrouille et al. (2013) Palanque-Delabrouille N., et al., 2013, Astronomy and Astrophysics, 551, A29
- Peeples et al. (2017) Peeples M., et al., 2017, The Hubble Spectroscopic Legacy Archive, Instrument Science Report COS 2017-4
- Pointon et al. (2017) Pointon S. K., Nielsen N. M., Kacprzak G. G., Muzahid S., Churchill C. W., Charlton J. C., 2017, The Astrophysical Journal, 844, 23
- Pradeep et al. (2019) Pradeep J., Narayanan A., Muzahid S., Nagai D., Charlton J. C., Srianand R., 2019, MNRAS, 488, 5327
- Prochaska et al. (2011) Prochaska J. X., Weiner B., Chen H.-W., Mulchaey J., Cooksey K., 2011, The Astrophysical Journal, 740, 91
- Prochaska et al. (2017) Prochaska J. X., et al., 2017, The Astrophysical Journal, 837, 169
- Putman et al. (2003a) Putman M. E., Staveley-Smith L., Freeman K. C., Gibson B. K., Barnes D. G., 2003a, The Astrophysical Journal, 586, 170
- Putman et al. (2003b) Putman M. E., Bland-Hawthorn J., Veilleux S., Gibson B. K., Freeman K. C., Maloney P. R., 2003b, ApJ, 597, 948
- Putman et al. (2012) Putman M. E., Peek J. E. G., Joung M. R., 2012, Annual Review of Astronomy and Astrophysics, 50, 491
- Rasmussen et al. (2006) Rasmussen J., Ponman T. J., Mulchaey J. S., 2006, Monthly Notices of the Royal Astronomical Society, 370, 453
- Richter et al. (2001a) Richter P., Savage B. D., Wakker B. P., Sembach K. R., Kalberla P. M. W., 2001a, The Astrophysical Journal, 549, 281
- Richter et al. (2001b) Richter P., Sembach K. R., Wakker B. P., Savage B. D., Tripp T. M., Murphy E. M., Kalberla P. M. W., Jenkins E. B., 2001b, The Astrophysical Journal, 559, 318
- Richter et al. (2001c) Richter P., Sembach K. R., Wakker B. P., Savage B. D., 2001c, The Astrophysical Journal, 562, L181
- Richter et al. (2009) Richter P., Charlton J. C., Fangano A. P. M., Bekhti N. B., Masiero J. R., 2009, The Astrophysical Journal, 695, 1631
- Richter et al. (2017) Richter P., et al., 2017, Astronomy & Astrophysics, 607, A48
- Rigby et al. (2001) Rigby J. R., Charlton J. C., Churchill C. W., 2001, Gas and Galaxy Evolution, 240, 58
- Rigby et al. (2002) Rigby J. R., Charlton J. C., Churchill C. W., 2002, The Astrophysical Journal, 565, 743
- Rovero et al. (2016) Rovero A. C., Muriel H., Donzelli C., Pichel A., 2016, Astronomy and Astrophysics, 589, A92
- Sarkar et al. (2017) Sarkar K. C., Nath B. B., Sharma P., 2017, MNRAS, 467, 3544
- Savage & Sembach (1991) Savage B. D., Sembach K. R., 1991, The Astrophysical Journal, 379, 245
- Savage & Wakker (2009) Savage B. D., Wakker B. P., 2009, ApJ, 702, 1472
- Savage & de Boer (1979) Savage B. D., de Boer K. S., 1979, The Astrophysical Journal, 230, L77
- Savage & de Boer (1981) Savage B. D., de Boer K. S., 1981, The Astrophysical Journal, 243, 460
- Savage et al. (1997) Savage B. D., Sembach K. R., Lu L., 1997, The Astronomical Journal, 113, 2158
- Savage et al. (2002) Savage B. D., Sembach K. R., Tripp T. M., Richter P., 2002, The Astrophysical Journal, 564, 631
- Savage et al. (2010) Savage B. D., et al., 2010, The Astrophysical Journal, 719, 1526
- Savage et al. (2011) Savage B. D., Lehner N., Narayanan A., 2011, The Astrophysical Journal, 743, 180
- Savage et al. (2014) Savage B. D., Kim T.-S., Wakker B. P., Keeney B., Shull J. M., Stocke J. T., Green J. C., 2014, The Astrophysical Journal Supplement Series, 212, 8
- Schaye et al. (2007) Schaye J., Carswell R. F., Kim T.-S., 2007, Monthly Notices of the Royal Astronomical Society, 379, 1169
- Schulman et al. (1996) Schulman E., Bregman J. N., Brinks E., Roberts M. S., 1996, The Astronomical Journal, 112, 960
- Schulman et al. (1997a) Schulman E., Brinks E., Bregman J. N., Roberts M. S., 1997a, The Astronomical Journal, 113, 1559
- Schulman et al. (1997b) Schulman E., Ockels F., Knezek P. M., 1997b, American Astronomical Society Meeting Abstracts, 191, 77.06
- Sembach & Savage (1992) Sembach K. R., Savage B. D., 1992, The Astrophysical Journal Supplement Series, 83, 147
- Sembach et al. (2000) Sembach K. R., et al., 2000, The Astrophysical Journal, 538, L31
- Sembach et al. (2001) Sembach K. R., Howk J. C., Savage B. D., Shull J. M., 2001, The Astronomical Journal, 121, 992
- Sembach et al. (2003) Sembach K. R., et al., 2003, The Astrophysical Journal Supplement Series, 146, 165
- Sembach et al. (2004) Sembach K. R., et al., 2004, The Astrophysical Journal Supplement Series, 150, 387
- Shapiro & Field (1976) Shapiro P. R., Field G. B., 1976, The Astrophysical Journal, 205, 762
- Shen et al. (2014) Shen S., Madau P., Conroy C., Governato F., Mayer L., 2014, The Astrophysical Journal, 792, 99
- Shull et al. (2009) Shull J. M., Jones J. R., Danforth C. W., Collins J. A., 2009, The Astrophysical Journal, 699, 754
- Slavin et al. (1993) Slavin J. D., Shull J. M., Begelman M. C., 1993, The Astrophysical Journal, 407, 83
- Stocke et al. (2004) Stocke J. T., Keeney B. A., McLin K. M., Rosenberg J. L., Weymann R. J., Giroux M. L., 2004, The Astrophysical Journal, 609, 94
- Stocke et al. (2013) Stocke J. T., Keeney B. A., Danforth C. W., Shull J. M., Froning C. S., Green J. C., Penton S. V., Savage B. D., 2013, The Astrophysical Journal, 763, 148
- Stocke et al. (2014) Stocke J. T., et al., 2014, The Astrophysical Journal, 791, 128
- Stocke et al. (2017) Stocke J. T., Keeney B. A., Danforth C. W., Oppenheimer B. D., Pratt C. T., Berlind A. A., 2017, The Astrophysical Journal, 838, 37
- Strateva et al. (2001) Strateva I., et al., 2001, The Astronomical Journal, 122, 1861
- Swaters et al. (1997) Swaters R. A., Sancisi R., van der Hulst J. M., 1997, The Astrophysical Journal, 491, 140
- Thilker et al. (2004) Thilker D. A., Braun R., Walterbos R. A. M., Corbelli E., Lockman F. J., Murphy E., Maddalena R., 2004, The Astrophysical Journal Letters, 601, L39
- Thom et al. (2006) Thom C., Putman M. E., Gibson B. K., Christlieb N., Flynn C., Beers T. C., Wilhelm R., Lee Y. S., 2006, The Astrophysical Journal Letters, 638, L97
- Thom et al. (2008) Thom C., Peek J. E. G., Putman M. E., Heiles C., Peek K. M. G., Wilhelm R., 2008, The Astrophysical Journal, 684, 364
- Tripp et al. (2003) Tripp T. M., et al., 2003, The Astronomical Journal, 125, 3122
- Tripp et al. (2008) Tripp T. M., Sembach K. R., Bowen D. V., Savage B. D., Jenkins E. B., Lehner N., Richter P., 2008, The Astrophysical Journal Supplement Series, 177, 39
- Tripp et al. (2011) Tripp T. M., et al., 2011, Science, 334, 952
- Tumlinson et al. (2011) Tumlinson J., et al., 2011, The Astrophysical Journal, 733, 111
- Tumlinson et al. (2017) Tumlinson J., Peeples M. S., Werk J. K., 2017, Annual Review of Astronomy and Astrophysics, 55, 389
- Wakker (2001) Wakker B. P., 2001, The Astrophysical Journal Supplement Series, 136, 463
- Wakker & van Woerden (1997) Wakker B. P., van Woerden H., 1997, Annual Review of Astronomy and Astrophysics, 35, 217
- Wakker et al. (1999) Wakker B. P., et al., 1999, Nature, 402, 388
- Wakker et al. (2003) Wakker B. P., et al., 2003, The Astrophysical Journal Supplement Series, 146, 1
- Wakker et al. (2007) Wakker B. P., et al., 2007, The Astrophysical Journal Letters, 670, L113
- Wakker et al. (2008) Wakker B. P., York D. G., Wilhelm R., Barentine J. C., Richter P., Beers T. C., Ivezić u., Howk J. C., 2008, The Astrophysical Journal, 672, 298
- Werk et al. (2013) Werk J. K., Prochaska J. X., Thom C., Tumlinson J., Tripp T. M., O’Meara J. M., Peeples M. S., 2013, The Astrophysical Journal Supplement Series, 204, 17
- Werk et al. (2016) Werk J. K., et al., 2016, The Astrophysical Journal, 833, 54
- Westmeier et al. (2005) Westmeier T., Braun R., Thilker D., 2005, Astronomy and Astrophysics, 436, 101
- Westmeier et al. (2007) Westmeier T., Braun R., Brüns C., Kerp J., Thilker D. A., 2007, New Astronomy Reviews, 51, 108
- Westmeier et al. (2008) Westmeier T., Brüns C., Kerp J., 2008, Monthly Notices of the Royal Astronomical Society, 390, 1691
- Wright (2006) Wright E. L., 2006, Publications of the Astronomical Society of the Pacific, 118, 1711
- Zavala et al. (2012) Zavala J., Balogh M. L., Afshordi N., Ro S., 2012, MNRAS, 426, 3464
- Zonak et al. (2004) Zonak S. G., Charlton J. C., Ding J., Churchill C. W., 2004, The Astrophysical Journal, 606, 196