Recognizing Developers’ Emotions while Programming
Abstract.
Developers experience a wide range of emotions during programming tasks, which may have an impact on job performance. In this paper, we present an empirical study aimed at (i) investigating the link between emotion and progress, (ii) understanding the triggers for developers’ emotions and the strategies to deal with negative ones, (iii) identifying the minimal set of non-invasive biometric sensors for emotion recognition during programming tasks. Results confirm previous findings about the relation between emotions and perceived productivity. Furthermore, we show that developers’ emotions can be reliably recognized using only a wristband capturing the electrodermal activity and heart-related metrics.
Keywords:
Emotion awareness, emotion detection, biometric sensors, empirical software engineering, human factors in software engineering1. Introduction
Software development is an intellectual activity requiring creativity and problem-solving skills, which are influenced by affective states (Graziotin et al. 2014). Previous work shows that positive emotions are beneficial for developers’ well-being and productivity while negative ones lead to poor job performance and are detrimental to the software development process (Graziotin et al. 2018; Khan et al. 2011; Müller and Fritz 2015). Hence, emotion awareness—i.e, the awareness of own and others’ emotions—is regarded as a key to success for software projects (Denning 2012).
Early recognition of negative emotions, such as stress (Mäntylä et al. 2016), frustration (Ford and Parnin 2015), and anger (Gachechiladze et al. 2017) can enable just-in-time corrective actions for developers and team managers, preventing burnout and undesired turnover (Mäntylä et al. 2016). Recent research findings demonstrate that negative emotions can be caused by uneven task distribution, wrong estimation of size and time required to complete an assignment, difficulties solving a complex cognitive task, and obstacles when familiarizing with a new technology or programming language (Ford and Parnin 2015). Information about developers’ emotional state can be leveraged to improve collaborative software development strategies (Guzman and Bruegge 2013). For instance, enriching retrospective meetings with feedback about developers’ emotions can be used to reflect as a team on opportunities for improvement. Thus, we envision the emergence and adoption of tools for enhancing emotion awareness during software development.
In this study, we focus on the identification of the emotions experienced by developers engaged in a programming task. Specifically, we operationalize emotions along the valence and arousal dimensions of the Circumplex Model of affect (Russell 1980). First, we build upon recent research investigating the relation between developers’ emotions and perceived productivity (Graziotin et al. 2015; Müller and Fritz 2015). We formulate our first research question as follows:
RQ1 - What is the range of developers’ emotions during a programming task and to what extent they correlate with their perceived progress? To address RQ1, we perform a study with 23 participants engaged in a programming task. We ask participants to periodically self-report their emotional state and self-assessed progress. We analyze the range of emotions reported and their correlation with perceived progress by fitting a linear-mixed effect model as done in the previous studies (Müller and Fritz 2015; Graziotin et al. 2015).
As a second goal, we aim at discovering the causes of positive and negative emotions experienced during software development. Furthermore, we aim at identifying the coping strategies that might help programmers dealing with negative emotions. As such, we formulate our second research question:
RQ2 - What are the triggers for developers’ emotions and the strategies they implement to deal with negative ones? To address RQ2, we interview the participants at the end of the study and perform manual coding (Martin and Turner 1986) of their answers to open-ended questions.
Previous work demonstrated the feasibility of sensor-based emotion detection using non-invasive biometric devices (Müller and Fritz 2015; Girardi et al. 2017). However, the experimental setting usually employed in a laboratory setting is too complex for being applied in practice. We aim at identifying the minimal set of sensors to wear in the work environment for reliable emotion recognition. Accordingly, we formulate our third research question:
RQ3 - What is the minimal set of non-invasive biometric sensors to recognize developers’ emotions? We use supervised machine learning to train a classifier for developers’ emotions based on biometric features, with different sensor configurations.
The contributions of this work are:
- •
A list of emotional triggers related to software development, including strategies to deal with negative emotions.
- •
A set of supervised classifiers of developers’ emotions. These include, to the best of our knowledge, the first attempt at classifying arousal during a programming tasks.
- •
A lab package11 1 https://figshare.com/articles/conference_contribution/Recognizing_Developers_Emotions_while_Programming/9206474 to verify the results, replicate, and build upon this study.
The reminder of the paper is structured as follows. Section 2 describes the theoretical model we use to operationalize emotions, reviews the existing literature on sensor-based emotion detection, and summarizes the empirical studies we build-upon in this work. In Section 3, we describe the design of this study. In Section 4, we report the analysis results and answer the research questions. In Section 5, we compare our findings with previous work and discuss their implications and limitations. Section 6 concludes the paper.
2. Background
In this section, we introduce the most important theories on modeling emotions and summarize the state of the art on recognizing emotions using biometric sensors. Moreover, we report details about two studies relating emotions to perceived progress in software engineering.
2.1. Emotion Modeling
Psychologists worked on decoding emotions for decades, developing theories based on cognitive psychology and natural language communication. Two theories have emerged. The first poses that a limited set of basic emotions exists. However, there is no consensus about their number or nature (Ekman 1999; Lazarus 1991). The second theory considers emotions as a continuous function of one or more dimensions (Russell 1980). Dimensional models are not influenced by cultural or linguistic factors (Guerini and Staiano 2015; Russell 1991), which makes them more robust compared to discrete models. Consistently with prior research on emotion awareness in software engineering (Müller and Fritz 2015; Graziotin et al. 2015; Mäntylä et al. 2016; Islam and Zibran 2018), we use a continuous representation of developers’ emotions. Specifically, we refer to the Circumplex Model of Affect (see Figure 1), which represents emotions according to two dimensions—valence (pleasant vs. unpleasant) and arousal (activation vs. deactivation). According to this model, each emotion can be considered a “label for a fuzzy set, defined as a class without sharp boundaries” (Russell 1980). Pleasant emotional states, such as happiness, are associated with positive valence, while unpleasant ones, such as sadness, are associated with negative valence. Arousal describes the level of activation of the emotional state ranging from inactive or low, as in calmness or depression, to active or high, as in excitement or tension.

2.2. Sensor-based Emotion Classification
The link between emotions and physiological feedback—measured using biometric sensors—is investigated in the field of affective computing (Kim and André 2008; Koelstra et al. 2012; Soleymani et al. 2016). Among the several physiological measures that correlate with emotions, previous research investigated the electrical activity of the brain (EEG) (Kramer 1990; Reuderink et al. 2013; Soleymani et al. 2016; Li and Lu 2009), the electrical activity of the skin (EDA) (Burleson and Picard 2004; Kapoor et al. 2007), the electrical activity of contracting muscles (EMG) (Koelstra et al. 2012; Nogueira et al. 2013; Girardi et al. 2017), and the blood volume pulse (BVP) from which heart rate (HR) and its variability (HRV) can be derived (Canento et al. 2011; Scheirer et al. 2002).
Specifically, changes in the EEG spectrum provide an indication of overall levels of arousal or alertness (Kramer 1990) as well as pleasantness of the emotion stimulus (Reuderink et al. 2013). For example, Soleymani et al. (Soleymani et al. 2016) found that high-frequencies sensed from electrodes positioned on the frontal, parietal, and occipital lobes have high correlation with valence. Similarly, Li and Lu (Li and Lu 2009) demonstrate that it is possible to discriminate between happiness and sadness based on the analysis of EEG signal.
Concerning EDA, studies in psychology demonstrate how this signal considerably varies with changes in emotional intensity and specifically with the arousal dimension (Lang and Bradley 2007). Changes in EDA are a result of increased activity of the sweat glands, which takes place in presence of emotional arousal and cognitive workload. Hence, EDA has been employed to detect excitement, stress, interest, attention as well as anxiety and frustration (Burleson and Picard 2004; Kapoor et al. 2007).
BVP, HR, and HRV metrics—captured by a plethysmograph—have been successfully employed for emotion recognition (Canento et al. 2011; Scheirer et al. 2002).
Facial EMG is particularly useful in predicting emotions (Koelstra et al. 2012; Nogueira et al. 2013). However, its usage leads to poor results when the sensors are placed on body parts other than the face, such as the arms (Girardi et al. 2017). Accordingly, we exclude EMG from this study.
In this study, we include measures from EEG, EDA, BVP, and HR as they can be collected using low-cost noninvasive sensors (Girardi et al. 2017; Müller and Fritz 2015) that can be comfortably used by developers during programming tasks (see Section 3.3). This choice is in line with current research investigating the use of lightweight biometric sensor for studying human aspects in software development. Fucci et al. (Fucci et al. 2019) use EEG, EDA, and heart-related measurements for the automatic identification of code comprehension tasks. Fritz et al. (Fritz et al. 2014) rely on a combination of EEG, BVP, and eye tracker to assess difficulty in code comprehension and prevent developers from introducing bugs. In a follow-up study, they employ the same set of sensors to distinguish between positive and negative emotions during programming tasks (Müller and Fritz 2015). Similarly, EDA, HR, HRV, and breath-related metrics have been used in a field study to identify code quality concerns during software development (Müller and Fritz 2016). Züeger et al. (Züger et al. 2018) combine heart-related metrics with a wristband activity tracker to predict developers’ interruptibility.
2.3. Former Studies
Our study builds upon the design and results of two former studies linking developers’ emotions with their perceived progress (Graziotin et al. 2015; Müller and Fritz 2015). They follow similar experimental protocols involving a longitudinal study with repeated measures of novice and professional developers’ emotional states. In particular, Graziotin et al. (Graziotin et al. 2015) recruited eight subjects of which four professional developers and four undergraduate students with major in computer science, whereas Müller and Fritz (Müller and Fritz 2015) observed 17 subjects of which six professionals with an average experience of seven years and 11 PhD students in computer science.
In both studies, the participants were observed during a programming session and interrupted every five minutes to answer a self-report survey. Emotions were self-reported along the valence and arousal dimensions. Müller and Fritz measured the self-perceived participants’ progress while completing two programming tasks (30 minutes each). Conversely, Graziotin et al. asked participants to report on perceived productivity while working for 90 minutes in a natural setting—i.e., on their own projects. Graziotin et al. also measured dominance—i.e., the extent to which a subject feels in control or controlled (Bradley and Lang 1994).
The studies of Graziotin et al. (Graziotin et al. 2015) and Müller and Fritz (Müller and Fritz 2015) provide empirical evidence that valence correlates with self-perceived productivity and progress, respectively. Among the main causes for negative emotions, leading to the perception of being stuck, Müller and Fritz report cognitive difficulties, impossibility to fulfill information needs, and code not working. Conversely, being able to understand the code and identify a solution strategy are among the top reasons for positive affect.
Finally, Müller and Fritz trained a supervised emotion classifier able to distinguish between positive and negative emotions with an accuracy of . In their setting, they use multiple sensors including EEG, EDA, HR, and eye tracking metrics. However, they neglect the arousal classification.
3. Study Design
In this section, we report a brief characterization of the participants in our study, the study task, the tools and devices used to measure the relevant constructs, and the study protocol.
3.1. Participants
We recruited 27 CS students (23 males, four females) from the Department of Computer Science of our University of which 21 undergraduates, five graduates, and one post-graduate. Following a convenience sampling strategy, we recruited volunteers as participants only if they could provide evidence they cleared exams where Java programming (e.g., the programming language for the this study task) was used for capstone projects.
3.2. Development Task
We use one of the two tasks, including the materials, designed by Müller and Fritz in their study (Müller and Fritz 2015). The task consisted in writing a Java program using the StackExchange API 22 2 https://api.stackexchange.com to retrieve all answers posted by a specific user on StackOverflow and sum up the scores the user earned for these answers. The participants were provided with a skeleton code which they had to modify to complete the task.
3.3. Measurement Tools and Devices
Biometric sensors. We measure the subjects’ physiological signals using lightweight biometric sensors analogous to those employed by Müeller and Fritz (Müller and Fritz 2015)—i.e., comfortable to wear in the work environment (Girardi et al. 2019). Specifically, we use the NeuroSky BrainLink headset to record the EEG waves and the Empatica E4 wristband for EDA, BVP, and heart-related metrics (see Fig. 2).

The BrainLink EEG uses one electrode placed on the surface of the scalp and a reference placed on the earlobe33 3 The reference electrode is used to compute the amount of information of the active EEG electrode placed on the forehead. As such, it has to be placed on a neutral place like the earlobe (Lei and Liao 2017) (see Figure 2). EEG waves are extracted by pre-processing the raw signal collected by the device with a sample frequency of 512Hz (see Section 4.3). Besides raw EEG signal, BrainLink extracts metrics related to mental focus (i.e., attention) and calmness (i.e, meditation). 44 4 http://developer.neurosky.com/docs/doku.php?id=esenses_tm
The Empatica E4 wristband measures EDA with a sample frequency of 4Hz. It features a plethysmograph for collecting BVP sampled at a frequency of 64Hz. BVP is used to derive the HR and HRV. Following the guidelines provided by the Empatica, support55 5 https://support.empatica.com/hc/en-us/articles/360030058011-E4-data-IBI-expected-signal we decided to exclude HRV as it is not reliable in dynamic conditions (i.e., while typing).
Self-report of Emotions and Progress. The measurement of emotions and perceived progress is performed through experience sampling (Graziotin et al. 2015; Müller and Fritz 2015). In line with the approach implemented by Graziotin et al. (Graziotin et al. 2015), we collect self-reported valence and arousal ratings during interruptions of the development task using Self-Assessment Manikin (SAM) (Bradley and Lang 1994). Consistently with previous assessment of valence and arousal in affective computing research (Koelstra et al. 2012), we use a nine-point scale. Figure 3 shows the SAM mannequins for valence and arousal (top) as well as a 5-point Likert item (bottom) to assess the perceived progress. During the interruptions, we prompt the participant to elaborate on the triggers for the emotional state and take notes of their answers.

Debriefing questionnaire. To elicit triggers and strategies for handling emotions, the first author interviews each participant at the end of the development task, asking the following questions:
- •
What are the causes for positive emotions during programming?
- •
What are the causes for negative emotions during programming?
- •
Which strategies do you adopt to deal with negative emotions?
3.4. Experimental Protocol
We organize the study according to the following phases, as shown in Figure 4.
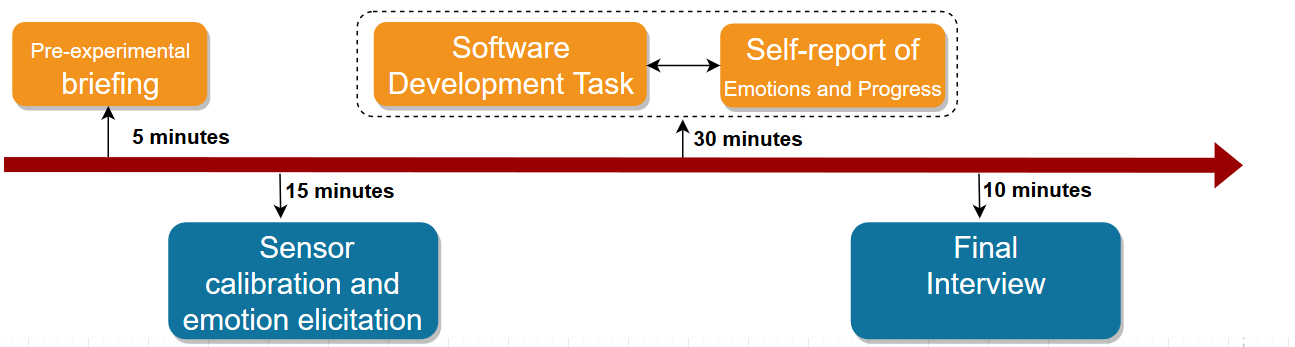
Pre-experimental briefing. The participant gets acquainted with the settings—e.g., sitting in a comfortable position, adjusting the monitor height. The experimenter summarizes the upcoming steps and explains the programming task. The participant signs the consent form to allow anonymous treatment of the collected data.
Sensor calibration and emotion elicitation. The participant wears the biometric sensors (see Figure 2) and the experimenter checks that the devices record the signals correctly.
Before the participant starts working on the actual programming assignment, the experimenter asks her to take part in an emotion-elicitation task. The purpose of this step is two-fold. On one hand, it allows the subject to get acquainted with the SAM mannequins; on the other hand, it allows the experimenter to collect her biometric and SAM feedback, both in a neutral condition and in presence of controlled stimuli. This step follows the design described in a previous emotion-elicitation study (Girardi et al. 2017). The participant watches eight videos, selected from the DEAP dataset (Koelstra et al. 2012), associated with valence and arousal scores on a scale from 1 to 9. Each video is mapped to the four quadrants of the emotional space in the Circumplex Model of Affect based on a discretization of the scores. Specifically, the eight videos used in the emotion elicitation are equally distributed among the four quadrants—i.e., valence and arousal, valence and arousal, valence and arousal, valence and arousal. The emotion elicitation step lasts 10 minutes, with the eight videos presented in four sessions. Each session consists of a 30-second baseline video showing a quiet image with relaxing music in the background, followed by a 2-minute display of the selected videos (one minute per video). At the beginning of each trial, a 3-second screen displays the current trial number to make the participant aware of her progress. After each video, the participant is instructed to report her emotions using the SAM mannequins. Therefore, each subject provided sixteen pairs of ratings—i.e., one valence and one arousal assessment per video.
Prior to the development task, the participant watches a 2-minute relaxing video of a nature scenery to induce relaxation and a neutral emotional state (Rottemberg et al. 2007). We use biometrics recorded when showing such video as physiological baselines for the participants.
Software development task and self-report. The core of the study is a 30-minute development session during which we apply experience sampling (Larson and Csikszentmihalyi 2014). The experimenter (i.e., the first author) observed the behavior of participants during the entire session and interrupted them every five minutes, asking to report their emotions, perceived progress, and to provide information about the reasons for their emotions. We choose a time frame of five minutes as it represents the average time for which developers stay focused on a single task (Meyer et al. 2014; Müller and Fritz 2015). We collect the subjects’ biometrics during the entire duration of the development task. After the task, participants watch again the 2-minutes relaxing video to ward-off possible induced emotions, for example, from not succeeding in solving the task. In total, each participant provides six ratings for valence and six for arousal (i.e., one valence-arousal rating for each interruption). In addition, participants provide six progress ratings (one per interruption). Finally, they provide six answers to the open-ended question about the triggers for reported emotions, which we use in the data quality assurance step.
Final interview. We run the post-experimental debriefing with each participant for approximately 10 minutes. The experimenter interviews participants to investigate i) the triggers for positive and negative emotions during the task, and ii) the strategies subjects implement to deal with negative emotions. The participants could also ask questions and give feedback about the experiment. Finally, participants are rewarded with a voucher for a meal.
Data Quality Assurance. Once the experiment was completed, but before analyzing the data, we manually performed a sanity check of the collected data. In particular, we investigated potential malfunctioning of the sensors which can introduce noise and discontinued recording of raw signals. In addition, we check the consistency of the self-reported valence, arousal, and progress scores with respect to the comments provided in the open questions. We looked for signs of negligence, inconsistencies, and misinterpretation of the guidelines for using the SAM-based report. For example, one subject scored his arousal as eight for all the interruptions, however, this did not match the content of his comments. As a results of this step, we discarded four participants (all males). Our final pool of participants include 23 subjects overall, of which four females.
4. Analysis and Results
In this Section, we answer our research questions by analyzing the data collected in the study using a mix of quantitative and qualitative methods.
4.1. Experienced Range of Emotions and their Correlation with Progress (RQ1)
We analyze the self-reported scores for emotions and progress collected through experience sampling. As described in Section 3.4, each participant provided self-assessment of emotions at each interruption, thus reporting six pairs of SAM-ratings for valence and arousal. As such, our dataset includes ( subjects) ratings for each emotion dimension. Analogously, we collected scores () for progress.
To investigate the range of developers’ emotions during the programming task, we following the approach proposed by Müeller and Fritz (Müller and Fritz 2015). We analyze and compare the emotion scores the developers reported during the programming task and emotion elicitation.

Figure 5 reports the SAM scores for valence and arousal. We use the scores provided during the video-driven emotion elicitation as a reference for the way participants report valence and arousal in presence of the controlled stimulus. For example, the range of SAM scores reported for positive videos indicate how the participants rate their valence when experiencing a positive emotion. We observe that the entire range of emotions is covered by the scores reported while watching videos as well as programming. For valence, we observe a clear distinction between the ranges used for positive and negative videos (Figure 5a). In addition, negative emotions tend to prevail during the programming task—i.e., the median score corresponds to the one reported for the negative videos. Conversely, the median value for the arousal distribution of the programming task (Figure 5b) corresponds to the one reported for high arousal videos.
| Stuck | Neutral | In flow | |||
| Score 1 | Score 2 | Score 3 | Score 4 | Score 5 | |
| 28 (20%) | 59 (43%) | 36 (26%) | 11 (8%) | 4 (3%) | |
| overall | 87 (63%) | 36 (26%) | 15 (11%) | ||
The participants report the whole range of progress (i.e., 1–5), from completely stuck (score equal to 1) to in flow (score equal to 5), with median = 3 and inter-quartile range = 2 (see Table 1). Most developers had troubles solving the task—only four succeeded in developing a complete solution. Accordingly, most of the time they reported being stuck (63% of answers). They reported being in a neutral state 26% of the cases, corresponding to 36 answers, and in flow in 11% of the cases (15 answers).
We investigate the link between reported emotions and perceived progress by fitting a linear mixed model, which is robust in case of repeated measurements and longitudinal data (Gueorguieva and Krystal 2004). To create the model, we used the lme4 R package66 6 https://cran.r-project.org/web/packages/lme4/index.html. Consistently with the approach adopted in the former studies (Müller and Fritz 2015; Graziotin et al. 2015), we consider progress as the dependent variable and valence, arousal, and their interaction with time as fixed effects. Given our study design, we cannot exclude that the perceived progress can be impacted by time. Therefore, time and its interaction with the emotional dimensions are also included in the model. To account for individual differences in the SAM reports, we standardize the valence and arousal using Z-scores (Müller and Fritz 2015; Graziotin et al. 2015).
| Fixed Effects | Estimate | Upper p-value (132 d.f.) | Lower p-value (103 d.f.) | Dev. explained |
|---|---|---|---|---|
| Valence | 0.17 (*) | 0.00 | 0.00 | 27.8% |
| Arousal | -0.05 | 0.23 | 0.23 | 0.5% |
| Time | -0.02 | 0.97 | 0.97 | 0.0% |
| Valence:Time | 0.03 (*) | 0.05 | 0.05 | 1.4% |
| Arousal:Time | 0.02 | 0.24 | 0.25 | 0.48% |
In Table 2, we report the parameter estimation for the mixed-effect model and the percentage deviance explained by each effect. Our model significantly differs from the null model—i.e., the model with no correlation between fixed effects and progress (). We observe a significant effect of valence on progress at 95% confidence level. Valence also shows the highest explanatory power with of deviance explained, compared to observed for the whole model. Conversely, we did not observe any effect of arousal on self-reported progress. This result holds for the effect of time and its interaction with arousal. Our model shows a statistically significant correlation between progress and the interaction between time and valence. However, the effect of such interaction on the overall model is small (1.4% of deviance explained).
4.2. Triggers and Strategies for Emotions (RQ2)
To investigate triggers for emotions, as well as the strategies to deal with negative ones, we manually analyzed the 69 answers provided during the debriefing questionnaire in the final interview, – i.e., three for each participant.
We performed qualitative data analysis using a sentence-by-sentence approach in a semi-exploratory fashion. We applied selective coding (Martin and Turner 1986) based on the constructs associated with the research question (i.e., positive and negative emotions, as well as strategies for coping with the latter). We identified 29 sentences discussing positive emotions triggers, 41 for negative emotions triggers, and 47 for coping strategies. Subsequently, two researchers coded each sentence following an open coding approach (Martin and Turner 1986). During a meeting, the researchers reconciled their codes in a single one. We obtained 23 codes—eight reasons for positive emotions, eight for negative ones, and seven strategies for dealing with negative emotions. These codes were then grouped to form relationships and themes captured by applying axial coding (Martin and Turner 1986). Three themes emerge: self refers to the developers’ dimension, social refers to peers and collaborators, and solution refers to issues with artifacts, design, and implementation of the task.
|
|
| ||||||||||||
|---|---|---|---|---|---|---|---|---|---|---|---|---|---|---|
| Triggers |
|
|
|
| ||||||||||
|
|
|
| |||||||||||
| Strategies |
|
|
|
— |
Table 3 shows the themes identified as the result of the coding process. The most frequent trigger for emotions refers to the solution dimension (25 occurrences overall, of which 14 for positive and 11 for negative). The participants felt particularly happy when able to incrementally implement the designed solution and when believing the solution itself is simple. Analogously, unexpected output, unexpected usage of libraries, and unavailable documentation trigger negative emotions. The most frequent causes for negative valence relate to the self dimension (15 occurrences), with the developers reporting the feeling of being stuck and the awareness of time pressure as the main causes for negative emotions. Finally, the social theme appears with a low frequency as the participants had to complete the programming task by themselves.
As for strategies developers implement to deal with negative emotions, take breaks is the most popular one, immediately followed by look for collaboration—e.g., asking help from peers. Some participants also report changing task and starting over as strategies to regain focus and shift towards positive emotions. Similarly, they indicated changing approach to the solution and decomposing the problem into simpler ones as strategies to gain confidence and react to negative emotions.
4.3. A Minimal Set of Sensors for Classifying Developers’ Emotions (RQ3)
We address RQ3 using a machine learning approach for classifying the participants’ emotions during the development task. Fig.6 shows the machine learning pipeline we implemented to answer this research question.
Dataset The dataset consists of the self-reported emotions of participants during the development task. Each of the 23 participants performed a total of six SAM-based assessments of valence and arousal. As a result, we obtained two datasets of 138 observations, one for valence and one for arousal. Accordingly, we trained two separate classifiers by considering features extracted from the biometric signals associated to each observation, as captured by the sensors.
We define the positive and negative labels for valence, and high and low labels for arousal. For this purpose, we discretize the SAM scores following the approach applied by Müller and Fritz (Müller and Fritz 2015). First, we adjusted the valence and arousal scores based on the mean values reported while watching the emotion-triggering videos. Following such approach, we defined gold labels for valence and arousal by taking into account (and correcting for) fluctuations due to the participants’ subjective interpretation of the SAM scale. Then, we assigned a positive valence label (respectively a high arousal label) to instances with scores above the mean and a negative valence label (respectively a low arousal label) to instances with scores below it. Finally, following the recommendation reported in previous work (Müller and Fritz 2015), we manually inspected 31 observations for valence and 30 for arousal for which we observed scores in the interval. For such cases, two authors manually assigned valence and arousal labels. They obtained a substantial agreement (Viera and Garrett 2005), with and observed agreement . The few disagreement cases (less than five for each dimension) were resolved in a discussion, following a consolidated approach in affective computing research (Basile et al. 2018). At the end of this process, we obtained the distribution reported in Table 4.
| Valence | Positive | Negative | Arousal | High | Low |
|---|---|---|---|---|---|
| 44 (32%) | 94 (68%) | 85 (62%) | 53 (38%) |
Preprocessing and Features extraction Although the biometric signals were recorded during the entire experimental session for all the participants, we only consider the signals recorded in proximity of the stimuli of interest—i.e., the signals collected in the 10 seconds before the subjects were interrupted. This choice is in line with consolidated practices in related research on sensor-based classification of emotional (Müller and Fritz 2015; Girardi et al. 2017) and cognitive states (Fucci et al. 2019) of software developers. To synchronize the measurement of the biometric signals with the emotion self-assessment, we (i) save the timestamp of the interruption (t_interruption), (ii) calculate the timestamp for relevant timeframe for each interruption—i.e., 10 seconds before the self-report (t_start), and (iii) select each signal samples recorded between t_start and t_interruption.
For each participant, we normalize the signals to her baseline using Zscore normalization (Müller and Fritz 2015). The baseline is calculated considering the last 30 seconds of the video used to elicit a neutral state before starting the task (Fritz et al. 2014).
To maximize the signal information and reduce noise caused by movements, we applied multiple filtering techniques. Regarding EEG and BVP, we extract frequency bands using a band-pass filter algorithm at different intervals (Canento et al. 2011). The EEG signal can be decomposed into five waves based on the frequency, namely delta ( 4Hz), theta (4-7,5Hz), alpha (4-12,5Hz), beta (13-30Hz), and gamma ( 30Hz). We apply the filter to extract the distinct cerebral waves as each spectrum might provide different information. The EDA signal is constituted by a tonic component, indicating the level of electrical conductivity of the skin, and a phasic component, representing the phasic changes in electrical conductivity or skin conductance response (SCR) (Braithwaite et al. 2015). We applied the cvxEDA algorithm (Greco et al. 2016) to extract the two components.
| Signal | Features | ||||
| Sensor: Brainlink | |||||
| EEG |
| ||||
| Sensor: Empatica E4 | |||||
| EDA |
| ||||
| BVP |
| ||||
| HR |
| ||||
After signals pre-processing, we extracted the features presented in Table 5, which we use to train our classifiers. We select features based on previous studies using the same signals for machine learning (Müller and Fritz 2015; Girardi et al. 2017; Fucci et al. 2019).
Classification Settings. In line with previous research on biometrics (Fucci et al. 2019; Müller and Fritz 2015; Koelstra et al. 2012), we choose eight popular machine learning algorithms—i.e., Naive Bayes (nb), K-Nearest Neighbor (knn), C4.5-like trees (J48), SVM with linear kernel (svm), Multi-layer Perceptron for neural network (mlp), and Random Forest (rf).

We evaluate our classifiers in two different settings. In the Hold-out setting, we split the gold standard into training (90%) and test (10%) sets using the stratified sampling strategy implemented in the R caret package (Kuhn 2009). We search for the optimal hyper-parameters (Tantithamthavorn et al. 2016; Tantithamthavorn et al. 2019) using leave-one-out cross validation—i.e., the recommended approach for small training sets (Raschka 2018), such as ours. The resulting model is then evaluated on the held-out test set to assess its performance on unseen data. We repeat this process 10 times to further increase the validity of the results. The performance is then evaluated by computing the mean for precision, recall, F-measure, and accuracy over the different runs. This setting is directly comparable to the one implemented by Müller and Fritz (Müller and Fritz 2015), which includes data from the same subject in both training and test sets.
We report a second evaluation setting to assess the classifiers performance on data obtained from unseen developers—i.e., leave-one-subject-out (LOSO). This setting was inspired by previous findings reporting different classification performance due to differences in biometrics between individuals (Müller and Fritz 2015). In this setting, the evaluation on a test set is repeated for 23 times—i.e., the number of subjects in our dataset. At each iteration, we use all the observations from the n-1 participants (i.e., 22) for training the model, and we test the performance on the remaining one.
Classification Performance. In Table 6, for each sensor and their combination, we report the classifier with the highest accuracy, together with its precision, recall, and F-measure. Moreover, we report the result of a trivial classifier always predicting the majority class (i.e., negative for valence and high for arousal) 77 7 The performance for each run for both settings are reported in the ’BestResults’ spreadsheet, in the ’Machine Learning’ folder of the replication package.
In the hold-out setting, we observe substantial improvements over the baseline classifier. The valence classifier distinguishes between negative and positive emotions with an accuracy of . using the full set of sensors. While performance might appear close to the baseline value in terms of accuracy (baseline accuracy = ), looking at precision and recall, we observe that the classifiers behavior is substantially different. In fact, we observe an increase of in precision (from .34 of the baseline to .68 of the classifier) and of (from .50 to .60) in recall, resulting in a increase of the F1-measure (from .41 to .60). The results show that the model trained using the full set of features achieves comparable performance to the one trained using only features extracted from the Empatica E4 device—i.e., EDA, BVP, and HR-related features. We observe a small increase in precision with respect to the full device setting (from in the full set to with Empatica) and a small decrease in recall (from to ). These results suggest that valence can be reliably detected using only the Empatica E4 wristband. The features associated to the Brainlink EEG helmet negligibly impact the classifiers performance.
For arousal, our best classifier distinguishes between high and low emotion activation with an accuracy of . The model trained using the full set of features substantially outperforms the baseline in terms of precision (, from to ), recall (, from to ), and F1-measure (, from to ). Similarly to what observed for valence, the performance obtained with the full set of sensors is comparable to the one obtained with the Empatica E4 wristband only, which also achieves a better precision.
|
| |||||||||||||||||
| Valence | ||||||||||||||||||
| Devices | Alg. | Prec | Rec | F1 | Accuracy | stdev | Alg. | Prec | Rec | F1 | Accuracy | stdev | ||||||
| Full set | knn | .68 (+.34) | .60 (+.10) | .60 (+.19) | .72 (+.04) | .12 | svm | .48 (+.14) | .62 (+.12) | .53 (+.12) | .69 (+.01) | .25 | ||||||
| Empatica | knn | .70 (+.36) | .59 (+.09) | .59 (+.18) | .71 (+.03) | .07 | svm | .45 (+.11) | .61 (+.11) | .50 (+.09) | .68 (–) | .27 | ||||||
| Brainlink | rf | .54 (+.20) | .54 (+.04) | .52 (+.11) | .66 (-.02) | .07 | mlp | .66 (+.32) | .64 (+.14) | .64 (+.23) | .71 (+.03) | .22 | ||||||
| Baseline | .34 | .50 | .41 | .68 | – | |||||||||||||
| Arousal | ||||||||||||||||||
| Full set | rf | .62 (+.31) | .61 (+.11) | .59 (+.21) | .65 (+.04) | .05 | svm | .46 (+.15) | .59 (+.09) | .50 (+.12) | .61 (+.05) | .25 | ||||||
| Empatica | knn | .67 (+.36) | .58 (+.08) | .55 (+.17) | .65 (+.04) | .10 | J48 | .40 (+.09) | .59 (+.09) | .49 (+.11) | .62 (–) | .25 | ||||||
| Brainlink | rf | .66 (+.35) | .59 (+.09) | .58 (+.20) | .63 (+.01) | .12 | nb | .62 (+.31) | .63 (+.13) | .61 (+.23) | .63 (+.01) | .17 | ||||||
| Baseline | .31 | .50 | .38 | .62 | – | |||||||||||||
The LOSO setting results are similar, for both valence and arousal, to the ones reported in the hold-out settings. However, we observe variability for the individual performance on each test set as suggested by the higher standard deviation compared to the hold-out setting. These results provide evidence that biometrics are good predictors for emotions, although we observed variability between individuals.
5. Discussion
In this section, we compare our findings with related studies, highlight their implications for researchers and practitioners, and report the threats to their validity.
5.1. Comparison with Related Studies
Emotions as a proxy for progress. The analysis of the scores reported by the participants in our study during the programming task shows a prevalence of negative valence and high arousal. This result contrasts with the findings of Müller and Fritz (Müller and Fritz 2015) who observed that the distribution of emotions reported when programming is comparable to the one reported when watching emotion-triggering pictures. The prevalence of emotion with negative valence and high arousal in our study can be explained by our participants being less experienced. In previous work, Mäntylä et al. (Mäntylä et al. 2016) presents evidence that novice developers are more inclined to negative valence and high arousal. Furthermore, experience is negatively correlated with effort—i.e., more experienced developers need less effort to complete a task (Kuutila et al. 2019; Mäntylä et al. 2014).
The lower level of experience of our participants can be seen in their actual and perceived progress. In fact, the majority reported being either stuck or completely stuck (63% of self-report questionnaires filled-in during the interruptions). Conversely, they reported either being in flow or neutral in only 11% and 26% of cases, respectively. These results are consistent with the fact that only 4 over 23 participants completed the task. In contrast, Müller and Fritz (Müller and Fritz 2015) reports a more balanced distribution of progress, with the majority of participants feeling in flow (39%) rather than stuck (37%) or neutral (24%).
The results of the linear mixed model in our study are comparable to those reported in Müller and Fritz (Müller and Fritz 2015). We confirm that valence is positively correlated with perceived progress and that it is the main variable explaining the model deviance. Moreover, we did not show a significant relationship between productivity and arousal. Both results confirm a previous study by Graziotin et al. (Graziotin et al. 2015). The positive relationship between valence and progress is consistent with the findings of Mäntylä et al. (Mäntylä et al. 2016) who observed positive emotions when resolving issues in the tracking system (i.e., emotions as a proxy for progress). The same study shows low variability in arousal supporting the lack of correlation between this emotional dimension and progress observed in our study.
Causes for negative emotions and coping strategies. We confirm previous evidence on the causes of negative emotions and how developers deal with them to regain focus and positive emotions. Being stuck and working under time pressure emerged as the most frequent causes for negative emotions. Fear of failure was already reported as a cause for frustration in software development (Ford and Parnin 2015). Similarly, the detrimental impact of limited time on self-confidence, well-being, and emotional states was already observed (Kuutila et al. 2019; Ford and Parnin 2015).
Technical difficulties (e.g., unexpected usage of libraries or unexpected output of code) and unfulfilled information needs (e.g., unavailable documentation) also emerge as causes for negative feelings. This is consistent with previous investigations of emotions (Ford and Parnin 2015; Müller and Fritz 2015) and confusion (Ebert et al. 2019) in software development. Previous findings suggest that early detection of confusion is crucial for preventing burnout and loss of productivity. Moreover, they demonstrates how confusion arises due to lack of documentation (Ebert et al. 2019), in presence of unexpected code behavior (Ebert et al. 2019), and bugs (Mäntylä et al. 2016).
We also show that facing new challenges is a trigger for positive emotions, in line with previous work showing that the development of new features causes more positive emotions than bug fixing (Mäntylä et al. 2016). Similarly, having new ideas and being in flow while programming is shown to be associated with positive emotions (Müller and Fritz 2015).
A Minimal Set of Biometrics for Emotion Classification. On top of confirming Müller and Fritz (Müller and Fritz 2015) findings regarding the usage of non-invasive sensors for valence recognition, we also addressed the classification of the arousal dimension. As a novel finding, we identified the minimum set of sensors—EDA, BVP, and HR measured using the Empatica E4 wristband—that can be used in an experimental protocol for detecting emotions during software development tasks.
Using machine learning, we are able to distinguish between positive and negative valence. Using only the Empatica E4 wristband, the performance are comparable to ones obtained using the full sensors settings (i.e., wristband + EEG helmet). Our accuracy () is comparable to the one () reported by Müeller and Fritz (Müller and Fritz 2015). However, their results are obtained using features from an EEG helmet in combination with HR, and pupil size captured by an eye-tracker.
For arousal classification, our best classifier achieves an accuracy of using only features from the Empatica E4 wristband. The accuracy of our classifiers is comparable to the one () reported by Koelstra et al. (Koelstra et al. 2012) for arousal classification using a 32-electrode EEG helmet. Moreover, they show an accuracy of for valence by combining EDA, EMG on facial muscles, features derived from respiration, blood pressure, and eye blinking rate. We outperform their classifiers using a minimal set of features obtained using the Empatica E4 wristband.
Compared to ours, other studies show better performance—e.g., accuracy for arousal of (Soleymani et al. 2015; Chen et al. 2015; García et al. 2016) and for valence (Nogueira et al. 2013). However, these studies rely on high-definition EEG helmets (Soleymani et al. 2015; Chen et al. 2015; García et al. 2016) and facial electrodes for EMG (Nogueira et al. 2013). Such sensors are invasive and cannot be used outside of a laboratory setting—e.g., in the work environment.
5.2. Implications
Implication for researchers The results of this study provides evidence that we can recognize developers’ emotions, while programming, by means of a minimal set of biometric features using the sensors mounted on a single wearable device (the Empatica E4 wristband). This opens up the possibility of further studies aimed at improving the ecological validity of our findings.
Our results show between-subject variability of biometrics, already observed in previous studies (Müller and Fritz 2015). The higher standard deviation for accuracy in the LOSO setting can be problematic when classifying the emotions of a new unseen developer. Further studies with a wider pool of participants are required to assess the robustness of our valence and arousal classifiers. Such studies can investigate to what extent we can build more robust classifiers by performing preliminary subject-based calibration—e.g., by tuning the models based on individuals’ biometrics collected while exposing participants to emotional stimuli in a controlled setting. Future studies can identify the amount of biometric data required to fine-tune the models for a reliable classification of emotions of new subjects.
The correlation between valence and progress can be interpreted as a proxy for self-perceived productivity. However, further investigation is required to (i) provide an explanation for the results of our correlation study, and (ii) understand whether a causal relation exists between emotions and productivity (or vice-versa)—e.g., using emotion-triggering techniques in a controlled setting, in line with previous research (Khan et al. 2011).
Implication for practitioners and tool builders. We show that emotions can be detected using non-invasive wearable device, such as a wristband. This finding paves the way for tools and practices to prevent developers’ distress and burnout.
Early recognition of negative emotions, integrated with the development environment, can be leveraged to suggest corrective actions. Developers can regain focus and restore positive moods in accordance with the strategies we observed in this study to cope with negative emotions.
Our results demonstrate a positive correlation between valence and progress, suggesting that emotions might act as a proxy for productivity. For example, positive emotions can indicate that a developer is in flow and should not be disturbed. Hence, sensor-based emotion classifiers can improve state-of-the-art approaches for the automatic assessment of interruptibility (Züger et al. 2018). Similarly, the identification of negative emotions can indicate a stuck developer requiring support fulfilling her information needs. Accordingly, an emotion-aware component integrated in the development environment can recommend relevant colleagues to consult on the code base (Kavaler et al. 2019) or trigger utilities for on-demand documentation generation (Robillard et al. 2017).
Biometrics can enhance retrospective meetings by including emotional information collected day-to-day rather than at the end of an iteration or sprint. The team can better identify what are the activities and events that relate to positive and negative emotions (Girardi et al. 2019).
5.3. Threats to Validity
In this section, we report the threats to the validity in increasing order of priority for the in vitro nature of this study, following the recommendations of Wohlin et al. (Wohlin et al. 2012).
External validity Threats to external validity relate to the generalizability of the results. We chose the same task used in a former study (Müller and Fritz 2015), which simulated a new problem in a real scenario. Regarding participants, we covered different levels of academic experience (by including Bachelors, Masters, and PhD students) but with less professional experience compared to (Müller and Fritz 2015).
Conclusion validity The validity of our conclusions relies on the robustness of the generalized linear model and machine learning models. We mitigated such threat by (i) running several algorithms addressing the same classification task, (ii) applying hyper-parameters tuning to optimally solve the task, and i(iii) reporting results from two different evaluation settings—i.e., Hold-out and LOSO.
Construct validity Our study suffers from threats to construct validity—i.e., the reliability of our measures in capturing emotions and progress. When assessing the impact of arousal on progress, we did not observe a significant correlation. Although we cannot exclude that such result is due to the unreliability of the self-reported rating, we performed data quality assurance and did not consider participants who misinterpreted the concept of arousal—e.g., who reported always the same score also during emotion elicitation.
Internal validity Threats to internal validity concern confounding factors that can influence the results. We collected data in a laboratory setting. Factors existing in our settings, such as the presence of the experimenter and the absence of real consequences when failing or succeeding in the task, can influence the triggered emotions—e.g., negative emotions due to the feeling of being observed or judged. In addition, interrupting developers during the task can have interfered with their work and elicited negative emotions. We mitigate this threat by interrupting the developers when we notice a task switch (e.g., opening a new browser window) in proximity of the five-minutes interval.
6. Conclusion
We investigated the range and triggers of emotions experienced by software developers during a programming task. We confirm the link between emotions and self-reported progress observed in previous studies.
Using EDA and heart-related metrics collected using a wristband, we trained a machine learning classifier that can accurately recognize valence. A second classifier, trained to recognized arousal, has shown less successful but encouraging results.
Our results can stimulate future in-vivo research (i.e., in software development companies) and the collection of biometrics to explore emotions during the entire working day, when developers are involved in different activities, not just programming. Furthermore, observing developers at the workplace also opens opportunities to build more sophisticated classifiers, which are able to identify, for example, the bad days (i.e., when mostly negative emotions are identified) or negative working conditions of developers (i.e., when negative emotions are observed over a long period of time).
References
- (1)
- Basile et al. (2018) Valerio Basile, Nicole Novielli, Danilo Croce, Francesco Barbieri, Malvina Nissim, and Viviana Patti. 2018. Sentiment Polarity Classification at EVALITA: Lessons Learned and Open Challenges. IEEE Transactions on Affective Computing (2018). https://doi.org/10.1109/TAFFC.2018.2884015
- Bradley and Lang (1994) Margaret M. Bradley and Peter J. Lang. 1994. Measuring emotion: The self-assessment manikin and the semantic differential. Journal of Behavior Therapy & Experimental Psychiatry 25, 1 (1994), 49–59. https://doi.org/10.1016/0005-7916(94)90063-9
- Braithwaite et al. (2015) Jason J. Braithwaite, Derrick G. Watson, Robert Jones, and Mickey Rowe. 2015. A Guide for Analysing Electrodermal Activity (EDA) & Skin Conductance Responses (SCRs) for Psychological Experiments. Technical Report. University of Birmingham, UK.
- Burleson and Picard (2004) Winslow Burleson and Rosalind W. Picard. 2004. Affective agents: Sustaining motivation to learn through failure and state of "stuck". In Social and Emotional Intelligence in Learning Environments Workshop. In conjunction with the 7th International Conference on Intelligent Tutoring Systems, Maceio.
- Canento et al. (2011) Filipe Canento, Ana Fred, Hugo Silva, Hugo Gamboa, and André Lourenço. 2011. Multimodal biosignal sensor data handling for emotion recognition. In SENSORS. IEEE, 647–650. https://doi.org/10.1109/ICSENS.2011.6127029
- Chen et al. (2015) Mo Chen, Junwei Han, Lei Guo, Jiahui Wang, and Ioannis Patras. 2015. Identifying valence and arousal levels via connectivity between EEG channels. In 2015 International Conference on Affective Computing and Intelligent Interaction, ACII 2015, Xi’an, China, September 21-24, 2015. 63–69. https://doi.org/10.1109/ACII.2015.7344552
- Denning (2012) Peter J. Denning. 2012. Moods. Commun. ACM 55, 12 (Dec. 2012), 33–35. https://doi.org/10.1145/2380656.2380668
- Ebert et al. (2019) Felipe Ebert, Fernando Castor, Nicole Novielli, and Alexander Serebrenik. 2019. Confusion in Code Reviews: Reasons, Impacts, and Coping Strategies. In 26th IEEE International Conference on Software Analysis, Evolution and Reengineering, SANER 2019, Hangzhou, China, February 24-27, 2019. 49–60. https://doi.org/10.1109/SANER.2019.8668024
- Ekman (1999) Paul Ekman. 1999. Basic Emotions. Handbook of Cognition and Emotion. John Wiley and Sons Ltd.
- Ford and Parnin (2015) Denae Ford and Chris Parnin. 2015. Exploring Causes of Frustration for Software Developers. In 8th IEEE/ACM International Workshop on Cooperative and Human Aspects of Software Engineering, CHASE 2015, Florence, Italy, May 18, 2015. 115–116. https://doi.org/10.1109/CHASE.2015.19
- Fritz et al. (2014) Thomas Fritz, Andrew Begel, Sebastian C. Müller, Serap Yigit-Elliott, and Manuela Züger. 2014. Using psycho-physiological measures to assess task difficulty in software development. In 36th International Conference on Software Engineering, ICSE ’14, Hyderabad, India - May 31 - 7 June, 2014. 402–413. https://doi.org/10.1145/2568225.2568266
- Fucci et al. (2019) Davide Fucci, Daniela Girardi, Nicole Novielli, Luigi Quaranta, and Filippo Lanubile. 2019. A replication study on code comprehension and expertise using lightweight biometric sensors. In Proceedings of the 27th International Conference on Program Comprehension, ICPC 2019, Montreal, QC, Canada, May 25-31, 2019. 311–322. https://dl.acm.org/citation.cfm?id=3339126
- Gachechiladze et al. (2017) Daviti Gachechiladze, Filippo Lanubile, Nicole Novielli, and Alexander Serebrenik. 2017. Anger and Its Direction in Collaborative Software Development. In 39th IEEE/ACM International Conference on Software Engineering: New Ideas and Emerging Technologies Results Track, ICSE-NIER 2017, Buenos Aires, Argentina, May 20-28, 2017. 11–14. https://doi.org/10.1109/ICSE-NIER.2017.18
- García et al. (2016) Hernán F. García, Mauricio A. Álvarez, and Álvaro Á. Orozco. 2016. Gaussian process dynamical models for multimodal affect recognition. In 38th Annual International Conference of the IEEE Engineering in Medicine and Biology Society, EMBC 2016, Orlando, FL, USA, August 16-20, 2016. 850–853. https://doi.org/10.1109/EMBC.2016.7590834
- Girardi et al. (2017) Daniela Girardi, Filippo Lanubile, and Nicole Novielli. 2017. Emotion detection using noninvasive low cost sensors. In Seventh International Conference on Affective Computing and Intelligent Interaction, ACII 2017, San Antonio, TX, USA, October 23-26, 2017. 125–130. https://doi.org/10.1109/ACII.2017.8273589
- Girardi et al. (2019) Daniela Girardi, Filippo Lanubile, Nicole Novielli, Luigi Quaranta, and Alexander Serebrenik. 2019. Towards Recognizing the Emotions of Developers Using Biometrics: The Design of a Field Study. In Proceedings of the 4th International Workshop on Emotion Awareness in Software Engineering, SEmotion@ICSE 2019, Montreal, QC, Canada, May 28, 2019. 13–16. https://doi.org/10.1109/SEmotion.2019.00010
- Graziotin et al. (2018) Daniel Graziotin, Fabian Fagerholm, Xiaofeng Wang, and Pekka Abrahamsson. 2018. What happens when software developers are (un)happy. Journal of Systems and Software 140 (2018), 32–47. https://doi.org/10.1016/j.jss.2018.02.041
- Graziotin et al. (2014) Daniel Graziotin, Xiaofeng Wang, and Pekka Abrahamsson. 2014. Happy software developers solve problems better: psychological measurements in empirical software engineering. PeerJ 2 (2014), e289. https://doi.org/10.7717/peerj.289
- Graziotin et al. (2015) Daniel Graziotin, Xiaofeng Wang, and Pekka Abrahamsson. 2015. Do feelings matter? On the correlation of affects and the self-assessed productivity in software engineering. Journal of Software: Evolution and Process 27, 7 (2015), 467–487. https://doi.org/10.1002/smr.1673
- Greco et al. (2016) Alberto Greco, Gaetano Valenza, Antonio Lanata, Enzo Pasquale Scilingo, and Luca Citi. 2016. cvxEDA: A Convex Optimization Approach to Electrodermal Activity Processing. IEEE Transactions on Biomedical Engineering 63, 4 (April 2016), 797–804. https://doi.org/10.1109/TBME.2015.2474131
- Gueorguieva and Krystal (2004) Ralitza Gueorguieva and Jhon H. Krystal. 2004. Move over ANOVA: progress in analyzing repeated-measures data and its reflection in papers published in the Archives of General Psychiatry. Archives of general psychiatry 61, 3 (2004), 310–317. https://doi.org/10.1001/archpsyc.61.3.310
- Guerini and Staiano (2015) Marco Guerini and Jacopo Staiano. 2015. Deep Feelings: A Massive Cross-Lingual Study on the Relation between Emotions and Virality. In Proceedings of the 24th International Conference on World Wide Web Companion, WWW 2015, Florence, Italy, May 18-22, 2015 - Companion Volume. 299–305. https://doi.org/10.1145/2740908.2743058
- Guzman and Bruegge (2013) Emitza Guzman and Bernd Bruegge. 2013. Towards Emotional Awareness in Software Development Teams. In Joint Meeting of the European Software Engineering Conference and the ACM SIGSOFT Symposium on the Foundations of Software Engineering, ESEC/FSE’13, Saint Petersburg, Russian Federation, August 18-26, 2013. 671–674. https://doi.org/10.1145/2491411.2494578
- Islam and Zibran (2018) Md Rakibul Islam and Minhaz F. Zibran. 2018. DEVA: Sensing Emotions in the Valence Arousal Space in Software Engineering Text. In Proceedings of the 33rd Annual ACM Symposium on Applied Computing, SAC 2018, Pau, France, April 09-13, 2018. ACM, New York, NY, USA, 1536–1543. https://doi.org/10.1145/3167132.3167296
- Kapoor et al. (2007) Ashish Kapoor, Winslow Burleson, and Rosalind W. Picard. 2007. Automatic Prediction of Frustration. International Journal Human-Computer Studies 65, 8 (Aug. 2007), 724–736. https://doi.org/10.1016/j.ijhcs.2007.02.003
- Kavaler et al. (2019) David Kavaler, Premkumar T. Devanbu, and Vladimir Filkov. 2019. Whom Are You Going to Call?: Determinants of @-Mentions in GitHub Discussions. Empirical Software Engineering (2019), 1–29. https://doi.org/10.1007/s10664-019-09728-3
- Khan et al. (2011) Iftikhar Ahmed Khan, Willem-Paul Brinkman, and Robert M. Hierons. 2011. Do moods affect programmers’ debug performance? Cognition, Technology & Work 13, 4 (2011), 245–258. https://doi.org/10.1007/s10111-010-0164-1
- Kim and André (2008) Jonghwa Kim and Elisabeth André. 2008. Emotion Recognition Based on Physiological Changes in Music Listening. IEEE Transactions on Pattern Analysis and Machine Intelligence 30, 12 (2008), 2067–2083. https://doi.org/10.1109/TPAMI.2008.26
- Koelstra et al. (2012) Sander Koelstra, Christian Mühl, Mohammad Soleymani, Jong-Seok Lee, Ashkan Yazdani, Touradj Ebrahimi, Thierry Pun, Anton Nijholt, and Ioannis Patras. 2012. DEAP: A Database for Emotion Analysis Using Physiological Signals. IEEE Transaction on Affective Computing 3, 1 (2012), 18–31. https://doi.org/10.1109/T-AFFC.2011.15
- Kramer (1990) Arthur E. Kramer. 1990. Physiological Metrics of Mental Workload: A Review of Recent Progress. https://doi.org/10.21236/ada223701
- Kuhn (2009) Max Kuhn. 2009. The caret Package. http://topepo.github.io/caret/index.html.
- Kuutila et al. (2019) Miikka Kuutila, Mika Mäntylä, Umar Farooq, and Maëlick Claes. 2019. Time Pressure in Software Engineering: A Systematic Literature Review. CoRR abs/1901.05771 (2019). arXiv:1901.05771 http://arxiv.org/abs/1901.05771
- Lang and Bradley (2007) Peter J. Lang and Margaret Bradley. 2007. The International Affective Picture System (IAPS) in the Study of Emotion and Attention. In Handbook of Emotion Elicitation and Attention, James A. Coan and Jhon J. B. Allen (Eds.). Oxford University Press, Chapter 2, 29–46.
- Larson and Csikszentmihalyi (2014) Reed Larson and Mihaly Csikszentmihalyi. 2014. The Experience Sampling Method. Springer Netherlands, Dordrecht, 21–34. https://doi.org/10.1007/978-94-017-9088-8_2
- Lazarus (1991) Richard S. Lazarus. 1991. Emotion and Adaptation. Oxford University Press USA.
- Lei and Liao (2017) Xu Lei and Keren Liao. 2017. Understanding the Influences of EEG Reference: A Large-Scale Brain Network Perspective. Front Neurosci. 11, 205 (2017). https://doi.org/10.3389/fnins.2017.00205
- Li and Lu (2009) Mu Li and Bao-Liang Lu. 2009. Emotion classification based on gamma-band EEG. In 2009 Annual International Conference of the IEEE Engineering in Medicine and Biology Society. 1223–1226. https://doi.org/10.1109/IEMBS.2009.5334139
- Mäntylä et al. (2016) Mika Mäntylä, Bram Adams, Giuseppe Destefanis, Daniel Graziotin, and Marco Ortu. 2016. Mining valence, arousal, and dominance: possibilities for detecting burnout and productivity?. In Proceedings of the 13th International Conference on Mining Software Repositories, MSR 2016, Austin, TX, USA, May 14-22, 2016. 247–258. https://doi.org/10.1145/2901739.2901752
- Mäntylä et al. (2014) Mika Mäntylä, Kai Petersen, Timo O. A. Lehtinen, and Casper Lassenius. 2014. Time Pressure: A Controlled Experiment of Test Case Development and Requirements Review. In 36th International Conference on Software Engineering, ICSE ’14, Hyderabad, India - May 31 - June 07, 2014. 83–94. https://doi.org/10.1145/2568225.2568245
- Martin and Turner (1986) Patricia Y. Martin and Barry A. Turner. 1986. Grounded Theory and Organizational Research. The Journal of Applied Behavioral Science 22, 2 (1986), 141–157. https://doi.org/10.1177/002188638602200207
- Meyer et al. (2014) André N. Meyer, Gail C. Murphy, Thomas Fritz, and Thomas Zimmermann. 2014. Software Developers’ Perceptions of Productivity. In Proceedings of the 22nd ACM SIGSOFT International Symposium on Foundations of Software Engineering, (FSE-22), Hong Kong, China, November 16 - 22, 2014. ACM, New York, NY, USA, 19–29. https://doi.org/10.1145/2635868.2635892
- Müller and Fritz (2015) Sebastian C. Müller and Thomas Fritz. 2015. Stuck and Frustrated or in Flow and Happy: Sensing Developers’ Emotions and Progress. In 37th IEEE/ACM International Conference on Software Engineering, ICSE 2015, Florence, Italy, May 16-24, 2015. 688–699. https://doi.org/10.1109/ICSE.2015.334
- Müller and Fritz (2016) Sebastian C. Müller and Thomas Fritz. 2016. Using (bio)metrics to predict code quality online. In Proceedings of the 38th International Conference on Software Engineering, ICSE 2016, Austin, TX, USA, May 14-22, 2016. 452–463. https://doi.org/10.1145/2884781.2884803
- Nogueira et al. (2013) Pedro A. Nogueira, Rui A. Rodrigues, Eugénio C. Oliveira, and Lennart E. Nacke. 2013. A Hybrid Approach at Emotional State Detection: Merging Theoretical Models of Emotion with Data-Driven Statistical Classifiers. In 2013 IEEE/WIC/ACM International Conferences on Intelligent Agent Technology, IAT 2013, 17-20 November 2013, Atlanta, Georgia, USA. IEEE, 253–260. https://doi.org/10.1109/WI-IAT.2013.117
- Raschka (2018) Sebastian Raschka. 2018. Model Evaluation, Model Selection, and Algorithm Selection in Machine Learning. CoRR abs/1811.12808 (2018). arXiv:1811.12808 http://arxiv.org/abs/1811.12808
- Reuderink et al. (2013) Boris Reuderink, Christian Mühl, and Mannes Poel. 2013. Valence, Arousal and Dominance in the EEG During Game Play. International Journal of Autonomous and Adaptive Communications Systems 6, 1 (2013), 45–62. https://doi.org/10.1504/IJAACS.2013.050691
- Robillard et al. (2017) Martin P. Robillard, Andrian Marcus, Christoph Treude, Gabriele Bavota, Oscar Chaparro, Neil A. Ernst, Marco Aurélio Gerosa, Michael W. Godfrey, Michele Lanza, Mario Linares Vásquez, Gail C. Murphy, Laura Moreno, David C. Shepherd, and Edmund Wong. 2017. On-demand Developer Documentation. In 2017 IEEE International Conference on Software Maintenance and Evolution, ICSME 2017, Shanghai, China, September 17-22, 2017. 479–483. https://doi.org/10.1109/ICSME.2017.17
- Rottemberg et al. (2007) Jonathan Rottemberg, Rebecca D. Ray, and James J. Gross. 2007. Emotion Elicitation Using Films. In Handbook of Emotion Elicitation and Assesment, James Coan and Jhon J.B. Allen (Eds.). Oxford University Press, Chapter 1, 9–28.
- Russell (1980) James Russell. 1980. A Circumplex Model of Affect. Journal of Personality and Social Psychology 39 (1980), 1161–1178. https://doi.org/10.1037/h0077714
- Russell (1991) James Russell. 1991. Culture and the categorization of emotions. Psychological Bulletin 110 (3) (1991), 426–450. https://doi.org/10.1037/0033-2909.110.3.426
- Scheirer et al. (2002) Jocelyn Scheirer, Raul Fernandez, Jonathan Klein, and Rosalind W. Picard. 2002. Frustrating the user on purpose: a step toward building an affective computer. Interacting with Computers 14 (2002), 93–118. https://doi.org/10.1016/S0953-5438(01)00059-5
- Soleymani et al. (2016) Mohammad Soleymani, Sadjad Asghari-Esfeden, Yun Fu, and Maja Pantic. 2016. Analysis of EEG Signals and Facial Expressions for Continuous Emotion Detection. IEEE Transaction on Affective Computing 7, 1 (2016), 17–28. https://doi.org/10.1109/TAFFC.2015.2436926
- Soleymani et al. (2015) Mohammad Soleymani, Maja Pantic, and Thierry Pun. 2015. Multimodal emotion recognition in response to videos (Extended abstract). In 2015 International Conference on Affective Computing and Intelligent Interaction, ACII 2015, Xi’an, China, September 21-24, 2015. 491–497. https://doi.org/10.1109/ACII.2015.7344615
- Tantithamthavorn et al. (2016) Chakkrit Tantithamthavorn, Shane McIntosh, Ahmed E. Hassan, and Kenichi Matsumoto. 2016. Automated parameter optimization of classification techniques for defect prediction models. In Proceedings of the 38th International Conference on Software Engineering, ICSE 2016, Austin, TX, USA, May 14-22, 2016. 321–332. https://doi.org/10.1145/2884781.2884857
- Tantithamthavorn et al. (2019) Chakkrit Tantithamthavorn, Shane McIntosh, Ahmed E. Hassan, and Kenichi Matsumoto. 2019. The impact of automated parameter optimization on defect prediction models. IEEE Transactions on Software Engineering 45, 7 (July 2019), 683–711. https://doi.org/10.1109/TSE.2018.2794977
- Viera and Garrett (2005) Anthony Viera and Joanne Garrett. 2005. Understanding Interobserver Agreement: The Kappa Statistic. Family medicine 37, 5 (2005), 360–363.
- Wohlin et al. (2012) Claes Wohlin, Per Runeson, Martin Höst, Magnus C. Ohlsson, and Björn Regnell. 2012. Experimentation in software engineering. Springer Science & Business Media. https://doi.org/10.1007/978-3-642-29044-2
- Züger et al. (2018) Manuela Züger, Sebastian C. Müller, André N. Meyer, and Thomas Fritz. 2018. Sensing Interruptibility in the Office: A Field Study on the Use of Biometric and Computer Interaction Sensors. In Proceedings of the 2018 CHI Conference on Human Factors in Computing Systems, (CHI 2018). 591. https://doi.org/10.1145/3173574.3174165