Split superconducting and time-reversal symmetry-breaking transitions, and magnetic order in Sr2RuO4 under uniaxial stress
Abstract
Among unconventional superconductors, Sr2RuO4 has become a benchmark for experimentation and theoretical analysis because its normal-state electronic structure is known with exceptional precision, and because of experimental evidence that its superconductivity has, very unusually, a spontaneous angular momentum, i.e. a chiral state. This hypothesis of chirality is however difficult to reconcile with recent evidence on the spin part of the order parameter. Measurements under uniaxial stress offer an ideal way to test for chirality, because under uniaxial stress the superconducting and chiral transitions are predicted to split, allowing the empirical signatures of each to be identified separately. Here, we report zero-field muon spin relaxation (ZF-SR) measurements on crystals placed under uniaxial stresses of up to 1.05 GPa. We report a clear stress-induced splitting between the onset temperatures of superconductivity and time-reversal symmetry breaking, consistent with qualitative expectations for chiral superconductivity. We also report the appearance of unexpected bulk magnetic order under a uniaxial stress of 1.0 GPa in clean Sr2RuO4.
I Introduction
Superconductors are classified as conventional or unconventional on the basis of whether the phase of the order parameter is isotropic in momentum space or not. Unconventional superconductivity, with sign changes in the order parameter, can have higher critical temperatures because it can be mediated by repulsive interactions that do not work in opposition to Coulomb repulsion. A very small fraction of unconventional superconductors break time reversal symmetry, in other words, have imaginary components in their order parameters. Introducing imaginary components can increase the condensation energy by filling in gap nodes, but also frustrates the pairing interaction: scattering between sections of Fermi surface where the phase of the order parameter differs by does not contribute to the condensation energy. Because superconductivity is exponentially sensitive to scattering strength, it is in general surprising when time-reversal symmetry breaking (TRSB) order parameters are favored. The origin of the superconductivity in one famous candidate for TRSB superconductivity, Sr2RuO4, remains a mystery despite 25 years of intense research Maeno et al. 1994.
There is evidence that the superconductivity of Sr2RuO4 is chiral. A nonzero Kerr rotation is observed below the critical temperature Xia et al. 2006, and the phenomenology of junctions between Sr2RuO4 and conventional superconductors offers compelling evidence for domains in the superconducting state Kidwingira et al. 2006; Nakamura et al. 2012; Anwar et al. 2013. For most of the history of Sr2RuO4 evidence for chirality has been understood in terms of an odd-parity order parameter with equal spin pairing in the RuO2 planes: Mackenzie and Maeno 2003; Maeno et al. 2012; Kallin 2012; Mackenzie et al. 2017. More recent evidence, especially a revision in NMR data, points to even-parity pairing, as in the vast majority of known superconductors Pustogow et al. 2019; Ishida et al. 2019; Steppke et al. 2017. Reconciling even parity with chirality and the tetragonal lattice symmetry of Sr2RuO4 compels consideration of a order parameter. Under conventional understanding this is an unexpected order parameter, because the line node at appears to imply pairing of carriers between layers, while Sr2RuO4 is a layered metal with very low interlayer conductivity Mackenzie and Maeno 2003. Indeed, the evidence on chirality is mixed. A recent junction experiment finds time-reversal invariant superconductivity Kashiwaya et al. 2019. Quasiparticle interference data suggest a gap structure Sharma et al. 2019. Evidence for chirality has not been found in thermodynamic quantities: as illustrated in Fig. 1, under a hypothesis of chirality and , the onset temperature of time-reversal symmetry breaking, are predicted to split under uniaxial stress Sigrist and Ueda 1991, but evidence for this splitting has not been resolved in either the stress dependence of or in heat capacity data under uniaxial stress Hicks et al. 2014; Watson et al. 2018; Li et al. 2019.
However there is no widely-accepted alternative hypothesis to understand the experiments that do indicate chirality. Since a confirmation of chirality may imply a new pairing mechanism it is an important point to resolve. The approach taken here is to use a non-thermodynamic probe specifically sensitive to time reversal symmetry breaking, muon spin relaxation (SR), to test for transition splitting in samples placed under uniaxial stress. In this method, spin-polarized muons are implanted, and each muon spin then precesses in its local magnetic field. The time evolution of the polarization is determined by collecting statistics on the direction of positron emission as the muons decay. Like neutron scattering, SR is a true bulk-sensitive probe. In contrast to neutron scattering, it offers sensitivity to spatially uncorrelated fields. The minimum detectable field is 0.01–0.1 mT, against 1 mT for neutron scattering. In a small but growing number of known superconductors, muon spin polarization relaxes more quickly below . This indicates onset of internal magnetic fields, and is interpreted as a signature of TRSB superconductivity. This signal is consistently seen in Sr2RuO4, where the magnitude of the increase indicates a superconductivity-related internal field of 0.05 mT Luke et al. 1998; Luke et al. 2000; Shiroka et al. 2012; Higemoto et al. 2014.
Our experiment is a probe of the SR technique as well as of Sr2RuO4. The internal field is thought to arise at edges, defects, and domain walls: persistent currents are predicted to appear when spatial variation is imposed upon a TRSB order parameter Sigrist and Ueda 1991. This hypothesis is called into question by the fact that edge fields were not detected, to a sensitivity of 0.1 T, in scanning SQUID microscopy measurements, neither in Sr2RuO4 nor in another superconductor where SR measurements indicate an internal field, PrOs4Sb12 Kirtley et al. 2007; Hicks et al. 2010. As SR is the primary tool by which TRSB superconductivity has been identified in a number of other materials, clear demonstration that enhanced muon spin relaxation is not an occasional artefact of conventional superconducting transitions is vital.
II Results on unstressed Sr2RuO4
We begin by presenting the results from three samples (labelled A-C) at zero stress. Sr2RuO4 is grown using a floating zone technique, and growth proceeds along an in-plane lattice direction Bobowski et al. 2019. For Sample A this was approximately a direction, and for Samples B and C a direction. Samples A and C have critical temperatures of 1.38 and 1.35 K, respectively: close to the clean-sample limit of 1.50 K Mackenzie et al. 1998, while Sample B has K, indicating a larger number of defects. All ’s of unstressed Sr2RuO4 were determined by heat capacity and/or transverse-field SR measurements, both of which are bulk-sensitive probes.
Measurements were performed with 4.2 MeV muons, which penetrate to a depth of 0.1 mm, using the Dolly instrument on the E1 beamline at the Paul Scherrer Institute. Decay positrons are counted by two detectors placed forward and backward along the incident beam direction. The asymmetry in the count rate between them is proportional to the average muon spin polarization at time . We employ a method to extract from the raw count rates known as single histogram fitting (explained in the supplementary material) that reduces sensitivity to drifts in the instrumentation.
Zero-field data for Sample A at two temperatures are shown in Fig. 2. Slow muon spin relaxation, due mainly to nuclear magnetic fields, is observed at the higher , and faster relaxation at the lower , indicating onset of an additional relaxation process. External fields are compensated to better than 1 T, so this behavior is not a consequence of appearance of vortices. The additional relaxation has an exponential form, meaning that is approximately exponential. For a static relaxation process this quantity is a Fourier transform of the internal field distribution, and it indicates a broad field distribution characteristic of fields from dilute sources Luke et al. 1998.
The muon spin relaxation rate at each temperature is obtained by fitting the following model:
is a background constant to account for muons that implant into non-superconducting material such as cryostat walls, and is the sample signal strength. For all samples in this paper, and are determined from transverse-field SR measurements at a temperature well below , leaving as the sole fitting parameter. In a field applied transverse to the muon polarization, muons in nonsuperconducting, nonmagnetic material precess in-phase, while precession in superconducting material quickly decoheres due to the field inhomogeneity introduced by the vortex lattice. These contrasting behaviours allow the two muon populations to be distinguished.
As shown in Fig. 2, a phenomenological fit to yields K for Sample A and K for Sample B: the same within error bars, despite Sample B’s lower . (All error bars in this paper are one standard deviation.) However susceptibility measurements reveal that of Sample B is not homogeneous: the transition in susceptibility is broadened and K above the transition seen in heat capacity, likely due to internal strains that locally induce higher Maeno et al. 1998; Steppke et al. 2017. For Sample C, in contrast, is K, which is below its .
These measurements on unstressed Sr2RuO4 provide two important results. (1) The onset of enhanced muon spin relaxation is sharp; it is a transition rather than a crossover. Previously-published data sets Luke et al. 1998; Luke et al. 2000; Shiroka et al. 2012; Higemoto et al. 2014 do not all have enough points above to resolve this. It is an important point because there is a known mechanism that can give weak exponential muon spin relaxation: fluctuations of weak ferromagnetism, as seen in YbNi4P2 Spehling et al. 2012 and CeFePO Lausberg et al. 2012. The distinguishing feature is that in this case the relaxation enhancement fades gradually over an order-of-magnitude increase in temperature, rather than at a transition. (2) In combination with Sample D (shown below), we observe to be within 0.1 K of for three samples, and to be suppressed relative to for one. In combination with published results Luke et al. 1998; Luke et al. 2000; Shiroka et al. 2012; Higemoto et al. 2014, the phenomenology appears to be that can be suppressed below , but cannot exceed . In attempting to resolve contradictory measurements on Sr2RuO4 it has been asked whether the enhanced muon spin relaxation is in fact related to the superconductivity. The combination of transition-like onset and correlation of with is strong evidence that it is.
III Results under uniaxial stress
Stress is applied along a lattice direction, which couples strongly to the electronic structure Hicks et al. 2014. At GPa (where denotes compression) there is a Fermi surface topological transition (a Lifshitz transition), at which peaks at 3.5 K Steppke et al. 2017; Barber et al. 2019. In the limit and in the mean field approximation, the ratio of the slopes and is inverse to the ratios of the associated heat capacity jumps . The experimental upper limit on the heat capacity jump at any second transition is 5% of that at the superconducting transition Li et al. 2019, and therefore in the hypothesis figure [Fig. 1 (a)] we illustrate a steep initial . The physical meaning is that under the hypothesis of chiral order, the energy difference between nonchiral and chiral superconductivity, for example versus , must be small in unstressed Sr2RuO4. In support of the plausibility of this circumstance, we note that weak-coupling calculations such as in Ref. Røising et al. 2019 give nodes that have very narrow opening angles. The condensation energy gained from filling in such nodes by introducing chirality would be small.
Uniaxial stress was applied using a piezoelectric-based cell adapted to the sample size requirements for SR, described in detail in Ref. Hicks et al. 2018. The maximum force this cell can apply is 1000 N. The beam is 1 cm in diameter, and for a decent count rate the sample area facing the beam should be at least 10 mm2. A schematic of a mounted sample is shown in Fig. 1(b): the sample is a plate that is thick enough both to stop the muons and to resist buckling at the highest applied stress. Hematite masks screen the portions of the sample holder exposed to the beam; the strong antiferromagnetism of hematite relaxes the polarization of muons that implant into these masks within ns, allowing these muons to be excluded from analysis. Being antiferromagnetic, the masks do not generate long-range stray fields. Each sample holder incorporates a force sensor based on strain gauges. Also, for most measurements a pair of concentric coils was placed behind the sample, for in situ measurement of through the diamagnetic shielding of the superconducting state. Measured values of were used to calibrate the force sensors following the stress dependence reported in Ref. Barber et al. 2019. Three samples, labelled D–F, were tested under uniaxial stress. Samples E and F were cut from Sample C.
Results are shown in Fig. 3. Sample D, with the zero-stress = 1.39 K, was measured at 0, -0.28, and -0.43 GPa. and were determined independently at each stress. The relaxation enhancement remains exponential at each stress, and it can be seen in panels (f–h) that although increases under the applied stress, remains low. Because the data here do not extend to very low temperature (due to the large mass and poor thermal conductance of the pressure apparatus), a simpler, linear form is used to fit and extract :
The slope is a common fitting parameter among all three stresses, while and are obtained independently at each stress. This fit gives K at 0 GPa, K at -0.28 GPa, and K at -0.43 GPa. Although small, a stress dependence of is resolved: the probability that is lower at -0.28 GPa than at 0 GPa is 98%.
Samples E and F had smaller total cross-sections than Sample D, allowing higher stresses to be reached. Sample E was measured at -0.70 GPa, right at the peak in , and Sample F slightly beyond, at -0.79 GPa. Adopting the same phenomenological fit as applied to Sample D, with the same slope , of Sample F at -0.79 GPa is determined to be K. Although this is a low value, this sample was extracted from sample C, whose zero-stress was K, and we cannot firmly conclude that was suppressed by the stress. It is however clear that even when is at its maximum, is low. A single data point at a yet higher stress, -0.86 GPa, indicates that the time-reversal symmetry breaking is still present.
Going further, bulk magnetic order appeared in Sample F at -1.0 GPa. at various temperatures is shown in Fig. 4(a): the oscillations are an unmistakable indication of long-range magnetic order. We fit the following form to :
Here, is a zeroth-order Bessel function, which is the Fourier transform of the Overhauser field distribution, , expected for an incommensurate spin density wave. A damped cosine form, expected for commensurate magnetic order or ferromagnetism, does not fit well. is the magnetic hyperfine field at the peaks of the SDW, and the muon gyromagnetic ratio. is the oscillating signal fraction due to muons experiencing magnetic hyperfine fields transverse to the initial muon spin polarization. Since the magnetic order can also generate longitudinal field components at individual muon sites, which do not cause muon spin precession, is a lower bound for the magnetic volume fraction. and describe an additional static line broadening and a slow dynamical spin relaxation, respectively. Results of fitting are shown in Fig. 4. saturates at 60 %, and is mT. Fitting gives a Néel temperature of 6.86 K. and strongly increase below 2 K. The effect can be seen directly in Fig. 4(a): more oscillations are resolvable at 2.19 than at 0.44 K. Susceptibility data [Fig. 4(d)] show that the sample is superconducting with K (though with a broad transition), so we conclude that the increase in and at low temperatures is a consequence of microscopic coexistence of the superconductivity and magnetism. As further evidence that the magnetic order is a spin density wave, we note that there is no anomaly in the susceptibility data at K that would indicate ferromagnetism.
In unstressed Sr2RuO4, inelastic neutron scattering reveals strong magnetic fluctuations along columns in momentum space , due to nesting between the and Fermi surfaces Sidis et al. 1999. Substitution of a few per cent Ti on the Ru site induces static order at this , and at 9% Ti the ordered moment is 0.3 /Ru Minakata and Maeno 2001; Braden et al. 2002. Although the electronic structure of Sr2RuO4 also introduces susceptibilities at other ’s Steffens et al. 2019; Cobo et al. 2016, it is a reasonable hypothesis that the stress-induced and Ti-induced magnetic orders are related. Sr2Ru0.91Ti0.09O4 has been studied with muons Carlo et al. 2012: it has K, and the first minimum in occurs at 0.2 s, against 1 s for the stress-induced magnetic order here. This observation suggests an ordered moment for the stress-induced order of 0.06 /Ru.
In functional renormalization group calculations reported in Ref. Liu et al. 2017, uniaxial stress was predicted to induce the formation of SDW order before reaching the Lifshitz transition. However, here it is clear that the magnetic order onsets beyond the Lifshitz transition: the -0.86 GPa data point of Sample F falls between the Lifshitz transition and the onset of SDW order. Our data are summarized by the phase diagram in Fig. 5.
IV Discussion
We focus our Discussion on the observation for GPa of stress-induced splitting between and . Splitting between and has been observed previously in a few materials, but not with the clarity attained here. In UPt3, a splitting of 0.05 K was observed Luke et al. 1993, although enhanced muon spin relaxation was not seen at all in a later report Dalmas de Réotier et al. 1995. In both Ba1-xKxFe2As2 and Pr1-xLaxPt4Ge12 there is a potential splitting of a few K Grinenko et al. 2017; Zhang et al. 2019, but resolution in both cases is limited by the transition widths and small scale of the increase in .
The splitting between and rules out the possibility that enhanced muon spin relaxation is an artefact of a conventional superconducting transition. This is an especially important observation in the absence of a known microscopic mechanism that reconciles the different field scales observed in SR and scanning SQUID magnetometry measurements. It rules out, for example, that the enhanced relaxation is a consequence of compression of flux from magnetic inclusions, present in all large Sr2RuO4 samples, due to Meissner screening. It rules out any mechanism based on interaction of magnetic fluctuations and conventional superconductivity.
There is no known magnetic mechanism that could account for the SR data. We have noted that relaxation by weak ferromagnetic fluctuations is not consistent with the observed transition-like onset of enhanced muon spin depolarization. A glassy magnetic state could reproduce the broad distribution of fields implied by exponential relaxation, however even dilute spin glasses typically give two orders of magnitude stronger relaxation Wu et al. 1994. Finally, we have observed magnetic order in clean Sr2RuO4 at high stress, and its qualitative appearance in SR data is completely different.
We conclude, from the correlation between and in unstressed Sr2RuO4 and the absence of known magnetic mechanisms, that the enhanced muon spin relaxation is a property of the superconductivity. The fact that can split from shows further that it is a transition of the superconducting state. This provides strong support for the hypothesis, widely accepted but not rigorously proved, that enhanced muon spin relaxation is a product of TRSB superconductivity. The observed stress-induced splitting furthermore follows qualitative expectations for chiral superconductivity in Sr2RuO4. We note that recent ultrasound data Ghosh et al. 2020 also indicate two-component superconductivity.
A uniaxial stress of -0.28 GPa was observed to suppress by 0.2 K. Beyond this stress, appears not to evolve strongly, an observation that superficially contrasts with the prediction from Landau theory that uniaxial stress should suppress . However approaching the Lifshitz transition is a strongly nonlinear process, and linear extrapolations based on Landau theory are unlikely to be valid at large . Stress-driven suppression of could be balanced by the overall strengthening of superconductivity. At low stresses, we note that disorder Yu and Raghu 2019; Hicks et al. 2014 and fluctuations Fischer and Berg 2016 are predicted to round off cusps, potentially weaking the observed stress dependence of . Under the hypothesis of chirality, we speculate further that disorder could be the mechanism that splits and in some samples even at zero stress. Dislocations and inclusions are common in large samples of Sr2RuO4, and the growth direction of the sample could give them a preferred orientation, lifting the tetragonal symmetry of the system.
Reconciling evidence for even-parity pairing with chirality leads to the consideration of an order parameter in the representation: . When orbital degrees of freedom are neglected it is an unexpected order parameter because the line node at implies interlayer pairing in a metal with low dispersion; its is strongly suppressed in the weak-coupling calculations of Ref. Røising et al. 2019. To get around this difficulty, alternative TRSB order parameters without horizontal line nodes have been proposed: and . Although they depend on accidental degeneracy to obtain on a tetragonal lattice, there is theoretical support that this may be realized in Sr2RuO4 Rømer et al. 2019; Kivelson et al. 2020. On the other hand, including orbital degrees of freedom allows the possibility of interorbital pairing driven by on-site Hund’s rule coupling. This mechanism becomes feasible when spin-orbit and Hund’s-rule couplings are non-negligible in comparison with the Fermi energy; how strong they must be is a subject of debate Puetter and Kee 2012; Hoshino and Werner 2015; Ramires and Sigrist 2019; Suh et al. 2019. As yet, there are no widely-accepted examples of this type of superconductivity, however it allows that symmetry is encoded in the local orbital degrees of freedom rather than the dependence of the gap, such that interlayer pairing is no longer required. In Ref. Suh et al. 2019 it is proposed that introducing momentum dependence to the spin-orbit coupling can favour interorbital order in Sr2RuO4.
In conclusion, the data presented here are consistent with chiral superconductivity in Sr2RuO4. This is not just an unusual phase, but imposes strong qualitative constraints on models of pairing, possibly requiring a new mechanism. The superconductivity of Sr2RuO4 remains an important question, and we encourage further exploration.
Acknowledgement. This work has been supported financially by the Deutsche Forschungsgemeinschaft (GR 4667/1,
GRK 1621, and SFB 1143 project C02) and the Max Planck Society. YM, TM, and JB acknowledge the financial support of JSPS
Kakenhi (JP15H5852 and JP15K21717) and the JSPS Core-to-Core Program. NK acknowledges the financial support from JSPS
Kakenhi (No. JP18K04715) and JST-Mirai Program (No. JPMJMI18A3). AN acknowledges funding from the European Union’s
Horizon 2020 research and innovation program under the Marie Sklodowska-Curie grant agreement No 701647. This work was
performed partially at the Swiss Muon Source (SS), PSI, Villigen. We acknowledge fruitful discussions with A.
Amato, E. Babaev, S. Blundell, A. Charnukha, D. Efremov, I. Eremin, C. Kallin, A. Ramires, B. Ramshaw, T. Scaffidi, C.
Timm and S. Yonezawa. We also acknowledge H.-S. Xu for his contribution in the crystal growth as well as T. Shiroka and
C. Wang for technical support. We thank A. Gilman, P. P. Orth, and R. M. Fernandes for results from Landau theory of a
two-component order parameter.
V Supplementary material: Split superconducting and time-reversal symmetry-breaking transitions, and magnetic order in Sr2RuO4 under uniaxial stress
V.1 Methods
Single crystals of Sr2RuO4 were grown by a floating zone method Bobowski et al. 2019. With the exception of Sample C, all samples studied here were either cleaved or ground into plates, exposing the interior of the as-grown rod to the muon beam; this is technically relevant information because due to differential evaporation of Ru and Sr during the growth, the interior tends to have a higher density of inclusion phases, especially Ru, SrRuO3, and Sr3Ru2O7. Crystals grow along an in-plane direction, and to obtain samples of sufficient length for measurement under uniaxial stress we were obliged to select samples that happened to grow nearly along a direction. Samples were mounted into holders as shown in Fig. S4 using Stycast 2850 epoxy; the epoxy layers were generally 50–100 m thick. For Samples E and F, three additional steps were taken to improve the chances of reaching high stresses without fracturing the sample. (1) They were cut at a angle with respect to the plane, so that shear stresses in the sample do not align with cleave planes. (2) 10 m-thick titanium foils were affixed to their surfaces with Stycast 1266. (3) The slots in the holder were chamfered, as shown in Fig. 1(b), to smooth the interface between the free and clamped portions of the sample.
In the SR system, an upstream detector triggers a timer when a muon enters the system. Muons entering the system meet one of four fates. (1) Passage through the holder without implantation. These muons are detected by a downstream veto detector, and positron counts from their decay are rejected. (2) Implantation in the hematite masks. [See Fig. 1(b).] These muons depolarize very rapidly. (3) Implantation in material other than the sample or hematite; this gives the background asymmetry . (4) Implantation in the sample.
We now explain the single histogram analysis. Muon asymmetry is typically obtained through direct comparison of the count rates in two detectors. In the single-histogram analysis, data from each detector are analysed separately. This reduces sensitivity to instrumentation drifts while increasing sensitivity to background; it improves precision in determination of relative values of while increasing uncertainty in the absolute values.
Upon decay, emitted positrons are detected by either a forward or backward detector, and counts are binned by time after the trigger. In principle the asymmetry in the count rate, where is the number of counts in detector at time , is proportional to the average muon polarisation at time . In practice, each detector has a “dark” count rate, , that must first be subtracted from . Typically, dark rates are measured in situ, but when the relaxation is slow (as in Sr2RuO4) fitted relaxation rates become sensitive to errors in the dark rates. In the single histogram analysis, the are instead treated as fitting parameters. The counts are fit by
where is the muon lifetime and is a fitting parameter setting the overall number of synchronous (i.e. not dark) counts. is a hypothesised functional form for the emission asymmetry; it has the same form for both detectors, though may have detector-dependent parameters (as indexed by the subscript ). We take . , the relaxation rate, is determined from fits to both detector signals simultaneously, using the MUSRFIT program Suter and Wojek 2012. In this study we generally plot the combined asymmetry as , obtaining the fitted form of as just described and taking the experimental as:
and need to be determined separately from transverse-field measurements, because when relaxation is slow the single histogram fits have low resolving power between these parameters and .
For simplicity, a non-relaxing background was assumed for all samples. This is not strictly correct. For example, between -0.28 and -0.43 GPa a chip broke from Sample D, exposing some brass material of the ac susceptibility coil holder, which is relaxing due to the nuclear magnetic moments of Cu. If instead is taken to relax following an assumed functional form, the single histogram analysis gives different absolute values for . This is the reason why the fit procedure introduces an uncertainty on the absolute value of . We show below that assuming different backgrounds has no substantial effect on temperature-dependent changes in .
Although here we fit zero-field SR time spectra to simple exponential decays, it is also common to analyse zero-field time spectra by , where is the Gauss-Kubo-Toyabe function, . In principle, is the contribution from dense sources such as nuclear dipoles, and the contribution from dilute sources. We tested a simpler phenomenological form on Sample D, , but found that the fit quality was not improved by the added parameter.
V.2 Effect of the background in the single histogram analysis
Before each zero field measurements the ratio was determined using transverse field SR. In Fig. S1 transverse-field data from Sample D at 0 and -0.43 GPa are shown. Above the muons precess without relaxation in the applied 14.5 mT field. The field was applied along the axis, where mT, and below the field within the sample becomes highly inhomogeneous due to the vortex lattice. Correspondingly, the polarization of muons implanted in the sample relaxes rapidly. At -0.43 GPa, it can be seen however that there is residual oscillation that appears not to relax. This is due to the background muons; as noted above, a chip broke from the sample between -0.28 and -0.43 GPa, exposing some of the susceptibility coil holder (which was made of brass). To fit , we assume a field distribution that is a sum of a few Gaussians, with one describing the background and the rest the vortex lattice Maisuradze et al. 2009. is fitted in the time domain to a Fourier transform of this assumed field distribution. Results are shown in panels (c) and (d). By comparing the fitted amplitudes of the background and vortex contributions, we obtain at -0.43 GPa, and 0.05 at 0 and -0.28 GPa. For the remaining samples, came to for Samples A, B, and F; for Sample C; and for Sample E.

It was noted above that the single histogram analysis introduces uncertainty into absolute values of , but not into temperature-dependent changes. We provide further details here. We show that taking a relaxing background, due to possible magnetism in the background material, shifts the absolute values of obtained from the single histogram analysis, but does not substantially affect relative values.
The effect will have been particularly notable for Sample D at -0.43 GPa: the exposed brass is relaxing due to Cu nuclear magnetic moments. The relaxation from copper can be accurately fit by the Gauss-Kubo-Toyabe form with s-1 Clawson et al. 1983. In Fig. S2(a) we show results for taking 20% of the background to relax the muon spins as copper does, and the remaining 80% to be non-relaxing. This alters the fitted values of , and so also the resulting . Panel (b) shows extracted from the single histogram analysis with a non-relaxing background, this 20% background, and also a 55% background. The 20% copper case is seen to reduce for to a similar value as obtained for 0 and -0.28 GPa; because the background was smaller for 0 and -0.28 GPa, these two measurements are more likely to yield correct absolute values. The important point is revealed in panel (c): for all of these assumed backgrounds, the effect on temperature-dependent relative values of extracted from the single histogram analysis is negligible.
V.3 Analysis of the ZF SR data in the magnetic state
To describe the internal field distribution in the magnetic state we used the Bessel function as discussed in the main text. This field distribution is consistent with an incommensurate magnetic structure indicating a SDW state. It would also be a reasonable hypothesis that tuning Sr2RuO4 to peaks in the density of states induces ferromagnetism. Therefore, we show here that ferromagnetism does not give a good match to the data. The expected functional form for for ferromagnetism is a cosine:
where is now the average local magnetic field at the muon site induced by the magnetism, and other quantities are as in the main text. This form also applies to commensurate magnetic order: reversing the field direction on every other site would not alter . Results are shown in Fig. S3. It is seen that the cosine fit does not work as well: it does not reproduce the data at early time (s) or at s. In particular, it does not capture the third peak in , at s, which is clearly present not only here (at K), but also in the 2.19 and 4.4 K data in Fig. 4(a).
V.4 Analysis of heat capacity jumps
The hypothesized phase diagram, Fig. 1(a), indicates a slope , where is stress applied along a lattice direction, that, for consistency with heat capacity data under uniaxial stress Li et al. 2019, far exceeds . Here, we explain further.
We take a general free energy
and are respectively the amplitudes of the and components of the gap function, and is the phase difference between them. is the applied uniaxial stress, and a coupling constant. .
For a chiral state to occur, we require to ensure that the energy is minimized for , and to ensure that both and become nonzero below in the unstrained sample. To obtain the mean-field phase diagram, this free energy is minimized with respect to , , and ; the minimization with respect to gives . This minimization gives a heat capacity jump at of
When , the transition splits into two transitions,
The heat capacity jumps at these two transitions are
where is the heat capacity jump at , and that at . These expressions give:
In other words, in the mean field approximation the ratio of the slopes and is inverse to the heat capacity jumps at the transitions.
V.5 More information on the sample and cell configuration
We provide here a brief description of the apparatus, and more information on the sample configuration. The uniaxial stress apparatus is explained fully in Ref. Hicks et al. 2018. To facilitate sample exchange, samples are mounted in detachable holders that slot into a piezoelectric-driven device that we term the generator. The generator contains a compression spring that generates a preload force of 1000 N. This preload is applied to two sets of piezoelectric actuators. One set is anchored to the cell frame and the other to the sample. By adjusting the relative lengths of the actuators through the applied voltages, the fraction of the preload that is applied to the sample is varied. The cell is designed such that it can only apply compressive forces; it incorporates a mechanical interface that opens when the applied displacement becomes tensile. The generator incorporates a strain gauge bridge that is configured to measure the displacement applied to the sample holder. This sensor serves as a complement to the strain gauge-based force sensor incorporated into the holder. (The strain gauges were supplied by Tokyo Sokki, part number CFLA-3-350-11.) force-displacement relation is linear then the deformation of the sample, and epoxy anchoring the sample, is elastic. On the other hand a sharp increase in displacement accompanied by a decrease in force indicates that a fracture or slip occured somewhere.
Fig. S4 shows a closer view of sample F, as mounted for measurement. As has been described in the main text and above, there is a pair of coils for in situ measurement of through magnetic susceptibility. The two coils each have 100 turns, and are wound directly on top of each other onto the same form. Together, they had an inner diameter of 1.8 mm and an outer diameter of 2.8 mm, and extended from 0.4 to 1.0 mm above the sample. The measurement is of the mutual inductance of the two coils using a lock-in amplifier, and the excitation field applied at the sample surface was typically 10 T.

The loading curves, meaning the readings from the force and displacement sensors, for samples D–F are shown in Fig. S5. All samples were cooled with the piezoelectric actuators grounded. The readings of the sensors with no force on the sample could be straightforwardly determined by shifting the actuators towards tensile force: when the force reaches zero and the mechanical interface opens, the sensor readings plateau (0 GPa label in Fig. S5). All samples were under modest compression after initial cool-down; we speculate that this is due to differential thermal contraction between loaded and unloaded piezoelectric actuators. For sample D, there is a prominent anomaly in the loading curve between -0.28 and -0.43 GPa, which is where a chip broke from the sample (see inset of Fig. S5). The chip will have reduced the homogeneity of the applied stress, however the susceptibility data in Fig. 3(h) show that in spite of it the superconducting transition at -0.43 GPa was not excessively broad. The loading curves for samples E and F, in contrast, show no such anomalies. The loading data for Sample F fall on two distinct lines. We speculate that this was caused by a slip at the holder-generator interface, or elsewhere in the generator, that shifted the calibration of the displacement sensor. After pulling the sample out of the system no visible signs of damage to the sample were found.
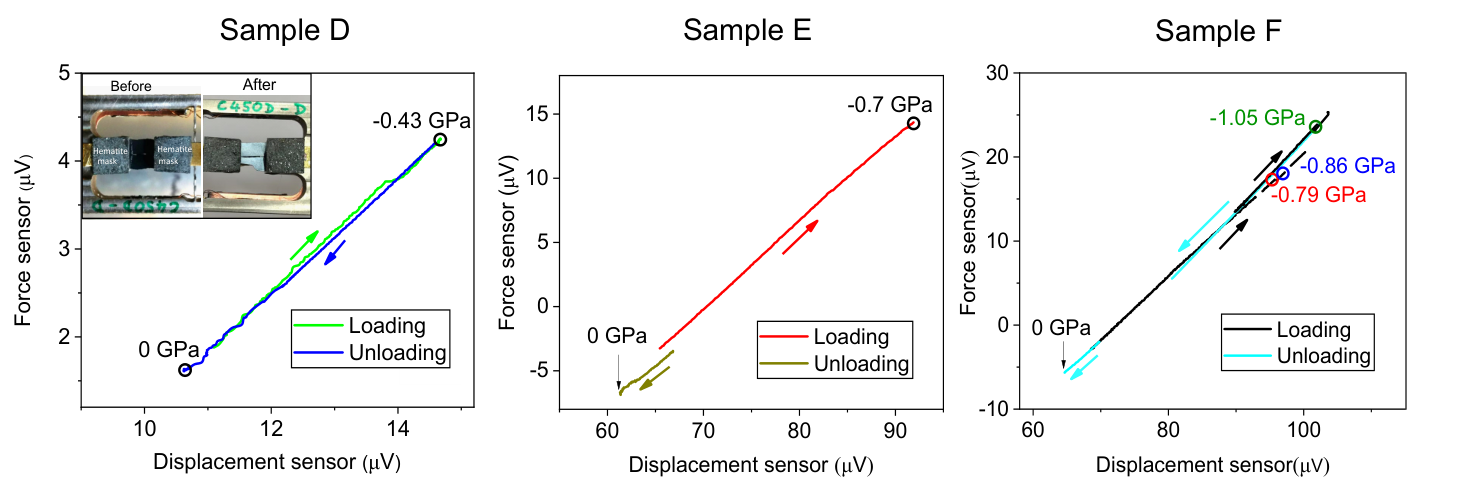
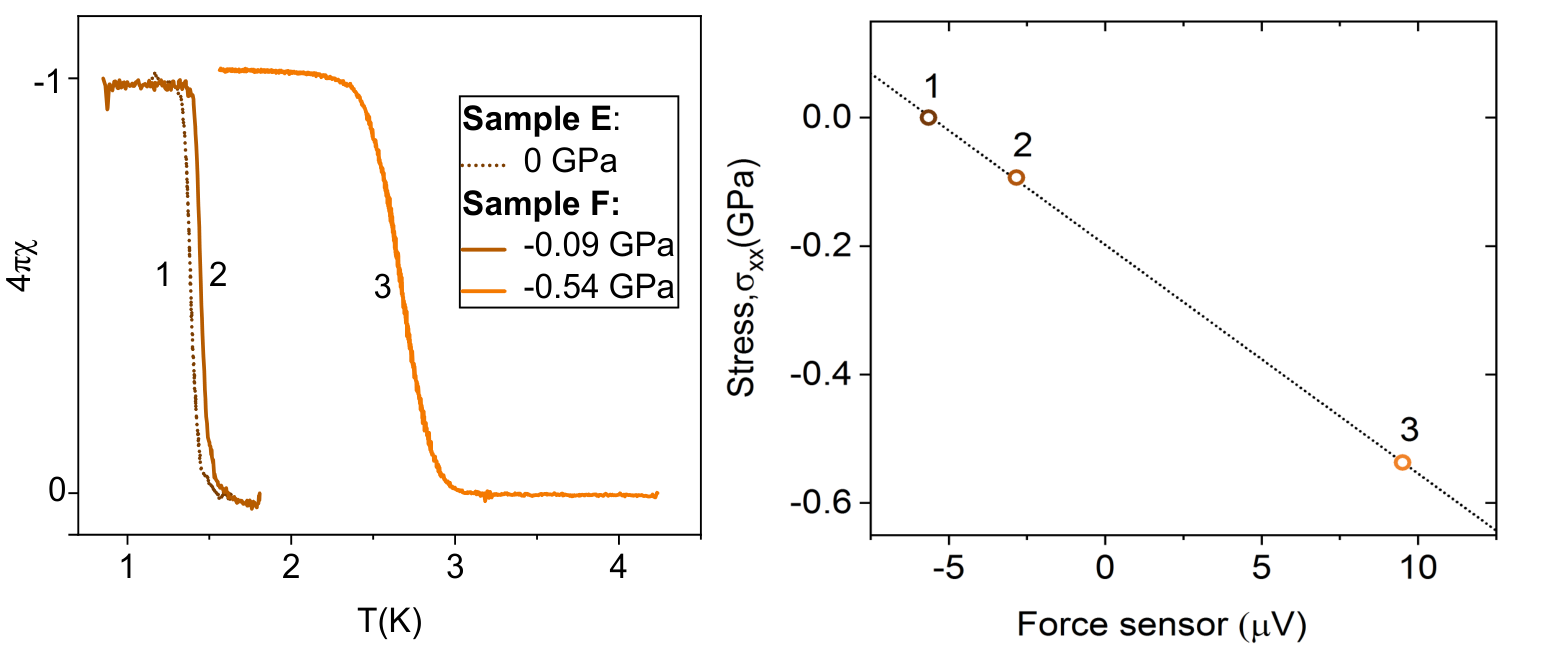
The force sensor was calibrated for each sample using the known stress dependence of Barber et al. 2019. For Samples D and F, was identified as the midpoint of the transition in susceptibility; due to the width of the superconducting transition near the Lifshitz transition, only data with GPa were used. Sample E was tuned to the maximum , reported in Ref. Barber et al. 2019 to occur at -0.70 GPa.
V.6 Sample characterization
Additional characterization data of the samples are shown in Fig. S7. Heat capacity data are shown for all samples except Sample F; Samples E and F were both drawn from Sample C, and so are expected to have very similar properties. The samples have sharp transitions with near the clean-sample limit of 1.50 K in all samples except Sample B. For Samples D and E, and the transition widths obtained from heat capacity and susceptibility data match closely, indicating high sample homogeneity, while for Sample B the transition in susceptibility is broad and at a higher temperature than the heat capacity transition, most likely due to internal defects such as Ru inclusions, which locally increase through strain effects.
To obtain a superconducting penetration depth we performed transverse field measurements at different temperatures similar to shown in Fig. S1. In the superconducting state the data were analyzed by a multi-Gaussian fit to obtain the second moment of the internal field distribution in the vortex state as described in Ref. Maisuradze et al. 2009. The penetration depth was calculated using Brandt relation between the magnetic penetration depth and the second moment = , where in the magnetic flux quantum, valid for the case when the applied field H. 2003. The latter holds for the data presented in Fig.S7, where the inverse squared penetration depth is plotted. The measurements shown in panel (a), (f), and (g) were performed in B = 2 mT and in panel (c) in B = 14.5 mT. Like the heat capacity data of Ref. Li et al. 2019, these measurements show definitively that the strain-induced increase in is a bulk effect.
Finally, we summarize all measured in-situ susceptibility data for samples E and F in Fig. S7 (h) and (i) . Note that in these panels the raw Lock-In-amplifier voltage data are shown without normalization, the offset voltage above being subtracted from each curve. These data demonstrate that at all measured uniaxial stress values the superconducting volume fraction at lowest temperatures is 1.
References
- Maeno et al. (1994) Y. Maeno, H. Hashimoto, K. Yoshida, S. Nishizaki, T. Fujita, J. Bednorz, and F. Lichtenberg, Nature 372, 532 (1994).
- Xia et al. (2006) J. Xia, Y. Maeno, P. T. Beyersdorf, M. M. Fejer, and A. Kapitulnik, Physical Review Letters 97, 167002 (2006).
- Kidwingira et al. (2006) F. Kidwingira, J. D. Strand, D. J. Van Harlingen, and Y. Maeno, Science 314, 1267 (2006).
- Nakamura et al. (2012) T. Nakamura, T. Sumi, S. Yonezawa, T. Terashima, M. Sigrist, H. Kaneyasu, and Y. Maeno, Journal of the Physical Society of Japan 81, 064708 (2012).
- Anwar et al. (2013) M. A. Anwar, T. Nakamura, S. Yonezawa, M. Yakabe, R. Ishiguro, H. Takayanagi, and Y. Maeno, Scientific Reports 3, 2480 (2013).
- Mackenzie and Maeno (2003) A. P. Mackenzie and Y. Maeno, Reviews of Modern Physics 75, 657 (2003).
- Maeno et al. (2012) Y. Maeno, S. Kittaka, T. Nomura, S. Yonezawa, and K. Ishida, Journal of the Physical Society of Japan 81, 011009 (2012).
- Kallin (2012) C. Kallin, Reports on Progress in Physics 75, 042501 (2012).
- Mackenzie et al. (2017) A. P. Mackenzie, T. Scaffidi, C. W. Hicks, and Y. Maeno, npj Quantum Materials 2, 40 (2017).
- Pustogow et al. (2019) A. Pustogow, Y. Luo, A. Chronister, S. Y.-S., D. A. Sokolov, F. Jerzembeck, A. P. Mackenzie, C. W. Hicks, N. Kikugawa, S. Raghu, et al., Nature 574, 72 (2019).
- Ishida et al. (2019) K. Ishida, M. Manago, and Y. Maeno, arXiv.1907.12236 (2019).
- Steppke et al. (2017) A. Steppke, L. Zhao, M. E. Barber, T. Scaffidi, F. Jerzembeck, H. Rosner, A. S. Gibbs, Y. Maeno, S. H. Simon, A. P. Mackenzie, et al., Science 355, eaaf9398 (2017).
- Kashiwaya et al. (2019) S. Kashiwaya, K. Saitoh, H. Kashiwaya, M. Koyanagi, M. Sato, K. Yada, Y. Tanaka, and Y. Maeno, Physical Review B 100, 094530 (2019).
- Sharma et al. (2019) R. Sharma, S. D. Edkins, W. Z., A. Kostin, C. Saw, Y. Maeno, A. P. Mackenzie, J. C. Davis, and M. V., Arxiv: 1912.02798 (2019).
- Sigrist and Ueda (1991) M. Sigrist and K. Ueda, Reviews of Modern Physics 63, 239 (1991).
- Hicks et al. (2014) C. W. Hicks, D. O. Brodsky, E. A. Yelland, A. S. Gibbs, J. A. N. Bruin, M. E. Barber, S. D. Edkins, K. Nishimura, S. Yonezawa, Y. Maeno, et al., Science 344, 283 (2014).
- Watson et al. (2018) C. A. Watson, A. S. Gibbs, A. P. Mackenzie, C. W. Hicks, and K. A. Moler, Physical Review B 98, 094521 (2018).
- Li et al. (2019) Y.-S. Li, N. Kikugawa, D. A. Sokolov, F. Jerzembeck, A. S. Gibbs, Y. Maeno, C. W. Hicks, M. Nicklas, and A. P. Mackenzie, arXiv (2019).
- Luke et al. (1998) G. M. Luke, Y. Fudamoto, K. M. Kojima, M. I. Larkin, J. Merrin, B. Nachumi, Y. J. Uemura, Y. Maeno, Z. Q. Mao, Y. Mori, et al., Nature 394, 558 (1998).
- Luke et al. (2000) G. M. Luke, Y. Fudamoto, K. M. Kojima, M. I. Larkin, B. Nachumi, Y. J. Uemura, J. E. Sonier, Y. Maeno, Z. Q. Mao, Y. Mori, et al., Physica B 289-290, 373 (2000).
- Shiroka et al. (2012) T. Shiroka, R. Fittipaldi, M. Cuocco, R. De Renzi, Y. Maeno, R. J. Lycett, S. Ramos, E. M. Forgan, C. Baines, A. Rost, et al., Physical Review B 85, 134527 (2012).
- Higemoto et al. (2014) W. Higemoto, A. Koda, R. Kadono, Y. Yoshida, and Y. Onuki, JPS Conference Proceedings 2, 010202 (2014).
- Kirtley et al. (2007) J. R. Kirtley, C. Kallin, C. W. Hicks, E.-A. Kim, Y. Liu, K. A. Moler, Y. Maeno, and K. D. Nelson, Physical Review B 76, 014526 (2007).
- Hicks et al. (2010) C. W. Hicks, J. R. Kirtley, T. M. Lippman, N. C. Koshnick, M. E. Huber, Y. Maeno, W. M. Yuhasz, M. B. Maple, and K. A. Moler, Physical Review B 81, 214501 (2010).
- Bobowski et al. (2019) J. S. Bobowski, N. Kikugawa, T. Miyoshi, H. Suwa, H.-S. Xu, S. Yonezawa, D. A. Sokolov, A. P. Mackenzie, and Y. Maeno, Condensed Matter 4, 6 (2019).
- Mackenzie et al. (1998) A. P. Mackenzie, R. K. W. Haselwimmer, A. W. Tyler, G. G. Lonzarich, Y. Mory, S. Nishizaki, and Y. Maeno, Physical Review Letters 80, 161 (1998).
- Maeno et al. (1998) Y. Maeno, T. Ando, Y. Mori, E. Ohmichi, S. Ikeda, S. Nishizaki, and S. Nakatsuji, Physical Review Letters 81, 3765 (1998).
- Spehling et al. (2012) J. Spehling, M. Günther, C. Krellner, N. Yèche, H. Luetkens, C. Baines, C. Geibel, and H.-H. Klauss, Physical Review B 85, 140406(R) (2012).
- Lausberg et al. (2012) S. Lausberg, J. Spehling, A. Steppke, A. Jesche, H. Luetkens, A. Amato, C. Baines, C. Krellner, M. Brando, C. Geibel, et al., Physical Review Letters 109, 216402 (2012).
- Barber et al. (2019) M. E. Barber, F. Lechermann, S. V. Streltsov, S. L. Skornyakov, S. Ghosh, B. J. Ramshaw, N. Kikugawa, D. A. Sokolov, A. P. Mackenzie, C. W. Hicks, et al., Physical Review B 100, 245139 (2019).
- Røising et al. (2019) H. S. Røising, T. Scaffidi, F. Flicker, G. F. Lange, and S. H. Simon, Physical Review Research 1, 033108 (2019).
- Hicks et al. (2018) C. W. Hicks, S. Ghosh, M. E. Barber, and H.-H. Klauss, JPS Conf. Proc. 21, 011040 (2018).
- Sidis et al. (1999) Y. Sidis, M. Braden, P. Bourges, B. Hennion, S. Nishizaki, Y. Maeno, and Y. Mori, Physical Review Letters 83, 3320 (1999).
- Minakata and Maeno (2001) M. Minakata and Y. Maeno, Physical Review B 63, 180504 (2001).
- Braden et al. (2002) M. Braden, O. Friedt, Y. Sidis, P. Bourges, M. Minakata, and Y. Maeno, Physical Review Letters 88, 197002 (2002).
- Steffens et al. (2019) P. Steffens, Y. Sidis, J. Kulda, Z. Q. Mao, Y. Maeno, I. I. Mazin, and M. Braden, Physical Review Letters 122, 047004 (2019).
- Cobo et al. (2016) S. Cobo, F. Ahn, I. Eremin, and A. Akbari, Physical Review B 94, 224507 (2016).
- Carlo et al. (2012) J. P. Carlo, T. Goko, I. M. Gat-Malureanu, P. L. Russo, A. T. Savici, A. A. Aczel, G. J. MacDougall, J. A. Rodriguez, T. J. Williams, G. M. Luke, et al., Nature Materials 11, 323 (2012).
- Liu et al. (2017) Y.-C. Liu, F.-C. Zhang, T. M. Rice, and Q.-H. Wang, npj Quantum Materials 2, 12 (2017).
- Luke et al. (1993) G. M. Luke, A. Keren, L. P. Le, W. D. Wu, Y. J. Uemura, D. A. Bonn, L. Taillefer, and J. D. Garrett, Physical Review Letters 71, 1466 (1993).
- Dalmas de Réotier et al. (1995) P. Dalmas de Réotier, A. Huxley, A. Yaouanc, J. Flouquet, P. Bonville, P. Imbert, P. Pari, P. C. M. Gubbens, and A. M. Mulders, Physics Letters A 205, 239 (1995).
- Grinenko et al. (2017) V. Grinenko, P. Materne, R. Sarkar, H. Luetkens, K. Kihou, C. H. Lee, S. Akhmadaliev, D. V. Efremov, S.-L. Drechsler, and H.-H. Klauss, Physical Review B 95, 214511 (2017).
- Zhang et al. (2019) J. Zhang, Z. F. Ding, K. Huang, C. Tan, A. D. Hillier, P. K. Biswas, D. E. MacLaughlin, and L. Shu, Physical Review B 100, 024508 (2019).
- Wu et al. (1994) W. D. Wu, A. Keren, L. P. Le, G. M. Luke, B. J. Sternlieb, Y. J. Uemura, C. L. Seaman, Y. Dalichaouch, and M. B. Maple, Physical Review Letters 72, 3722 (1994).
- Ghosh et al. (2020) S. Ghosh, A. Shekhter, F. Jerzembeck, N. Kikugawa, D. A. Sokolov, A. P. Mackenzie, C. W. Hicks, and B. J. Ramshaw, In preparation (2020).
- Yu and Raghu (2019) Y. Yu and S. Raghu, Physical Review B 100, 094517 (2019).
- Fischer and Berg (2016) M. H. Fischer and E. Berg, Physical Review B 93, 054501 (2016).
- Rømer et al. (2019) A. T. Rømer, D. D. Scherer, I. M. Eremin, P. J. Hirschfeld, and B. M. Andersen, Physical Review Letters 123, 247001 (2019).
- Kivelson et al. (2020) S. A. Kivelson, A. C. Yuan, B. J. Ramshaw, and R. Thomale, In preparation (2020).
- Puetter and Kee (2012) C. M. Puetter and H.-Y. Kee, Europhysics Letters 98 (2012).
- Hoshino and Werner (2015) S. Hoshino and P. Werner, Physical Review Letters 115, 247001 (2015).
- Ramires and Sigrist (2019) A. Ramires and M. Sigrist, Physical Review B 100, 104501 (2019).
- Suh et al. (2019) H. G. Suh, H. Menke, P. M. R. Brydon, C. Timm, A. Ramires, and D. F. Agterberg, Arxiv: 1912.09525 (2019).
- Suter and Wojek (2012) A. Suter and B. Wojek, Phys. Procedia 30, 69 (http://lmu.web.psi.ch/musrfit/user/html/user (2012).
- Maisuradze et al. (2009) A. Maisuradze, R. Khasanov, A. Shengelaya, and H. Keller, J. Phys.: Condens. Matter 21, 075701 (2009).
- Clawson et al. (1983) C. W. Clawson, K. M. Crowe, S. S. Rosenblum, S. E. Kohn, C. Y. Huang, J. L. Smith, and J. H. Brewer, Phys. Rev. Lett. 51, 114 (1983).
- H. (2003) B. E. H., Physical Review B 68, 054506 (2003).