Lesion-Harvester: Iteratively Mining Unlabeled Lesions and Hard-Negative Examples at Scale
Abstract
The acquisition of large-scale medical image data, necessary for training machine learning algorithms, is hampered by associated expert-driven annotation costs. Mining hospital archives can address this problem, but labels often incomplete or noisy, e.g., of the lesions in DeepLesion are left unlabeled. Thus, effective label harvesting methods are critical. This is the goal of our work, where we introduce Lesion-Harvester—a powerful system to harvest missing annotations from lesion datasets at high precision. Accepting the need for some degree of expert labor, we use a small fully-labeled image subset to intelligently mine annotations from the remainder. To do this, we chain together a highly sensitive lesion proposal generator (LPG) and a very selective lesion proposal classifier (LPC). Using a new hard negative suppression loss, the resulting harvested and hard-negative proposals are then employed to iteratively finetune our LPG. While our framework is generic, we optimize our performance by proposing a new 3D contextual LPG and by using a global-local multi-view LPC. Experiments on DeepLesion demonstrate that Lesion-Harvester can discover an additional lesions at a precision of . We publicly release the harvested lesions, along with a new test set of completely annotated DeepLesion volumes. We also present a pseudo 3D IoU evaluation metric that corresponds much better to the real 3D IoU than current DeepLesion evaluation metrics. To quantify the downstream benefits of Lesion-Harvester we show that augmenting the DeepLesion annotations with our harvested lesions allows state-of-the-art detectors to boost their average precision by to .
Index Terms:
Lesion harvesting, lesion detection, hard negative mining, pseudo 3D IoU.I Introduction
Paralleling developments in computer vision, recent years have seen the emergence of large-scale medical image databases [1, 2, 3, 4, 5]. These are seminal milestones in medical imaging analysis research that help address the data-hungry needs of deep learning and other machine learning technologies. Yet, most of these databases are collected retrospectively from hospital picture archiving and communication systems, which house the medical image and text reports from daily radiological workflows. While harvesting picture archiving and communication systems will likely be essential toward truly obtaining large-scale medical imaging data [6], their data are entirely ill-suited for training machine learning systems [7] as they are not curated from a machine learning perspective. As a result, popular large-scale medical imaging datasets suffer from uncertainties, mislabelings [3, 8, 9] and incomplete annotations [5], a trend that promises to increase as more and more picture archiving and communication system data is exploited. Correspondingly, there is a great need for effective data curation, but, unlike in computer vision, these problems cannot be addressed by crowd-sourcing approaches [10, 11]. Instead this need calls for alternative methods tailored to the demanding medical image domain. This is the focus of our work, where we articulate a powerful and effective label completion framework for lesion datasets, applying it to harvest unlabeled lesions from the recent DeepLesion dataset [5].
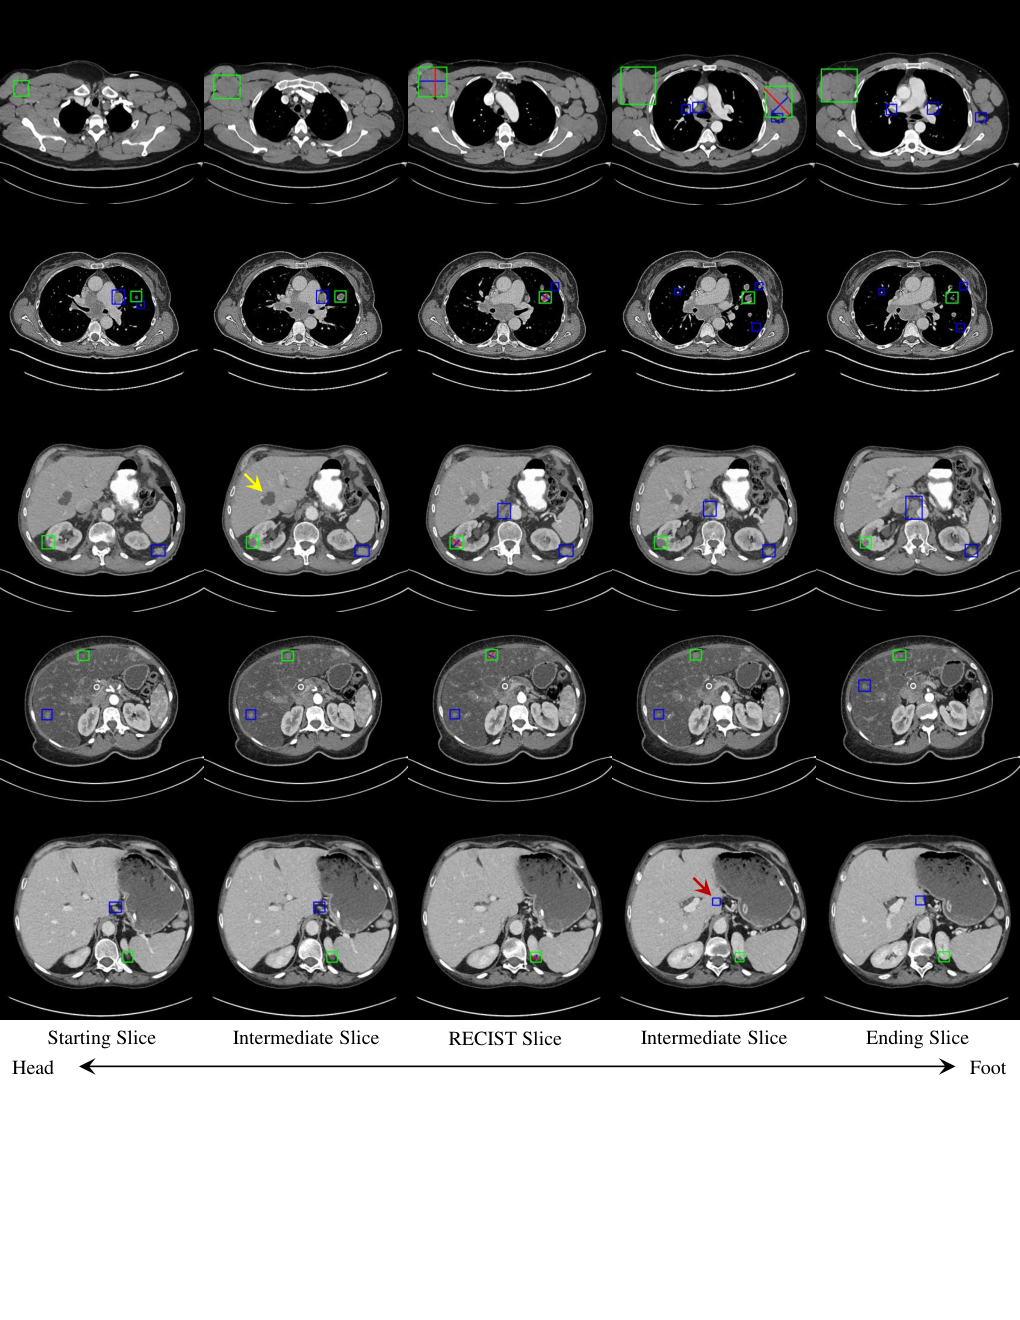
DeepLesion [4, 5] is a recent publicly released medical image database of CT sub-volumes along with localizations of lesions. These were mined from computed tomography scans from the US National Institutes of Health Clinical Center picture archiving and communication system. The mined lesions were extracted from response evaluation criteria in solid tumours [12] marks performed by clinicians to measure tumors in their daily workflow. See Fig. 1(a) for an example of a response evaluation criteria in solid tumours marked lesion.

In total, DeepLesion contains retrospectively clinically annotated lesions from computed tomography scans of unique patients. A variety of lesion types and subtypes have been included in this database, such as lung nodules, liver tumors, and enlarged lymph nodes. As such, the DeepLesion dataset is an important source of data for medical imaging analysis tasks, including training and characterizing lesion detectors and for developing radiomics-based biomarkers for tumor assessment and tracking. However, due to the response evaluation criteria in solid tumours guidelines [12] and workload limits, physicians typically marked only a small amount of lesions per computed tomography scan as the finding(s) of interest. Yet, as shown in Fig. 1(b), more often than not computed tomography images exhibit multiple co-existing lesions per patient. Indeed, based on a recent empirical study [13], and our own results presented later, there are about the same quantity of missing findings compared to reported ones. Moreover, as Fig. 1(c) illustrates, response evaluation criteria in solid tumours marks do not indicate the 3D extent, leaving tumor regions of the same instance in adjoining slices unmarked. This severely challenges the development of high-fidelity disease detection algorithms and artificially limits the dataset’s usefulness for biomarker development. Nevertheless, it is highly impractical and infeasible to recruit physicians to manually revise and add back annotations for the entire database.
To address this issue, we aim to reliably discover and harvest unlabeled lesions. Given the expert-driven nature of annotations, our approach, named Lesion-Harvester, accepts the need for a small amount of supplementary physician labor. It integrates three processes: (1) a highly sensitive detection-based lesion proposal generator to generate lesion candidates, (2) manual verification of a small amount of the lesion proposals, and (3) a very selective lesion proposal classifier that uses the verified proposals to automatically harvest prospective positives and hard negatives from the rest. These processes are tied together in an iterative fashion to strengthen the lesion harvesting at each round. Importantly, for (1) and (3) our framework can accept any state-of-the-art detector and classifier, allowing it to benefit from future improvements in these two domains. Even so, in this work, we develop our own lesion proposal generator, called contextual-enhanced CenterNet, that combines the recent innovations seen in CenterNet [14] and the multitask universal lesion analysis network [15]. We also propose a hard negative suppression loss to boost our lesion proposal generator with harvested hard negative cases. Among choices of lesion proposal classifiers, we use a global-local classifier with multi-view input to further reduce the false positive rate of produced lesion proposals. With our framework, we are able to harvest an additional lesions from DeepLesion, while keeping the label precision above , at a cost of only fully annotating of the data. Compared to the original dataset this is a boost of in recall rates. Thus, our lesion harvesting framework, along with the introduced contextual-enhanced CenterNet lesion proposal generator and hard negative suppression loss, represent our main contributions.
However, we also provide additional important contributions. For one, we completely annotate and publicly release of the DeepLesion subvolumes with response evaluation criteria in solid tumours marks, in addition to our harvested lesions. Second, we introduce and validate a new pseudo 3D evaluation metric, designed for completely annotated data, that serves as a much better measurement of 3D detection performance than current practices11 1 We open source our evaluation code, annotations, and results at https://github.com/JimmyCai91/DeepLesionAnnotation.. Since all DeepLesion test data, up to this point, is incompletely annotated, these contributions allow for more accurate evaluations of lesion detection systems. Finally, we report concrete benefits of harvesting unlabeled lesions. To do this, we train several state-of-the-art detection systems [14, 16] using data augmented with our harvested prospective lesions and hard negative examples. We show that with even the best published method to date [15], the average precision can be improved by percent. We also show that our contextual-enhanced CenterNet lesion proposal generator can also be used as an extremely effective detector, outperforming the state-of-the-art and providing additional methodological contributions to the lesion detection topic.
II Related Work

II-A Detection with incomplete ground-truth.
The problem of missing annotations [17, 18] is related to, but differs from scenarios where the labeled data is independent from the unlabeled data. Thus, approaches to address the latter, such as deep growing learning [19], which uses a small-sized but fully-annotated training set to initialize the model and then gradually expand training examples with pseudo labels, would not fully exploit DeepLesion labels. Instead, labeled and unlabeled lesions in DeepLesion often co-exist in the same training images, which changes the nature of the problem.
Ren et al., [17] addressed the partial label problem and reduced the effect of missing labels by only using true positives and hard negatives for training detectors, where the latter were defined as region proposals with at least an overlap of with existing ground truth boxes. This setup, which we denote overlap-based hard sampling (OBHS), should help mitigate false negatives; however, it inevitably sacrifices a large amount of informative true negatives that have overlap with ground truth boxes. Wu et al., [18] proposed overlap-based soft sampling to improve object detectors, which weights contributions of region proposals proportional to their overlap with the ground truth. These strategies reduce the impact of true negatives not overlapping with the ground truth. Yet, true negatives in the background body structures are usually informative for training a robust lesion detector. By explicitly attempting to harvest prospective positives, Lesion-Harvester minimizes false negatives without suppressing informative background regions.
Focusing specifically on DeepLesion, Wang et al., [20] first applied missing ground-truth mining to mine unlabeled lesions on the response evaluation criteria in solid tumours-marked CT slices. Complementary with missing ground-truth mining, they also apply slice-level label propagation to propagate bounding boxes from the response evaluation criteria in solid tumours-marked slices to adjacent slices to reconstruct lesions in 3D. Different from missing ground-truth mining-slice-level label propagation, Lesion-Harvester conducts lesion mining on the whole CT volume. It also alternately mines and then updates the deep learning models, to iteratively strengthen the harvesting process. Finally, it also identifies and then integrates hard negative examples using hard negative suppression loss (HNSL).
II-B Label propagation from partial labels.
Our work also relates to efforts on knowledge distillation and self label propagation. Radosavovic et al., [21] proposed a data distillation method to ensemble predictions and automatically generate new annotations for unlabeled data from internet-scale data sources. Gao et al., [22] investigated propagating labels from fully-supervised interstitial lung disease masks to unlabeled slices using convolutional neural networks and conditional random fields. Cai et al., [23] recovered 3D segmentation masks from 2D response evaluation criteria in solid tumours marks in DeepLesion by integrating a convolutional neural network and GrabCut [24]. We also tackle the large-scale and noisy DeepLesion dataset, but we process each computed tomography volume as a whole, rather than focus on post-processing a given region of interest.
II-C Lesion detection.
Recently, Yan et al., [4] introduced the DeepLesion dataset, which is a large-scale clinical database for whole body lesion detection, with follow-up work focusing on incorporating 3D context into 2D two-stage region-proposal convolutional neural networks [13, 15]. These studies demonstrate the importance of incorporating 3D context in lesion detection and currently represent the state-of-the-art performance on DeepLesion. Some recent works also investigated one-stage detectors [25, 26]. Compared with two-stage detectors, one-stage detectors are more flexible, straightforward, and computationally efficient. Recent work has also focused on false-positive detection. For instance, Ding et al., [27] used a 3D-convolutional neural network for this task, while Dou et al., [28] used a multi-scale context which ensembles three 3D-convolutional neural networks with small, medium, and large input patches. Varghese et al., [29] proposed an interesting novelty detector (ND) for false positive reduction and applied it to brain tumor detection. More study is required to determine if their single layer denoising autoencoder has enough capacity to handle lesions with large appearance variabilities. Finally, Tang et al., [30] showed that hard negative mining can increase detection sensitivity on DeepLesion.
Unlike the above works, our main focus is on harvesting missing annotations using a small amount of physician labor. To do so, we articulate the Lesion-Harvester pipeline that integrates state-of-the-art detection and classification solutions as lesion proposal generator and lesion proposal classifier, respectively. We also introduce a one-stage multi-slice lesion proposal generator that performs better than prior work. Like Tang et al., [30], we also demonstrate the importance of hard negative mining. Finally, with our lesion harvesting task completed, we then show how the complete labels can be used to train the same lesion proposal generator detection frameworks to better localize lesions on unseen data.
III Methods
Fig. 2 overviews our proposed Lesion-Harvester. As motivated above, we aim to harvest missing annotations from the incomplete DeepLesion dataset [4, 5]. Additionally, as Fig. 1(c) demonstrates, another important aim is to fully localize the 3D extent of lesions, which means we aim to also generate 3D proposals for both response evaluation criteria in solid tumours-marked and unlabeled lesions. In this section, we first overview our method in Sec. III-A and then detail each component in Sec.s III-B–III-D. This is followed by Sec. III-E, which outlines our proposed pseudo 3D (P3D) evaluation metric.
III-A Overview
For the problem setup, we assume we are given a set of computed tomography volumes, . Within each volume, there is a set of response evaluation criteria in solid tumours-marked lesions which are denoted as
| (1) |
where is the -th response evaluation criteria in solid tumours-marked lesion in . We would like to use 3D bounding boxes to represent each lesion or lesion proposal. However, because a response evaluation criteria in solid tumours mark is only applied on the key slice, they only define a set of 2D boxes:
| (2) |
Because volumes are incompletely labeled, if we denote all lesions within volume as , then is a subset of . Our goal is to both determine the 3D extent of unlabeled lesions:
| (3) |
and also recover the full 3D extent of any response evaluation criteria in solid tumours-marked lesion, i.e., convert to 3D bounding boxes. To do this, we first construct a completely annotated set of computed tomography volumes, , by augmenting the original response evaluation criteria in solid tumours marks for these volumes with additional manual annotations for . We denote the supplementary and complete response evaluation criteria in solid tumours marks as and .
The remainder of volumes we wish to harvest from are denoted as , which are accompanied by their incomplete set of response evaluation criteria in solid tumours marks, . By exploiting and , we attempt to discover all unlabeled lesions in and the full 3D extent of both marked and unmarked lesions. Importantly, we constrain the size of to be much smaller than , e.g., , to keep labor costs low.
In the initial round, we train a lesion proposal generator (LPG) using only the response evaluation criteria in solid tumours-derived 2D bounding boxes and . To ensure flexibility, any state-of-the-art lesion detector can be used, either an off-the-shelf variant or the customized contextual-enhanced CenterNet (CECN) approach we elaborate in Sec. III-B. After convergence, we then execute the trained lesion proposal generator on , producing a set of 3D lesion proposals, . These likely cover a large number of lesions but they may suffer from high false positive rates. To correct this, we divide into and as proposals generated from and , respectively. By comparing with , we can further divide it into true and false positives:
| (4) |
where we use a pseudo-3D metric described in Sec. III-E to determine whether a 3D proposal and a response evaluation criteria in solid tumours-derived 2D bounding box intersect. Similarly, we can create a set of generated lesion proposals that intersect with the response evaluation criteria in solid tumours marks from , which we denote . We then train a lesion proposal classifier (LPC) by using and for positive training examples and for negative examples. Like the lesion proposal generator, any well-performing classification method can be used; however, we show that global-local classifier with multi-view input (GLC-MV) is particularly useful. The trained lesion proposal classifier is then used to classify the remaining proposals from into and , which are the harvested positive and negative lesion proposals, respectively.
In subsequent rounds, we harvest positive and negative 3D proposals to finetune the lesion proposal generator and begin the process anew. Yet, when fine tuning the proposed contextual-enhanced CenterNet we employ a hard negative suppression loss (HNSL) using and as mined hard negatives. We index algorithm iterations with subscript and each iteration will provide harvested lesion proposals. Accordingly, the complete pool of all harvested lesions is iteratively updated as
| (5) |
where we abuse notation here and use as an operator that will fuse lesion proposals of the same lesion by simply keeping the one with the highest detection confidence. For we only keep proposals intersecting with the response evaluation criteria in solid tumours marks. As for hard negatives, these are reset after each iteration. Unless needed, we drop the round index for clarity. Below, we elaborate further on the individual system components.
III-B Lesion Proposal Generation

The lesion proposal generator (LPG) uses a detection framework to generate lesion proposals. Following the state-of-the-art on DeepLesion [15], our lesion proposal generator relies on a 2.5D lesion detection model to process CT images slice by slice; thus, 2D proposals must be aggregated together to produce 3D proposals. We outline each consideration below.
III-B1 Contextual-enhanced CenterNet (CECN)
The task of our lesion proposal generator is to produce as high-quality lesion candidates as possible. While any state-of-the-art detection system can serve as lesion proposal generator, there are attributes which are beneficial. An lesion proposal generator with high sensitivity will help recover unlabeled lesions. Meanwhile, if it retains reasonable specificity, it will make downstream classification of proposals into true- and false-positives much more feasible. Computational efficiency is also important, to not only make training scalable, but also to be efficient in processing large amounts of computed tomography images. Finally, simplicity and efficiency are also crucial virtues, as the lesion proposal generator will be one component in a larger system.
While 3D lesion proposal generators can be powerful, there is no straightforward approach to apply them on picture archiving and communication system-mined data, like DeepLesion, which only provide 2D response evaluation criteria in solid tumours-derived annotations. The de facto standard in lesion detection for DeepLesion are 2D/2.5D approaches [4, 13, 15, 30, 26, 25], which also avoid the prohibitive computational and memory demands of 3D lesion proposal generators. Thus, our lesion proposal generator of choice is a contextual-enhanced CenterNet, which combines state-of-the-art one-stage anchor-free 2D proposal generation [14] with 3D context fusion [15]. Others have articulated the benefits of dense pixel-wise supervision [30, 16] and one-stage approaches provide a more straightforward means to aggregate such signals. Additionally, the choice of an anchor-free approach avoids the need to tune anchor-related hyper-parameters. Because lesions have convex shapes which have centroids located inside lesions, the center-based loss of CenterNet [14] is a natural choice. A final advantage to the one-stage anchor-free approach, which we will show in Sec. III-D, is that it allows for a natural incorporation of hard negative examples, which significantly improves performance.
We then follow the same pipeline and hyper-parameter settings described by Zhou et al., [14]. Namely, we create ground-truth heat-maps centered at each lesion using Gaussian kernels . The training objective is to then produce a heatmap, , using a penalty-reduced pixel-wise logistic regression with focal loss [31]:
| (6) |
where is the number of objects in the slice and and are hyper-parameters of the center loss. At every output pixel, the width, height, and offset of lesions are also regressed, but they are only supervised where . The lesion proposals are produced by combining center points with regressed width and height. See Zhou et al., [14] for more details.
To incorporate 3D context, which Yan et al., [15] demonstrated can benefit lesion detection, we use a 2.5D DenseNet-121 backbone [32]. This backbone is associated with the highest performance for DeepLesion detection to-date [15] and functions by including consecutive computed tomography slices as input channels. Based on a balance between performance and computational efficiency, we follow Yan et al., [15] choose to include the adjoining slices above and below.
III-B2 3D Proposal Generation
Regardless of the lesion proposal generator used, if it operates slice-wise, like the contextual-enhanced CenterNet, then post-processing is required to generate 3D proposals, . To do this, we first apply the lesion proposal generator to scan over computed tomography volumes generating detection results on every axial slice. This produces a set of 2D proposals, each with a detection score. Next, we stack proposals in consecutive slices using the same Kalman filter-based bounding box tracker as Yang et al., [33]. More specifically, we first select 2D proposals whose detection score is greater than a threshold . 2D proposals from adjoining slices are then stacked together if their intersection over union is . Finally, in case the lesion proposal generator misses lesions in intermediate slices, we extend each 3D box up and down by one slice, and if any two 3D boxes become connected with overlap on the connecting slices, then they will be fused as one 3D proposal. When lesion harvesting, we choose as the value for which helps keep the number of proposals manageable. However, our experience indicates that results are not sensitive to significant deviations from our chosen threshold value.
The next step in our process is to separate lesion candidates, , into true- and false-positives. Because we have access to a small subset of fully-annotated volumes, , we can identify the 3D proposals that overlap (see Sec. III-E) with the response evaluation criteria in solid tumours marks to be true-positives and denote them as . The remaining false-positive proposals are denoted . We can also identify true-positives that overlap with existing response evaluation criteria in solid tumours marks in . Because is only partially labeled, the remainder of proposals must be filtered somehow into true and false positives.
III-C Lesion Proposal Classification

With the manually verified proposals in hand, namely , , and , the aim is to identify proposals in . To do this, we use the verified proposals to train a binary lesion proposal classifier (LPC). In principle, any classifier can be used, but we opt for a global-local classifier with multi-view input (GLC-MV), which combines two main concepts. The first concept is that 3D context is necessary for differentiating true positive lesion proposals from false positives [28, 27], whether for machines or for clinicians. A fully 3D classifier can satisfy this need, but, as we show in the results, a multi-view approach that operates on transverse, sagittal, and coronal planes centered at each proposal can perform better. This matches prior practices [34] and has the virtue of offering a much more computational and memory efficient means to encode 3D context compared to true 3D networks.
The second concept is multi-scale learning. As reported by Yan et al., [5], a “global” context can aid in lesion characterization. This is based on the intuition that the surrounding anatomy can help place a prior on how lesions should appear. We use the same recommendation as Yan et al., and use a region centered at each lesion to extract global features. ROI pooling based on the lesion proposal is then used to extract more local features. The local and global features are concatenated together before being processed by a fully-connected layer. The global-local classifier with multi-view input is shown in Fig. 4.
We choose to use a ResNet-18 [35] as our backbone because of its proven usefulness and availability of pre-trained weights. The lesion proposal classifier is trained with the manually verified proposals using cross-entropy loss. We expect , , and to be representative of the actual distribution of lesions in DeepLesion. In particular, although the negative samples are only generated from , they should also be representative to the dataset-wide distribution of hard negatives since the hard negatives are typically healthy body structures, which are common across patients.
With the lesion proposal classifier trained, we then apply it to the proposals needing harvesting: . Since the lesion proposal generator and lesion proposal classifier are independently trained, we make an assumption, for simplicity, that their pseudo-probability outputs are independent as well. Thus, the final score of a 3D proposal can be calculated as
| (7) |
where is called the lesion score and and are the lesion proposal generator detection score and lesion proposal classifier classification probability, respectively. We obtain the former by taking the max detection score across all 2D boxes in the proposal. Based on , we generate prospective positive proposals, , by choosing a threshold for that corresponds to a precision above on the completely annotated set . From the remainder, we select proposals whose detection score satisfy as the hard negative examples. Then from each volume we choose up to five negative examples with the top detection scores to construct .
III-D Iterative Updating
After a round of harvesting, we repeat the process by fine-tuning the lesion proposal generator, but with important differences. First, we now have prospective positive proposals corresponding to unlabeled lesions, i.e., , to feed into training. In addition, for all proposals, even those corresponding to response evaluation criteria in solid tumours-marked lesions, we now have 3D proposals. To keep computational demands reasonable, only the 2D slices with the highest detection score within each proposal are used as additional samples to augment the original response evaluation criteria in solid tumours slices.
Secondly, to incorporate harvested hard negative proposals, we use the same procedure in Sec. III-B, but replace the center-loss in Eq. 6 with our proposed hard negative suppression loss (HNSL). To do this, we create separate heat maps for positive (response evaluation criteria in solid tumours-marked or prospective positive) and hard-negative lesions. We denote these heat maps as and , respectively. We then create a master ground truth heat map, , by overwriting with :
| (8) |
The result is a ground truth map that can now range from . When used in the loss of (6), the effect is that positive predictions in hard negative regions are penalized much heavier than standard negative regions ( times heavier when ). This simple modification works surprisingly well for further reducing false positive rates. We visually depict example ground truth heatmaps in Fig. 5.

III-E Pseudo-3D Evaluation
Apart from the lesion completion framework, introduced above, another important aspect to discuss is evaluation. Current DeepLesion works [4, 13, 15, 30, 26, 26, 25] operate and evaluate only based on the 2D response evaluation criteria in solid tumours marks on selected 2D slices that happen to contain said marks. This is problematic, as response evaluation criteria in solid tumours-based evaluation will not reflect actual performance: it will miscount true positives on unmarked lesions or on adjoining slices as false positives. Moreover, automated methods should process the whole image volume, meaning precision should be correlated to false positives per volume rather than per selected slice. In this way, automated methods can be more effective on holistically describing and recording tumor existence, complimentary to human efforts to better achieve precision medicine.
Because we aim to harvest 3D bounding boxes that cover all lesions, we must evaluate, by definition, on completely annotated test data. Yet, it is not realistic to assume data will be fully annotated with 3D bounding boxes. Instead, a more realistic prospect is that test data will be completely annotated with 2D response evaluation criteria in solid tumours marks, especially by clinicians who are more accustomed to this. Thus, assuming this is the test data available, we propose a pseudo 3D (P3D) intersection over union metric. For each response evaluation criteria in solid tumours mark, we can generate 2D bounding boxes based off of their extent, as in [4]. This we denote , where is the slice containing the mark. Given a 3D bounding box proposal, , our pseudo 3D IoU metric will be counted as a true positive if and only if and . Otherwise, it is considered a false positive. Because we publicly release complete response evaluation criteria in solid tumours marks of volumes, the pseudo 3D intersection over union metric can also be used to benchmark DeepLesion detection performance, replacing the one currently used. As we show in the results, the pseudo 3D intersection over union metric is a much more accurate performance measure.
IV Experiments
IV-A Dataset
To harvest lesions from the DeepLesion dataset, we randomly selected volumes from the original training computed tomographys22 2 https://nihcc.app.box.com/v/DeepLesion. These are then annotated by a board-certified radiologist. Of these, we select as () and leave another as an evaluation set for lesion harvesting. This latter subset, denoted , is treated identically at , meaning the algorithm only sees the original DeepLesion response evaluation criteria in solid tumours marks. After convergence, we can measure the precision and recall of the harvested lesions. In addition, we later measure detection performance on systems trained on our harvested lesions by also fully annotating, with response evaluation criteria in solid tumours marks, of the testing computed tomography volumes. These volumes, denoted , are never seen in our harvesting framework. To clarify the dataset split in our experiments, we show it hierarchically in Fig. 6.

IV-B pseudo 3D IoU Evaluation Metric
Before validating our lesion harvesting framework, we first validate our proposed pseudo 3D metric. To do this, we used 3D bounding boxes to annotate a small set of CT test volumes, randomly selected from . From these, we can calculate a “gold-standard” 3D intersection over union metric, and analyze the concordance of different proxies. Accordingly, we trained state-of-the art detection methods (the same outlined in Table IV’s later experiments) on the DeepLesion dataset and measured their performance using 3D intersection over union, incomplete response evaluation criteria in solid tumours [4], and the proposed pseudo 3D intersection over union metrics. We use a 3D intersection over union threshold of , instead of commonly used in 2D applications, to help compensate for the severity of 3D intersection over union. As shown in Fig. 7b and Fig. 7a, we measured free-response ROC curve curves and compare detection recalls of these methods at operating points varying from false positive rates of to per volume. As can be seen, our pseudo 3D metric has much higher concordance with the true 3D intersection over union than does the incomplete 2D response evaluation criteria in solid tumours metric. Moreover, the latter exhibits a relationship that is much noisier and non-monotonic, making it likely any ranking of methods does not correspond to their true ranking. Thus, for the remainder of this work we report lesion harvesting and lesion detection performance using only the pseudo 3D metric. Moreover, we advocate using the pseudo 3D metric, and the fully response evaluation criteria in solid tumours-annotated test sets we publicly release, to evaluate DeepLesion detection systems going forward.
We also evaluated whether the Kalman filtering method in Sec. III-B can produce accurate 3D lesion proposals from 2D detections. Regardless of the detection framework used, median 3D intersection over unions are , which is a high overlap for 3D detection. All of the first quartiles are above 3D intersection over union, indicating that the most of the reconstructed 3D boxes are of high quality. Violin plots can be found in our supplementary material.
IV-C Main Result: Lesion Harvesting
| Training Label Set | R@80P | R@85P | R@90P | R@95P | Avg. |
|---|---|---|---|---|---|
| (response evaluation criteria in solid tumours) | 36.7100P | ||||
| MGTM-SLLP [20] | 40.0 | 38.8 | 38.6 | 37.6 | 38.7 |
| 46.7 | 42.4 | 40.7 | 39.9 | 42.4 | |
| 46.3 | 45.7 | 44.0 | 41.7 | 44.5 | |
| 52.4 | 50.0 | 44.7 | 41.3 | 47.1 | |
| 51.4 | 50.5 | 47.9 | 41.2 | 47.7 | |
| 53.3 | 50.0 | 46.1 | 41.9 | 47.8 | |
| 52.9 | 48.6 | 45.8 | 42.5 | 47.4 | |
| 53.3 | 48.6 | 43.8 | 40.2 | 46.5 | |
We validate our lesion harvesting by running it for 6 iterations. As can be seen in Table I, the set of original response evaluation criteria in solid tumours-marked lesions, , only has a recall of for the lesions in , with an assumed precision of . After one iteration, the initial lesion proposals generated by the contextual-enhanced CenterNet-based lesion proposal generator, denoted as , can boost the recall to , while keeping the precision at . However, after filtering with our global-local classifier with multi-view input-based lesion proposal classifier, which selects from , the recall is boosted to , representing increase in recall over . This demonstrates the power and usefulness of our lesion proposal generator and lesion proposal classifier duo. After rounds of our system, the performance increases further, topping out at recall at precision. This corresponds to harvesting more lesions from the CT volumes. As Table I also indicates, running Lesion-Harvester for more rounds after does not notably contribute to performance improvements. Fig. 8a, depicts precision/recall curves for the first three rounds and it can be seen that precision/recall curve has begun to top out after the third round. Finally, we also compare against the missing ground-truth mining-slice-level label propagation lesion mining algorithm [20]. As can be seen, while missing ground-truth mining-slice-level label propagation can also improve recall, the Lesion-Harvester outperforms it by in recall at precision.
Importantly all 2D lesion bounding boxes are now also converted to 3D. It should be stressed that these results are obtained by annotating volumes, which represents only of the original training split of DeepLesion. In terms of the distribution of harvested lesions, they match the original DeepLesion distribution which is weighted toward lung, liver, kidney lesions as well as enlarged lymph nodes. In our supplementary material, we illustrate the similarity of the distributions between the original DeepLesion lesions and the harvested ones in details. Fig. 10 provides some visual examples of the harvested lesions. As can be seen, lesions missing from the original response evaluation criteria in solid tumours marks can be harvested. These examples, coupled with the quantitative boosts in recall (seen in Fig. 8a), demonstrate the utility and power of our lesion harvesting approach.
In our implementation, we trained the lesion proposal generator and lesion proposal classifier using NVIDIA RTX6000 GPUs, which took a few hours to converge for each round. However, producing the lesion proposals after each round is time consuming ( hours) since it requires the lesion proposal generator to scan every CT slice in DeepLesion. In total, the Lesion-Harvester takes days to converge on DeepLesion.
IV-D Ablation Study: lesion proposal generator
| Exp. | iter. | Recall (%) FPs[0.125,0.25,0.5,1,2,4,8] per volume | ||||||||||||
| (a) | 1 | ✓ | 12.0 | 21.0 | 31.7 | 45.7 | 53.1 | 61.0 | 66.9 | |||||
| (b) | 1 | ✓ | ✓ | 16.0 | 21.7 | 32.9 | 44.3 | 55.7 | 62.6 | 69.5 | ||||
| (c) | 2 | ✓ | ✓ | ✓ | 19.5 | 27.4 | 36.9 | 48.8 | 55.5 | 64.8 | 70.5 | |||
| (d) | 2 | ✓ | ✓ | ✓ | ✓ | 17.9 | 31.2 | 45.5 | 52.4 | 60.5 | 66.2 | 72.6 | ||
| (e) | 2 | ✓ | ✓ | ✓ | ✓ | ✓ | 28.9 | 35.5 | 45.5 | 53.1 | 57.6 | 65.2 | 70.7 | |
| (f) | 2 | ✓ | ✓ | ✓ | ✓ | ✓ | ✓ | 30.4 | 38.6 | 47.1 | 53.6 | 58.6 | 62.6 | 68.3 |
| (g) | 3 | ✓ | ✓ | ✓ | ✓ | ✓ | ✓ | 25.5 | 38.8 | 47.1 | 54.3 | 59.5 | 64.1 | 71.7 |
Table II presents the performance of the contextual-enhanced CenterNet-based lesion proposal generator when trained with different combinations of harvested lesions. Please note, these results only measure the lesion proposal generator performance, and do not include the effect of the lesion proposal classifier filtering. First, as expected, when including the additional labeled proposals, , the performance does not improve much over simply using the original response evaluation criteria in solid tumours marks. This reflects the relatively small size of compared to the entire dataset. However, larger impacts can be seen when including the hard negatives, , from the fully-labeled subset. When including hard negatives from our volumes needing harvesting, i.e., , performance boosts are even greater at the high precision operation points where FPs . This validates our hard negative suppression loss approach of using hard-negative cases. Meanwhile, the addition of extra positive samples, and , contribute much to the recall when FPs per volume, as the trained lesion proposal generator becomes much more sensitive. In summary, these results indicate that the harvested lesions and hard negatives can significantly boost how many lesions can be recovered from the DeepLesion dataset.
Because of the simple one-stage anchor-free architecture, our proposed contextual-enhanced CenterNet processes CT slices at the speed of frames per second (FPS). It runs two times faster than Faster R-CNN [17]. It largely speeds up the lesion mining pipeline and will satisfy clinical needs better.
In addition to measuring the impact of the different types of harvested lesions, we also ran the Lesion-Harvester pipeline with different lesion proposal generators by replacing contextual-enhanced CenterNet with CenterNet [14] and Faster R-CNN [17]. We compare different lesion proposal generators in Fig. 9 and demonstrate that our proposed pipeline generalizes well across choices of lesion proposal generator. We monitor the mean recall on the validation set and stop algorithm updates after this value has converged. We plot the mean recalls of the first four iterations in Fig. 9. Compared with the baseline recall provided by response evaluation criteria in solid tumours marks, Lesion-Harvesters using Faster R-CNN [17], CenterNet [14], and our proposed contextual-enhanced CenterNet have achieved , , and improvements, respectively. In spite of the used lesion proposal generator, our proposed pipeline can roughly recover of unlabeled lesions. We also note that more powerful lesion proposal generators could result in faster convergence rates as well as better recovery rates.

IV-E Ablation Study: lesion proposal classifier
| Method | R@ | R@ | R@ | R@ | R@ |
|---|---|---|---|---|---|
| 80P | 85P | 90P | 95P | Avg. | |
| MLC3D [28] | 42.4 | 41.2 | 39.8 | 38.0 | 40.3 |
| ResNet-3D | 44.8 | 43.3 | 42.1 | 40.0 | 42.6 |
| GLC-3D | 46.0 | 43.4 | 42.6 | 40.7 | 43.2 |
| ResNet-MV | 47.9 | 46.2 | 43.1 | 40.1 | 44.3 |
| GLC-MV | 47.4 | 46.3 | 44.7 | 40.4 | 44.7 |
We validate our choice of lesion proposal classifier by first comparing the performance of different global-local classifiers evaluated on at the first iteration of our method. We compare our multi-view global-local classifier with multi-view input with two alternatives: a 2D variant that only accepts the axial view as input and a 3D version of ResNet-18 [36]. We measure results when using the raw lesion proposal generator detection score (), lesion proposal classifier classification probability (), and the final lesion score () of Eq. 7. As can be seen in Fig. 8b, not all lesion proposal classifiers outperform the raw detection scores (). However, they all benefit from the re-scoring of Eq. 7 using detection scores. Out of all options, the multi-view approach works the best. In addition to its high performance, it also has the virtue of being much simpler and faster than a full 3D approach.
In addition, we also validate the global-local feature. To do this, we compare against ResNet classifiers, both multi-view and 3D, that forego the global-local feature concatenation. We also test against a recent multi-scale approach called multi-level contextual 3-D [28], which is designed for lesion false positive filtering. We also implemented the 3D classifier presented in [27]; however, it did not converge with DeepLesion as it uses a much shallower network than ResNet18. For all, we evaluated using different input sizes centered at the lesion: (24244), (48488), (646416), and (12812832). Here we only report results using the best scale for each, but our supplementary material contains more complete results. As can be seen in Table III, multi-level contextual 3-D [28] does not deliver any improvement over standard ResNet-3D. In contrast the global-local variants outperform their standard counterparts demonstrating the effectiveness of our multi-scale approach design. Again, the global-local classifier with multi-view input delivers the best classification performance.
IV-F Main Result: Detectors Trained on Harvested Lesions
While the above demonstrated that we can successfully harvest missing lesions with high precision, it remains to be demonstrated how beneficial this is. To this end, we train state-of-the-art detection systems with and without our harvested lesions and also compare against some alternative approaches to manage missing labels.
| Method | Backbone | Input | Recall (%) FPs[0.125,0.25,0.5,1,2,4,8] per volume | AP | |||||||||
| MULAN [15] | 2.5D DenseNet-121 | 9 | ✓ | 11.43 | 18.69 | 26.98 | 38.99 | 50.15 | 60.38 | 69.71 | 41.8 | ||
| Faster R-CNN [17] | 2.5D DenseNet-121 | 9 | ✓ | 07.20 | 13.21 | 20.97 | 31.27 | 43.87 | 54.92 | 64.20 | 34.2 | ||
| w/ OBHS [17] | 2.5D DenseNet-121 | 9 | ✓ | 02.51 | 04.77 | 08.40 | 17.46 | 22.65 | 34.24 | 47.01 | 17.3 | ||
| w/ OBSS [18] | 2.5D DenseNet-121 | 9 | ✓ | 06.85 | 12.58 | 21.92 | 32.39 | 44.53 | 57.08 | 67.91 | 36.3 | ||
| w/ M-OBHS | 2.5D DenseNet-121 | 9 | ✓ | 08.53 | 13.67 | 22.89 | 34.46 | 46.85 | 58.31 | 68.08 | 38.3 | ||
| Faster R-CNN | 2.5D DenseNet-121 | 9 | ✓ | ✓ | 10.35 | 15.98 | 25.02 | 35.63 | 47.15 | 57.74 | 66.77 | 38.5 | |
| w/ ULDor [30] | 2.5D DenseNet-121 | 9 | ✓ | ✓ | ✓ | 22.95 | 30.15 | 38.09 | 46.90 | 55.23 | 63.05 | 70.48 | 51.3 |
| CenterNet | DenseNet-121 | 3 | ✓ | 12.91 | 19.89 | 26.19 | 35.77 | 45.32 | 56.94 | 67.83 | 41.0 | ||
| CenterNet | DenseNet-121 | 3 | ✓ | [20] | 12.47 | 18.12 | 25.36 | 35.03 | 46.52 | 58.20 | 68.95 | 41.3 | |
| CenterNet | DenseNet-121 | 3 | ✓ | ✓ | 14.38 | 19.75 | 28.04 | 36.89 | 46.82 | 58.94 | 68.70 | 42.8 | |
| CenterNet w/ hard negative suppression loss | DenseNet-121 | 3 | ✓ | ✓ | ✓ | 19.26 | 25.87 | 34.54 | 43.17 | 53.34 | 63.08 | 71.68 | 48.3 |
| contextual-enhanced CenterNet | 2.5D DenseNet-121 | 9 | ✓ | 11.92 | 18.42 | 27.54 | 38.91 | 50.15 | 60.76 | 69.82 | 43.0 | ||
| contextual-enhanced CenterNet | 2.5D DenseNet-121 | 9 | ✓ | [20] | 15.88 | 20.98 | 29.40 | 38.36 | 47.89 | 58.14 | 67.89 | 43.2 | |
| contextual-enhanced CenterNet | 2.5D DenseNet-121 | 9 | ✓ | ✓ | 13.40 | 19.16 | 27.34 | 37.54 | 49.33 | 60.52 | 70.18 | 43.6 | |
| contextual-enhanced CenterNet w/ hard negative suppression loss | 2.5D DenseNet-121 | 9 | ✓ | ✓ | ✓ | 19.86 | 27.11 | 36.21 | 46.82 | 56.89 | 66.82 | 74.73 | 51.9 |
IV-F1 Using Harvested Lesions and Hard Negative Examples
After our method converged, we fused mined lesions and hard negatives, i.e., and , respectively. We tested CenterNet [14], Faster R-CNN [16], and our contextual-enhanced CenterNet (used now as a detector instead of an lesion proposal generator), trained both on the original DeepLesion response evaluation criteria in solid tumours marks and on the data augmented with our harvested lesions. Since multitask universal lesion analysis network requires tags, which are not available for harvested lesions, we only test it using the publicly-released model. As well, we also test the impact of our hard negatives (), with our proposed hard negative suppression loss on CenterNet and contextual-enhanced CenterNet. We do not test the hard negative suppression loss with Faster R-CNN, since it is not compatible with two-stage anchor-based systems. Instead, we follow Tang et al.,’s (ULDor) [30], which is a hard-negative approach designed for Faster R-CNN that defines an additional non-lesion class containing all hard negative examples. We test all detector variants on the unseen fully labeled data.
As Table IV demonstrates, using the harvested lesions to train detectors can provide significant boosts in recall and precision for all methods. For instance, the extra mined lesions boosts Faster R-CNN’s detection performance by in average precision. When incorporating hard negatives using the hard negative suppression loss, CenterNet and contextual-enhanced CenterNet both benefited even more, with additional boosts of average precision. In total, the harvested prospective positive and hard negative lesions are responsible for a boost of and in average precision, for CenterNet and contextual-enhanced CenterNet, respectively, representing a dramatic boost in performance. Despite the great differences in architecture, incorporating harvested hard negatives as an extra non-lesion class [30] also significantly boosts Faster R-CNN performance, further demonstrating the broad impact of the Lesion-Harvester proposals. Finally, we also note that our contextual-enhanced CenterNet outperforms the state-of-the-art lesion detection model, multitask universal lesion analysis network [15], even when no mined lesions are used. The addition of mined lesions, which is not directly applicable with multitask universal lesion analysis network, further boosts the performance gap to . This further validates our lesion proposal generator design choices and represents an additional contribution of this work, in addition to our main focus of lesion harvesting.
IV-F2 Alternative Missing Label Approaches
We also evaluated other strategies for managing missing labels. These include overlap-based hard sampling (OBHS) [17] and overlap-based soft sampling (OBSS) [18], both of which are designed only for two-stage anchor-based detection networks, meaning they are incompatible with our one-stage contextual-enhanced CenterNet. Thus, we use Faster R-CNN as baseline and compared overlap-based hard sampling and overlap-based soft sampling to training using our harvested prospective positive lesions, . overlap-based hard sampling only uses proposals with small overlap to a true positive as negative examples for the second stage classifier. As Table IV demonstrates, the baseline Faster R-CNN performed with average precision, whereas using overlap-based hard sampling reduced the average precision to , demonstrating that simply ignoring the predominant background negatives causes large performance degradation. Thus, we also re-trained Faster R-CNN with a modified overlap-based hard sampling (M-OBHS), which preserves all background samples but raises weights of overlapping proposals to be twice as much as positive and standard background cases. This variant achieved average precision. As a different strategy, overlap-based soft sampling reduces the contributions of proposals which have small overlaps with the ground truth boxes but keeps all background cases. This strategy increased the average precision to . Finally, our method that trains Faster R-CNN with harvested prospective positive lesions achieved the best performance at average precision, with markedly higher recalls at lower tolerated false positives. This demonstrates that completing the label set with harvested lesions can provide greater boosts in performance than these alternative strategies.
Moving on to a more general approach, we also compare against the missing ground-truth mining-slice-level label propagation [20] lesion mining algorithm. As shown in Table IV, missing ground-truth mining-slice-level label propagation boosts the average precision of CenterNet from to , while training with results in a much larger boost to . Similarly, training with garners higher boosts in average precision when using our contextual-enhanced CenterNet detector. Unlike missing ground-truth mining-slice-level label propagation, Lesion-Harvester explores the whole computed tomography volume, iteratively improving performance after each round, and integrates hard negatives within the training of lesion proposal generator. We surmise these differences explain the increased performance even when comparisons are limited to only using the harvested positive proposals of . Finally, as we demonstrate, when using our harvested hard-negative proposals performance can be increased even further.
V Conclusions
We present an effective framework to harvest lesions from incompletely labeled datasets. Leveraging a very small subset of fully-labeled data, we chain together an lesion proposal generator and lesion proposal classifier to iteratively discover and harvest unlabeled lesions. We test our system on the DeepLesion dataset and show that after only annotating of the volumes we can successfully harvest additional lesions, which corresponds to recall at precision, which is a boost of in recall over the original response evaluation criteria in solid tumours marks. Since, our proposed method is an open framework, it can accept any state-of-the-art lesion proposal generator and lesion proposal classifier, allowing it to benefit from future improvements in these two domains.
Our work’s impact has several facets. For one, in terms of DeepLesion specifically, the lesions we harvest and publicly release enhance the utility of an already invaluable dataset. As we demonstrated, training off-the-shelf detectors on our harvested lesions allows them to outperform the current best performance on the DeepLesion dataset by margins as high as average precision, which is a significant boost in performance. Furthermore, we expect our harvested lesions will prove useful to many applications beyond detection, e.g., radionomics studies. More broadly, our results indicate that the lesion harvesting framework is a powerful means to complete picture archiving and communication system-derived datasets, which we anticipate will be an increasingly important topic. Thus, this approach may help further expand the scale of data for the medical imaging analysis field.
Important contributions also include our proposed contextual-enhanced CenterNet lesion proposal generator, which outperforms the current state-of-the-art multitask universal lesion analysis network detector and helps push forward the lesion detection topic. In addition, the introduced pseudo 3D IoU metric acts as a much better evaluation metric for detection performance than current practices. As such, the adoption of the pseudo 3D metric as a standard for DeepLesion evaluation should better rank methods going forward. Future work should include investigating different lesion proposal generator paradigms, e.g., full 3D approaches, executing user studies, e.g., to assess and compare with clinician performance, and exploring active learning to more efficiently choose which volumes to label. In addition, it is also crucial to measure the impact of differing labor budgets on harvesting performance. Finally, we estimate that possibly of the lesions still remain unlabeled in DeepLesion. It is possible to calibrate our proposed lesion proposal generator to detect lesions with above recall, however, the challenge is to separate true lesions from thousands of false positives. Therefore, one other promising avenue is to model the relationship between lesions proposals for false positive reduction, which may lead to non-parametric matching and graph-based connections between instances within the dataset. We hope the public annotations and benchmarks we release will spur further solutions to this important problem.
Supplementary Material
V-A Evaluation of Generated 3D Boxes
We evaluate the generated 3D boxes using the testing cases with full 3D box annotations. With each annotated lesion, we compare the generated 3D box with the ground-truth 3D box with 3D-intersection over union. To demonstrate the quality of reconstructed 3D boxes, we show violin plot of 3D-IoU in Fig. 11. Regardless of the chosen lesion proposal generator, medians are around 3D-intersection over union, which is considered as a high overlap value in 3D detection. All of the first quartiles are above 3D-intersection over union showing that the most of the reconstructed 3D boxes are of high qualities.
V-B Lesion Type Analysis of Mined Lesions
DeepLesion contains various types of lesions, but the major categories are lung, liver, kidney lesions as well as enlarged lymph nodes. Therefore, the proposed algorithm is more sensitive to these major lesion categories. We applied the lesion embedding and classification method proposed by Yan et al., [5] to our mined lesions. Visualization of the embeddings of the original response evaluation criteria in solid tumours-marked lesions and mined lesions are show in Fig. 12. We observe that the mined lesions roughly follow the distribution of the original lesion distribution.
V-C Comparison of lesion proposal classifiers
To demonstrate the effectiveness of our proposed global-local design, we evaluated different input scales including scale-1 (24244), scale-2 (48488), scale-3 (646416), and scale-4 (12812832) and each cropped sub-volume is centered at the centroid of the detected lesion proposal. The four scales cover , , , and response evaluation criteria in solid tumours markers in , respectively. With each scale, we train a ResNet-3D [36] and measure the mean of recalls from recall at 80% precision to recall at 95% precision. From Table V, we observe that the mean recall decreases along with the input scale increases. It indicates direct mixing of foreground and background should harm lesion recognition in DeepLesion. multi-level contextual 3-D [28] combines predictions of scale-1, scale-2, and scale-3, however, it does not deliver any improvement. We then test our global-local design using ResNet-3D [36]. Fig. 13 shows our design of global-local classifier with 3D input, which utilizes lesion proposals to extract local features for classification. In Table V, global-local classifier with 3D input outperforms its counterpart “ResNet-3D with scale-4” by , demonstrating the effectiveness of modeling foreground and background separately. The ResNet-3D with “box” input processed only the local (or foreground) image. Compared with global-local classifier with 3D input, it has higher R@95P value indicating better specificity on certain lesions, however, its lower recall at 80% precision, recall at 85% precision, and recall at 90% precision values showing worse generalizability since no background context has been considered. Finally, the global-local classifier with multi-view input combines multi-view structure with the global-local design and delivers the best classification performance in DeepLesion.
| Method | Input | R@ | R@ | R@ | R@ | R@ |
|---|---|---|---|---|---|---|
| 80P | 85P | 90P | 95P | Avg. | ||
| ResNet-3D | scale-1 | 44.8 | 43.3 | 42.1 | 40.0 | 42.6 |
| ResNet-3D | scale-2 | 42.4 | 43.1 | 41.3 | 38.8 | 41.0 |
| ResNet-3D | scale-3 | 41.9 | 41.7 | 40.7 | 38.7 | 40.7 |
| ResNet-3D | scale-4 | 41.2 | 40.7 | 39.2 | 38.3 | 40.3 |
| MLC3D [28] | scale-1&2&3 | 42.4 | 41.2 | 39.8 | 38.0 | 40.3 |
| ResNet-3D | scale-4, box | 45.7 | 43.2 | 42.3 | 41.2 | 43.1 |
| GLC-3D | scale-4, box | 46.0 | 43.4 | 42.6 | 40.7 | 43.2 |
| ResNet-MV | scale-4, box | 47.9 | 46.2 | 43.1 | 40.1 | 44.3 |
| GLC-MV | scale-4, box | 47.4 | 46.3 | 44.7 | 40.4 | 44.7 |


References
- [1] P. Rajpurkar, J. Irvin, A. Bagul, and et al., “MURA dataset: Towards radiologist-level abnormality detection in musculoskeletal radiographs,” in MIDL, 2018.
- [2] X. Wang, L. Lu, H. Shin, L. Kim, M. Bagheri, I. Nogues, J. Yao, and R. M. Summers, “Unsupervised joint mining of deep features and image labels for large-scale radiology image categorization and scene recognition,” in Proc. IEEE Winter Conf. Appl. Comput. Vision, 2017, pp. 998–1007.
- [3] X. Wang, Y. Peng, L. Lu, Z. Lu, M. Bagheri, and R. M. Summers, “Chestx-ray8: Hospital-scale chest x-ray database and benchmarks on weakly-supervised classification and localization of common thorax diseases,” in Proc. IEEE Conf. Comput. Vis. Pattern Recognition, 2017, pp. 3462–3471.
- [4] K. Yan, X. Wang, L. Lu, and R. M. Summers, “Deeplesion: automated mining of large-scale lesion annotations and universal lesion detection with deep learning,” J. Med Imaging, vol. 5, no. 3, 2018.
- [5] K. Yan, X. Wang, L. Lu, L. Zhang, A. P. Harrison, M. Bagheri, and R. M. Summers, “Deep lesion graphs in the wild: Relationship learning and organization of significant radiology image findings in a diverse large-scale lesion database,” in Proc. IEEE Conf. Comput. Vis. Pattern Recognition, 2018, pp. 9261–9270.
- [6] M. D. Kohli, R. M. Summers, and J. R. Geis, “Medical image data and datasets in the era of machine learning - whitepaper from the 2016 C-MIMI meeting dataset session,” J. Digital Imaging, vol. 30, no. 4, pp. 392–399, 2017.
- [7] H. Harvey and B. Glocker, “A standardised approach for preparing imaging data for machine learning tasks in radiology,” in Artificial Intelligence in Medical Imaging. Springer, 2019, pp. 61–72.
- [8] J. Irvin, P. Rajpurkar, M. Ko, Y. Yu, S. Ciurea-Ilcus, C. Chute, H. Marklund, B. Haghgoo, R. L. Ball, K. S. Shpanskaya, J. Seekins, D. A. Mong, S. S. Halabi, J. K. Sandberg, R. Jones, D. B. Larson, C. P. Langlotz, B. N. Patel, M. P. Lungren, and A. Y. Ng, “Chexpert: A large chest radiograph dataset with uncertainty labels and expert comparison,” in Proc. AAAI, 2019, pp. 590–597.
- [9] E. Calli, E. Sogancioglu, E. T. Scholten, K. Murphy, and B. van Ginneken, “Handling label noise through model confidence and uncertainty: application to chest radiograph classification,” in Medical Imaging 2019: Computer-Aided Diagnosis, vol. 10950, 2019, p. 1095016.
- [10] J. Deng, W. Dong, R. Socher, L. Li, K. Li, and F. Li, “Imagenet: A large-scale hierarchical image database,” in Proc. IEEE Conf. Comput. Vis. Pattern Recognition, 2009, pp. 248–255.
- [11] T. Lin, M. Maire, S. J. Belongie, J. Hays, P. Perona, D. Ramanan, P. Dollár, and C. L. Zitnick, “Microsoft COCO: common objects in context,” in Proc. Eur. Conf. Comput. Vis., vol. 8693, 2014, pp. 740–755.
- [12] E. Eisenhauer, P. Therasse, J. Bogaerts, and et al., “New response evaluation criteria in solid tumours: revised recist guideline (version 1.1),” European journal of cancer, vol. 45(2), pp. 228–247, 2009.
- [13] K. Yan, M. Bagheri, and R. M. Summers, “3D context enhanced region-based convolutional neural network for end-to-end lesion detection,” in Proc. Int. Conf. Med. Image Comput. Computer-Assisted Intervent., 2018, pp. 511–519.
- [14] X. Zhou, D. Wang, and P. Krähenbühl, “Objects as points,” 2019. [Online]. Available: http://arxiv.org/abs/1904.07850
- [15] K. Yan, Y. Tang, Y. Peng, V. Sandfort, M. Bagheri, Z. Lu, and R. M. Summers, “MULAN: multitask universal lesion analysis network for joint lesion detection, tagging, and segmentation,” in Proc. Int. Conf. Med. Image Comput. Computer-Assisted Intervent., 2019, pp. 194–202.
- [16] K. He, G. Gkioxari, P. Dollár, and R. B. Girshick, “Mask R-CNN,” IEEE Trans. Pattern Anal. Mach. Intell., vol. 42, no. 2, pp. 386–397, 2020.
- [17] S. Ren, K. He, R. B. Girshick, and J. Sun, “Faster R-CNN: towards real-time object detection with region proposal networks,” IEEE Trans. Pattern Anal. Mach. Intell., vol. 39, no. 6, pp. 1137–1149, 2017.
- [18] Z. Wu, N. Bodla, B. Singh, M. Najibi, R. Chellappa, and L. S. Davis, “Soft sampling for robust object detection,” in Proc. BMVC, 2019, p. 225.
- [19] G. Wang, X. Xie, J. Lai, and J. Zhuo, “Deep growing learning,” in Proc. IEEE Int. Conf. Comput. Vis., 2017, pp. 2831–2839.
- [20] Z. Wang, Z. Li, S. Zhang, J. Zhang, and K. Huang, “Semi-supervised lesion detection with reliable label propagation and missing label mining,” in Proc. Pattern Recognition Comput. Vis., 2019, pp. 291–302.
- [21] I. Radosavovic, P. Dollár, R. B. Girshick, G. Gkioxari, and K. He, “Data distillation: Towards omni-supervised learning,” in Proc. IEEE Conf. Comput. Vis. Pattern Recognition, 2018, pp. 4119–4128.
- [22] M. Gao, Z. Xu, L. Lu, A. Wu, I. Nogues, R. M. Summers, and D. J. Mollura, “Segmentation label propagation using deep convolutional neural networks and dense conditional random field,” in Proc. IEEE Int. Symp. Biomed. Imag., 2016, pp. 1265–1268.
- [23] J. Cai, Y. Tang, L. Lu, A. P. Harrison, K. Yan, J. Xiao, L. Yang, and R. M. Summers, “Accurate weakly-supervised deep lesion segmentation using large-scale clinical annotations: Slice-propagated 3d mask generation from 2d RECIST,” in Proc. Int. Conf. Med. Image Comput. Computer-Assisted Intervent., 2018, pp. 396–404.
- [24] C. Rother, V. Kolmogorov, and A. Blake, “”grabcut”: interactive foreground extraction using iterated graph cuts,” ACM Trans. Graph., vol. 23, no. 3, pp. 309–314, 2004.
- [25] Q. Shao, L. Gong, K. Ma, H. Liu, and Y. Zheng, “Attentive CT lesion detection using deep pyramid inference with multi-scale booster,” in Proc. Int. Conf. Med. Image Comput. Computer-Assisted Intervent., 2019, pp. 301–309.
- [26] M. Zlocha, Q. Dou, and B. Glocker, “Improving RetinaNet for ct lesion detection with dense masks from weak recist labels,” in Proc. Int. Conf. Med. Image Comput. Computer-Assisted Intervent., 2019, pp. 402–410.
- [27] J. Ding, A. Li, Z. Hu, and L. Wang, “Accurate pulmonary nodule detection in computed tomography images using deep convolutional neural networks,” in Proc. Int. Conf. Med. Image Comput. Computer-Assisted Intervent., 2017, pp. 559–567.
- [28] Q. Dou, H. Chen, L. Yu, J. Qin, and P. Heng, “Multilevel contextual 3-d cnns for false positive reduction in pulmonary nodule detection,” IEEE Trans. Biomed. Engineering, vol. 64, no. 7, pp. 1558–1567, 2017.
- [29] A. Varghese, K. Vaidhya, S. Thirunavukkarasu, C. Kesavdas, and G. Krishnamurthi, “Semi-supervised learning using denoising autoencoders for brain lesion detection and segmentation,” 2016. [Online]. Available: https://arxiv.org/abs/1611.08664
- [30] Y. Tang, K. Yan, Y. Tang, J. Liu, J. Xiao, and R. M. Summers, “Uldor: A universal lesion detector for ct scans with pseudo masks and hard negative example mining,” in 16th IEEE International Symposium on Biomedical Imaging, ISBI 2019, Venice, Italy, April 8-11, 2019, 2019, pp. 833–836.
- [31] T. Lin, P. Goyal, R. B. Girshick, K. He, and P. Dollár, “Focal loss for dense object detection,” in Proc. IEEE Int. Conf. Comput. Vis., 2017, pp. 2999–3007.
- [32] G. Huang, Z. Liu, L. van der Maaten, and K. Q. Weinberger, “Densely connected convolutional networks,” in Proc. IEEE Conf. Comput. Vis. Pattern Recognition, 2017, pp. 2261–2269.
- [33] F. Yang, H. Chen, J. Li, F. Li, L. Wang, and X. Yan, “Single shot multibox detector with kalman filter for online pedestrian detection in video,” IEEE Access, vol. 7, pp. 15 478–15 488, 2019.
- [34] H. R. Roth, L. Lu, A. Seff, K. M. Cherry, J. Hoffman, S. Wang, J. Liu, E. Turkbey, and R. M. Summers, “A new 2.5d representation for lymph node detection using random sets of deep convolutional neural network observations,” in Proc. Int. Conf. Med. Image Comput. Computer-Assisted Intervent., 2014, pp. 520–527.
- [35] K. He, X. Zhang, S. Ren, and J. Sun, “Deep residual learning for image recognition,” in Proc. IEEE Conf. Comput. Vis. Pattern Recognition, 2016, pp. 770–778.
- [36] K. Hara, H. Kataoka, and Y. Satoh, “Can spatiotemporal 3d cnns retrace the history of 2d cnns and imagenet?” in Proc. IEEE Conf. Comput. Vis. Pattern Recognition, 2018, pp. 6546–6555.