Fairness Measures for Regression via Probabilistic Classification
Abstract
Algorithmic fairness involves expressing notions such as equity, or reasonable treatment, as quantifiable measures that a machine learning algorithm can optimise. Most work in the literature to date has focused on classification problems where the prediction is categorical, such as accepting or rejecting a loan application. This is in part because classification fairness measures are easily computed by comparing the rates of outcomes, leading to behaviours such as ensuring that the same fraction of eligible men are selected as eligible women. But such measures are computationally difficult to generalise to the continuous regression setting for problems such as pricing, or allocating payments. The difficulty arises from estimating conditional densities (such as the probability density that a system will over-charge by a certain amount). For the regression setting we introduce tractable approximations of the independence, separation and sufficiency criteria by observing that they factorise as ratios of different conditional probabilities of the protected attributes. We introduce and train machine learning classifiers, distinct from the predictor, as a mechanism to estimate these probabilities from the data. This naturally leads to model agnostic, tractable approximations of the criteria, which we explore experimentally.
1 Introduction
A machine learning algorithm trained with a standard objective such as maximum accuracy can produce behaviours that people, including those affected by its decisions, consider unfair. Algorithmic group fairness seeks to address this problem by defining protected attributes such as age, race or gender, and introducing mathematical fairness measures to evaluate and compare between the protected groups. Many fairness measures have been proposed in the literature, but most can be posed as specialisations of three general criteria, independence, separation and sufficiency, that can be cleanly and intuitively defined in terms of statistical independence [2].
To date, the algorithmic fairness literature has mainly focused on classification problems, where the decisions of a system are binary or categorical, such as predicting who should be released on bail [1], or who should be audited for a potentially fraudulent tax return. In this setting, fairness measures are straightforward to compute based on the fraction of each group that were correctly or incorrectly selected or omitted.
However, there are many impactful regression problems such as how much to lend someone on a credit card or home loan, or how much to charge for an insurance premium. In the continuous setting, the aforementioned fairness criteria are generally intractable to evaluate. Various tractable fairness measures have been proposed, but we believe that many are either (a) not as intuitive to reason about and thus apply as independence, separation and sufficiency, or (b) are simplifications of these that fail to fully capture the important properties of the original criteria.
1.1 Contributions
In this paper we introduce techniques to tractably numerically approximate the independence, separation and sufficiency group fairness criteria in the general regression setting, in a way that is agnostic to the regression algorithms used. In particular, our contributions are,
- •
We approximate fairness criteria for a regression group fairness setting by factorising them as conditional probabilities of the (categorical) protected attribute, and apply estimation techniques based on probabilistic classification [19] and empirical integration to estimate their values. We explore two measures: (1) A density ratio measure that is readily applicable to binary sensitive attribute settings. (2) A more general (conditional) mutual information approximation that is applicable to categorical sensitive attributes and is normalised to a range of , with 0 being perfectly fair and 1 being maximally unfair according to the relevant criterion.
- •
Using these ratio estimation techniques to provide insight into how group fairness criteria operate in a general regression setting. We do this in a synthetic scenario, and benchmark on an existing fair regression algorithm to asses how it addresses the three group fairness criteria.
Due to the general nature of these fairness criteria, we foresee them being useful in many scenarios. Inprocessing model predictions based on the criteria is left to future work. If the predictor may not access the sensitive attributes, preprocessing approaches may then be used to learn a fair representation, potentially incurring additional algorithmic performance and fairness costs [18]. They are also well suited to the regulation and auditing of existing systems, as they only require access to the prediction, outcome and sensitive attributes, while the predictor itself can be a black box system, or even incorporate manual decisions.
1.2 Related work
Predictive fairness measures date back more than fifty years in the context of testing and hiring, as summarised by Hutchinson and Mitchell 2019. Of particular relevance to our work are the measures of regression fairness based on (partial) correlations between the predicted score, the target variable and the demographic group of applicants, as derived in [6, 8]. These measures can be interpreted as relaxations of the independence, separation and sufficiency criteria under the assumption that the outcome, prediction and group are jointly Gaussian distributed. Propensity score stratification techniques have also been used to decrease the separation of the protected class for linear regressors in [5]. Berk et al. 2017 propose fairness objectives that address separation using convex regularisers. One of these regularisers (‘group’) permits cancelling of model errors within a group, addressing an imbalance in expectation, while the other (‘individual’) does not. Fitzsimons et al. 2019 have developed an inprocessing technique for kernel machines and decision tree regressors with a focus on satisfying (a relaxation of) the independence criterion. Recently Williamson and Menon 2019 proposed that risk measures from mathematical finance generalise to fairness measures by imposing that the distribution of losses across subgroups are commensurate. Of particular interest, the conditional value at risk measure leads to a convex inprocessing technique for both regression and classification problems.
Mutual information (MI) has also previously been considered in the context of fair supervised learning. Kamishima et al. 2012 use normalised MI to asses fairness in their normalised prejudice index (NPI). Their focus is on binary classification with binary sensitive attributes, and the NPI is based on the independence fairness criterion. In such a setting mutual information is readily computable empirically from confusion matrices. This work is generalised in [11] for use in regression models by using a neutrality measure, which the authors show is equivalent to the independence criterion. They then use this neutrality measure to create inprocessing techniques for linear and logistic regression algorithms. Similarly, Ghassami et al. 2018 take an information theoretic approach to creating an optimisation algorithm that returns a predictor score that is fair (up to some ) with respect to the separation criterion. These works are mainly concerned with computing MI (or some approximation) in the optimisation objective of particular algorithms. Our main focus in this paper is to compute (conditional) mutual information in a way that is agnostic to the prediction algorithm used.
2 Problem formulation
We consider a predictor with target set, , feature set, , and a sensitive attribute set, . Our data is composed of random variables , and drawn from some distribution over ( is a subset of ). Here is the prediction function that maps , and results in predictions, or scores, , where usually . For the purposes of this paper we will treat as a random variable drawn from a distribution over .
We are specifically interested in approximating independence, separation and sufficiency, a selection that subsumes many other measures as relaxations or special cases [2]. These can be defined in terms of independence or conditional independence statements,
| Independence | (1) | |||||
| Separation | (2) | |||||
| Sufficiency | (3) |
Rather than constraining the predictor such that these conditions be exactly satisfied, we would usually define a continuous measure of the degree to which they are satisfied. This admits a balancing of priorities between these and other measures such as accuracy.
In the classification setting where , and are all categorical, these conditional probabilities can be empirically estimated from confusion matrices between and for each protected subgroup () [2]. In a regression setting, however, they become continuous density functions, and we are required to either assume a parametric form for them, or numerically estimate the densities using methods such as kernel density estimation [14].
Others have simplified these criteria using conditional expectation instead of conditional probability [5, 24, 10]. But these approaches can fail to capture effects, such as groups with different score variances, that can still lead to harm. Our primary aim is to create techniques that tractably approximate the three criteria of group fairness aforementioned in a way that is agnostic to the predictor used to generate the score, . More formally,
Problem Statement.
Derive methods that can approximate the fairness criteria, independence, separation and sufficiency, for and , in the case of binary or categorical sensitive attributes, or .
3 Direct Density Ratio Estimation
By dividing both sides of (1)-(3) by the distributions and firstly considering , we can re-express the fairness criteria as density ratios,
| (4) |
Computing these ratios empirically is a common way to measure the fairness criteria in classification [2], where perfect fairness would correspond to a constant ratio of . In a regression setting it is much easier to estimate the ratios in (4) directly using density ratio estimation methods [21, 20], as opposed to independently estimating the probability densities in (4) then calculating the ratio. Density ratio estimation has wide applicability, for example it has been used to detect and correct covariate shift [4], two sample testing [19], and compute divergence measures such as Kullback Leibler divergence as well as mutual information measures [21, 22].
We will now derive a density ratio estimator for in (4) with binary sensitive attributes. First, begin by recalling Bayes’ Theorem, , and then substituting into ,
| (5) |
We could have also arrived at this directly from (1) by dividing both sides by such that . Pragmatically it would be more useful to know this ratio in expectation, or even approximately as an empirical average over the data we have,
| (6) |
Here we denote instances of random variables by their lower case. is the total number of instances in our dataset and we have approximated as the ratio of the number of instances in each category of the sensitive attribute, . A well known technique is to approximate density ratios directly with the output of a probabilistic classifier [19, 4, 21]. In this case we can use,
| (7) |
where is a prediction of the probability that class made by introducing and training a machine learning classifier (distinct from the machine learning model , which predicts the target). Now we can complete the approximation (6) numerically,
| (8) |
Noting that in the binary classification case, . We can use similar density ratio estimates to approximate and ; again making use of Bayes’ rule, and , we can rewrite,
| (9) |
Now we make use of two more probabilistic classifiers and to approximate and ,
| (10) |
These have an intuitive interpretation; the separation and sufficiency approximations work by determining how much more predictive power the joint distribution of and has in determining over just considering the marginals, or respectively. Similarly for independence, how much more predictive of the score is, , over base rate distribution . We demonstrate this interpretation in §5.1. Naturally this approach requires the classifiers (and data) used to be sufficiently expressive and well calibrated11 1 That is, we require the use of a proper loss so it is possible to recover the posterior class probability from the classifier. For example, log-loss, cross entropy loss, Brier loss etc. such that they can model the distributions with little error [19, 25]. In practice we will always have some error, and unfortunately it is difficult when using cross validation to determine if the classifier error is because of model ‘miss-specification’ or because our predictor score, , is fair. Working with density ratios such as these directly also has some further limitations. For instance, it is awkward when we have categorical sensitive attributes as we would have to look at, or aggregate, density ratios where is the number of categories. Estimating these ratios empirically also suffers from the problem that their value can be dominated by a single instance with vanishing probability in the denominator. Furthermore, it is also difficult to intuit what a maximally unfair score, or unfairness upper bound would be if a finite bound did exist.
4 Mutual Information Estimation
An alternative approach to measuring the fairness criteria that circumvents some of the limitations of the direct density ratio approach is to calculate the mutual information (MI) [12, 7] between variables. This approach also naturally handles categorical sensitive attributes, . For instance, to asses the independence criterion from (1), we can calculate the MI between and ,
| (11) |
where we have omitted the random variables from the above distributions for concision. Here we can see that when we have independence and achieve perfect fairness, , , otherwise MI will be positive22 2 This can be shown by applying Jensen’s Inequality to (11).. This measure naturally deals with binary and categorical . Furthermore, we can normalise MI by one of its many known upper bounds so that it takes values in . One useful upper bound in this context is the entropy of the sensitive attribute, , that gives the normalised measure,
| (12) |
The reason for using as a normaliser is because MI and entropy are related through , where is conditional entropy, and is a measure of how much of the information of the distribution of is encoded by that of . When then , so the distribution of completely encodes all information about — which would be maximally unfair in the case of the independence criterion33 3 Since we can completely recover all information about the sensitive attribute from the model predictions.. As in the case of the direct density ratio estimation, we have to resort to approximation to compute this measure. Firstly, is simple to approximate empirically like previously,
| (13) |
Where is the number of instances that have sensitive attribute . Then we can rewrite mutual information by first dividing by ,
| (14) |
Here we have estimated the integral–sum over empirically. is the sensitive class of the instance, , and we have used classifiers to estimate the conditional densities per instance as before. Finally we can combine (13) and (14) to approximate .
We can proceed along similar lines for the separation and sufficiency criteria, though these require conditional mutual information with conditional entropy normalisers,
| (15) |
Here we can approximate the conditional entropy normalisers again using probabilistic classifiers and estimating the integrals empirically,
| (16) |
These conditional entropy normalisers play a similar role as entropy in the normalised independence criterion measure. For separation and sufficiency, if or respectively this means that in both cases. Intuitively, we can interpret this to mean that jointly and totally determine , which is by definition maximally unfair according to both of these fairness criteria when and respectively. Again using empirical estimation and the three classifier approximations from before we can compute condition mutual information for separation,
| (17) |
and sufficiency,
| (18) |
We will refer to the approximated normalised (conditional) mutual information criteria in (12) and (15) as , and . Now we can directly see that these approximate measures are based on relative classifier predictive probability. However, unlike the direct density ratio measures, these more naturally operate with categorical sensitive attributes using multiclass probabilistic classification, and they have an intuitive upper bound for maximally unfair scores.
5 Experiments
We now present some experiments on simulated and real data with the purpose of demonstrating how these measures work in practice, and providing more clarity into their functioning.
5.1 Simulation
For our first set of experiments we examine the performance of these measures on a simulated dataset. The data for these experiments were generated by first drawing and for 1000 samples. We then generated mock predictions, , by adding Gaussian random values to conditional on . Finally, in one experiment we offset conditional on . The exact data generating process for each experiment is given in Figure 1. We used logistic regression with random radial basis functions to construct non-linear classifiers , which were validated using cross validation with 10 folds. The results of the experiments are depicted in Figure 1, and the performance of the classifiers, and the values of the measures for each experiment are in Table 1.
These experiments demonstrate the intuitive interpretations we gave of the approximate measures in §(3) and §(4). For example, we can see from Figure 1(c) that that the joint classifier, is more discriminative than the marginal, , which is in turn more discriminative than . Hence, the original predictor that produced the score, , is most unfair with respect to the sufficiency criterion, then the separation criterion. In this instance is no better than random, and so satisfies the independence criterion.


if , and if .

| Balanced Accuracy | Ratio | Normalised MI | |||||||
|---|---|---|---|---|---|---|---|---|---|
| Experiment | , | ||||||||
| Fair (1(a)) | .50 | 0.50 | 0.50 | 1.033 | 1.021 | 1.019 | -.003 | -.006 | -.006 |
| Score mean (1(b)) | .50 | 0.65 | 0.99 | 4.489 | 9.706 | 6.912 | .271 | .890 | .847 |
| Target mean (1(c)) | .69 | 0.50 | 0.99 | 1.007 | 6.357 | 10.03 | -.015 | .841 | .898 |
| Score variance (1(d)) | .50 | 0.59 | 0.76 | 1.167 | 1.733 | 1.494 | .082 | .324 | .258 |
5.2 Real data
For validation purposes the behaviours of these measures were observed as a predictive model was tuned to reduce conditional dependencies between its predictions and a sensitive attribute. The Communities and Crime dataset from [9] was used to train a linear model which included the fairness regulariser proposed in [3] in its loss function.
The Communities and Crime dataset contains counts of all reported violent crimes for 1994 communities across the United States. Each community instance also contains 128 demographic features from the census such as population density, average income and percentage of population that is unemployed. For the purposes of this experiment, we have identified race as a sensitive attribute. Communities where more than 50% of the population identified as Black were labelled as protected.
The group fairness regulariser in [3] penalises models whose average predictions for a group, after conditioning on the true target, depend on a sensitive attribute. This is a specific case of the separation criterion.


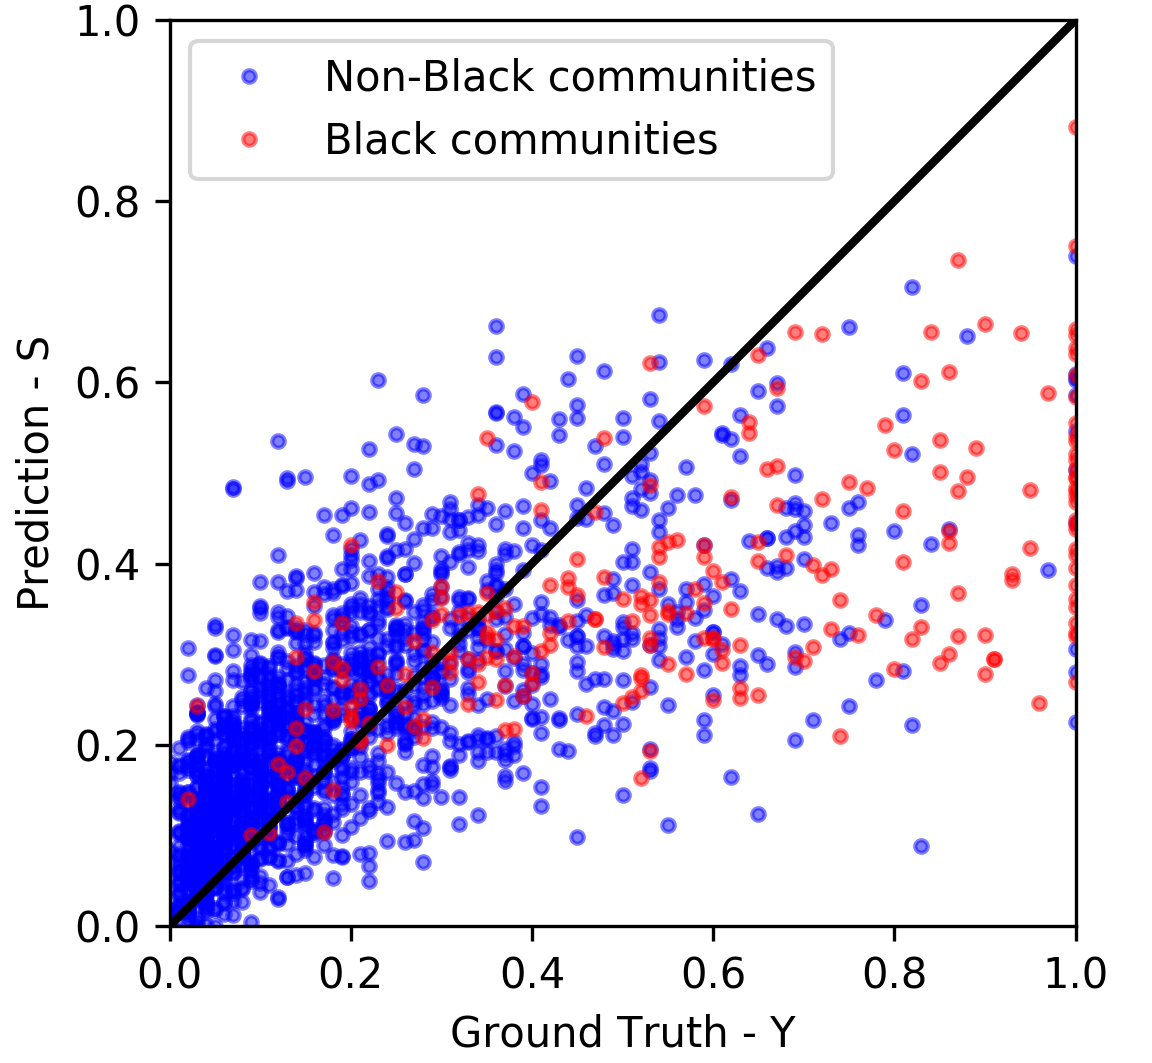
Figure 2(a) & 2(b) show the behaviour of each of the three fairness criteria for both the mutual information and density ratio estimation as the weight of the fairness regulariser is increased. For small regulariser weights, the loss function is dominated by its error term and consequently the model favours maximising accuracy (minimising RMSE). Due to the differences in recorded crime rates in Black and non-Black communities, it is unsurprising to see that there is a strong dependence between the model’s predictions and race (independence). Even conditioning on the target crime rates, we still observe a dependence between the predictions and race (separation). For instance, if we condition on the targets in Figure 2(c) (a vertical slice), we see that the model still erroneously predicts Black communities having a higher rate of violent crimes. It is perhaps unsurprising that the sufficiency criterion is almost satisfied in a model that maximises accuracy (low fairness regulariser weight). This is because a sufficiently unconstrained model should capture all information related to race in its predictions thus making race and the truth conditionally independent (sufficiency).
Increasing the weight of the Berk et al. 2017’s fairness regulariser penalises models that fail to meet the separation criteria. The RMSE increases due to this new constraint on the model space. As the expressiveness of the model decreases, the model can no longer fully capture information about racial base rates so conditioning on its predictions does not make race and the true targets independent. Thus, sufficiency is no longer satisfied — i.e. the distribution of errors for a given score, now depend on race (a horizontal slice in Figure 2(d)).
Increasing the weight of the fairness regularise also improves separation as indicated by its associated mutual information and density ratio estimation measures decreasing. Notably, however, appears to be satisfied for a lower value of the fairness regulariser than . Analysis of why this is the case indicates that the approximation of the as an empirical expectation, , can lead to models that are clearly unfair, but in equal amounts, to both groups can appear fair in expectation. By bringing all predictions closer to the mean value (Figure 2(d)), differences between groups conditioned on their true value are lessened. This also has the effect of reducing the unconditional dependence between race and predictions so the measures of independence also decreases.
6 Discussion and future work
The approximate density ratio and mutual information measures we derive in this paper are simple to implement, do not depend on the algorithm used to generate , and capture many properties of the conditional distributions used to define the group fairness criteria, such as in Figure 1(d). They do have limitations, as we have already noted. For instance, these approximations are sensitive to classifier performance. It is also hard to ascertain if poor classifier performance is because of a fair score, or because of poor model choice. However, we can resort to visual inspection as in Figure 1, unless we have high dimensional and . We also found the approximate mutual information measures were more numerically robust compared to the direct density ratio measures, and were also easier to interpret because of their normalisation.
Future directions for this work are to look at approximation methods able to handle continuous sensitive attributes, . MI approximation methods such as LSMI [20] or uLSIF [17] may be applicable to this task. We are also hoping that other density ratio estimation techniques will illuminate tractable ways of incorporating these group fairness criteria into regression objectives, or enable their use as post processing methods for general regression algorithms.
References
- Angwin et al. [2016] J. Angwin, J. Larson, S. Mattu, and L. Kirchner. Machine bias. ProPublica, May 2016. URL https://www.propublica.org/article/machine-bias-risk-assessments-in-criminal-sentencing.
- Barocas et al. [2019] S. Barocas, M. Hardt, and A. Narayanan. Fairness and Machine Learning. fairmlbook.org, 2019. http://www.fairmlbook.org.
- Berk et al. [2017] R. Berk, H. Heidari, S. Jabbari, M. Joseph, M. Kearns, J. Morgenstern, S. Neel, and A. Roth. A convex framework for fair regression. Proceedings of the Conference on Fairness, Accountability, and Transparency - FAT* ’17, 2017.
- Bickel et al. [2009] S. Bickel, M. Brückner, and T. Scheffer. Discriminative learning under covariate shift. Journal of Machine Learning Research, 10(Sep):2137–2155, 2009.
- Calders et al. [2013] T. Calders, A. Karim, F. Kamiran, W. Ali, and X. Zhang. Controlling Attribute Effect in Linear Regression. In 2013 IEEE 13th International Conference on Data Mining, pages 71–80, Dallas, TX, USA, Dec. 2013. IEEE. URL http://ieeexplore.ieee.org/document/6729491/.
- Cleary [1968] T. A. Cleary. Test bias: Prediction of grades of negro and white students in integrated colleges. Journal of Educational Measurement, 5(2):115–124, 1968.
- Cover and Thomas [2006] T. M. Cover and J. A. Thomas. Elements of information theory. John Wiley & Sons, 2nd edition, 2006.
- Darlington [1971] R. B. Darlington. Another look at “cultural fairness”. Journal of Educational Measurement, 8(2):71–82, 1971.
- Dua and Graff [2017] D. Dua and C. Graff. UCI machine learning repository, 2017. URL http://archive.ics.uci.edu/ml.
- Fitzsimons et al. [2019] J. Fitzsimons, A. A. Ali, M. Osborne, and S. Roberts. A General Framework for Fair Regression. Entropy, 21(8):741, Jul 2019. ISSN 1099-4300. URL http://arxiv.org/abs/1810.05041.
- Fukuchi et al. [2015] K. Fukuchi, T. Kamishima, and J. Sakuma. Prediction with model-based neutrality. IEICE TRANSACTIONS on Information and Systems, 98(8):1503–1516, 2015.
- Gel’fand and Yaglom [1957] I. M. Gel’fand and A. M. Yaglom. Calculation of amount of information about a random function contained in another such function. American Mathematical Society Translations, 12:199–246, 1957. English translation of original in Uspekhi Matematicheskikh Nauk 12 (1): 3-52.
- Ghassami et al. [2018] A. Ghassami, S. Khodadadian, and N. Kiyavash. Fairness in supervised learning: An information theoretic approach. In 2018 IEEE International Symposium on Information Theory (ISIT), pages 176–180. IEEE, 2018.
- Hastie et al. [2001] T. Hastie, R. Tibshirani, and J. Friedman. The elements of statistical learning, volume 1. Springer series in statistics New York, 2001.
- Hutchinson and Mitchell [2019] B. Hutchinson and M. Mitchell. 50 Years of Test (Un)fairness: Lessons for Machine Learning. Proceedings of the Conference on Fairness, Accountability, and Transparency - FAT* ’19, pages 49–58, 2019. URL http://arxiv.org/abs/1811.10104.
- Kamishima et al. [2012] T. Kamishima, S. Akaho, H. Asoh, and J. Sakuma. Fairness-Aware Classifier with Prejudice Remover Regularizer. In Machine Learning and Knowledge Discovery in Databases, volume 7524, pages 35–50. Springer Berlin Heidelberg, Berlin, Heidelberg, 2012. URL http://link.springer.com/10.1007/978-3-642-33486-3_3.
- Kanamori et al. [2009] T. Kanamori, S. Hido, and M. Sugiyama. A Least-squares Approach to Direct Importance Estimation. Journal of Machine Learning Research (JMLR), 10(Jul):1391–1445, 2009.
- McNamara et al. [2019] D. McNamara, C. S. Ong, and R. C. Williamson. Costs and Benefits of Fair Representation Learning. In Proceedings of the 2019 AAAI/ACM Conference on AI, Ethics, and Society - AIES ’19, pages 263–270, Honolulu, HI, USA, 2019. ACM Press. URL http://dl.acm.org/citation.cfm?doid=3306618.3317964.
- Qin [1998] J. Qin. Inferences for Case-Control and Semiparametric Two-Sample Density Ratio Models. Biometrika, 85(3):619–630, 1998. ISSN 00063444. URL http://www.jstor.org/stable/2337391.
- Sugiyama [2012] M. Sugiyama. Machine Learning with Squared-Loss Mutual Information. Entropy, 15(1):80–112, Dec. 2012. ISSN 1099-4300. URL http://www.mdpi.com/1099-4300/15/1/80.
- Sugiyama et al. [2010] M. Sugiyama, T. Suzuki, and T. Kanamori. Density Ratio Estimation: A Comprehensive Review. Technical report, Tokyo Institute of Technology, 2010.
- Sugiyama et al. [2012] M. Sugiyama, T. Suzuki, and T. Kanamori. Density ratio estimation in machine learning. Cambridge University Press, New York, 2012. ISBN 978-1-139-23325-5 978-1-139-03561-3.
- Williamson and Menon [2019] R. Williamson and A. Menon. Fairness risk measures. In International Conference on Machine Learning, pages 6786–6797, 2019. URL http://arxiv.org/abs/1901.08665.
- Zafar et al. [2015] M. B. Zafar, I. Valera, M. G. Rodriguez, and K. P. Gummadi. Fairness Constraints: Mechanisms for Fair Classification. arXiv:1507.05259 [cs, stat], July 2015. URL http://arxiv.org/abs/1507.05259.
- Zheng and Benjamini [2016] C. Y. Zheng and Y. Benjamini. Estimating mutual information in high dimensions via classification error. arXiv:1606.05229 [cs, math, stat], Oct. 2016. URL http://arxiv.org/abs/1606.05229.