Effect of proximity to ionic liquid-solvent demixing on electrical double layers
Abstract
There is a growing interest in the properties of ionic liquids (ILs) and IL-solvent mixtures at metallic interfaces, particularly due to their applications in energy storage. The main focus so far has been on electrical double layers with ILs far from phase transitions. However, the systems in the vicinity of their phase transformations are known to exhibit some remarkable features, such as wetting transitions and capillary condensation. Herein, we develop a mean-field model suitable for the IL-solvent mixtures close to demixing, and combine it with the Carnahan-Starling (CS) and lattice-gas expressions for the excluded volume interactions. This model is then solved analytically, using perturbation expansion, and numerically. We demonstrate that, besides the well-known camel and bell-shaped capacitances, there is a bird-shaped capacitance, having three peaks as a function of voltage, which emerge due to the proximity to demixing. In addition, we find that the camel-shaped capacitance, which is a signature of dilute electrolytes, can appear at high IL densities for ionophobic electrodes. We also discuss the differences and implications arising from the CS and lattice-gas expressions in the context of our model.
I Introduction
Ionic liquids (ILs) and IL–solvent mixtures have become the focus of research in electrochemistry due to their unique properties, such as exceptional electrochemical and thermal stability, and low vapour pressure. This makes them attractive materials for many applications Welton 1999; Fedorov and Kornyshev 2014, for instance, for electrochemical reactions, as lubricants for micro and nanodevices Perkin 2012, as extraction liquids for the purification of metals, colloids and biomass, etc Fedorov and Kornyshev 2014. The classical theory of electrolytes was developed in the early century, with the achievements of Gouy, Chapman, Debye, Hückel and Langmuir channeled into the so-called Poisson-Boltzmann (PB) model Ben-Yaakov et al. 2011. The PB model is a mean-field model which describes ions as isolated point-like charges in a solvent considered as a continuum dielectric Parsons 1990. Electrical double layers (EDLs) emerge when electrolytes are put in contact with charged surfaces. An EDL results from the formation of an ion ‘cloud’ of opposite sign to that of the surface charge, and its width is influenced by the competition between the thermal motion of the ions, which tends to homogenize their distribution, and the Coulomb interactions, which attract the counterions to the surface Parsons 1990. Within the linearized PB (Debye–Hückel approximation), the thickness of this layer is given by the Debye length , where is the ion density and the Bjerrum length. The application of the PB model to EDLs, known as the Gouy–Chapman model, predicts the well-known U-shaped dependence of the EDL capacitance on the applied potential.
However, the classical description of ELDs is only valid for dilute electrolytes (concentrations below M), but it is not suitable for ILs due to typically high concentrations of ions, at which the ion sizes start to play a role Bikerman 1942; Wicke and Eigen 1952; Freise 1952; Eigen and Wicke 1954. Indeed, theories developed for EDLs have shown that excluded volume interactions are crucial to describe the structure of the EDL with ILs properly Borukhov et al. 1997; di Caprio et al. 2003; Antypov et al. 2005; Oldham 2008; McEldrew et al. 2018; Bohinc et al. 2001; Kornyshev 2007; Kilic et al. 2007; Frydel and Levin 2012; Minton and Lue 2016; Girotto et al. 2018. Steric interactions restrict the absorption of counterions at an electrode, and hence influence the charge density in the EDL. This leads to the emergence of the so-called camel and bell-shape capacitances, obtained at low and high IL concentrations, respectively Kornyshev 2007, instead of the classical Gouy-Chapman’s U-shape.
Temperature also plays an important role in the structure and capacitance of EDLs. However, contradictory results have been reported in the literature and consensus is yet to be reached as to whether capacitance increases or decreases with temperature and under which conditions. According to the Gouy-Chapman theory, the capacitance decreases for increasing temperature, but the experiments showed also the opposite trends Lockett et al. 2008a; Silva et al. 2008; Drüschler et al. 2012; Ivaništšev et al. 2017. For instance, Silva et al. 2008 Silva et al. 2008 studied the [BMIM][PF6] ionic liquid and three different electrodes and found that the differential capacitance increases with temperature at all potentials. Lockett et al. 2008a Lockett et al. 2008a found the same behaviour for imidazolium-based ionic liquids in contact with glassy carbon electrodes. More careful theoretical work suggested that both trends are possible Holovko et al. 2001; Reszko-Zygmunt et al. 2005; Chen et al. 2018, but there is no general agreement on the origin of this behaviour. For instance, Holovko et al. 2001 Holovko et al. 2001 proposed that the increase of capacitance is related to the decreased inter-ionic interactions and weaker ion associations, while Chen et al. 2018 Chen et al. 2018 argued that the temperature dependence of EDLs is chiefly determined by the strength and extent of the van der Waals interactions. Interestingly, it was shown that the transition between the camel and bell-like capacitances can be induced also by varying temperature Vatamanu et al. 2011; Chen et al. 2018, with the bell shape emerging at high temperatures due to breaking of ‘ion pairs’ and consequently stronger screening Chen et al. 2018.
The focus of the above-mentioned studies was on room–temperature ILs and IL–solvent mixtures far from phase transitions. However, it is well–known that, for neutral fluids, the fluid structure at a surface undergoes drastic changes (such as wetting or prewet-ting transitions, layering, etc), when the system approaches a phase transition Bonn et al. 2009. In a recent work Cruz et al. 2019, we have proposed a model suitable for IL–solvent mixtures close to demixing. Treating solvent as a continuum (appropriate for small solvent molecules, such as water or acetonitrile), but describing ILs as amenable to phase separate into the ion-rich and ion-dilute phases, we showed that the capacitance and stored energy become sensitive functions of temperature in the vicinity of demixing. We also demonstrated the emergence of a new, bird-shaped capacitance, having three peaks as a function of voltage. Herein, we present a more detailed investigation of this system, while we also extend our study to systems, in which solvent and ions are of comparable size. We first describe the details and the derivation of the model (Sec. II), and discuss its phase behaviour in bulk (Sec. III). Then, we derive analytic expressions for the density, potential and charge profiles, as well as for the capacitance, by applying the perturbation expansion (Sec. IV). The results of numerical calculations are discussed in Sec. V. We summarize in Sec. VI.
II Model
We consider a mixture of ionic liquid (IL) and neutral solvent, which can phase separate below its upper critical point Elshwishin et al. 2014. Our interest is in the one-phase region just above demixing. We assume that the mixture is in contact with a planar metallic electrode, and the electrostatic potential, , is kept constant with respect to the bulk. This system can be described by the following grand thermodynamic potential
| (1) |
where , and are the electrostatic energy, the energy associated with van der Waals-like dispersion (non-Coulombic) interactions and the entropy (all per surface area), respectively; is temperature, is the surface area of the electrode, is the chemical potential, and is the local density of different components, where denotes cations, anions and solvent, respectively. The electrostatic energy is given by Borukhov et al. 1997; Kralj-Iglič and Iglič 1996
| (2) |
where , is the electrostatic potential in units with denoting the Boltzmann constant; is the charge density per elementary charge and is the Bjerrum length, where is the dielectric constant. It is well known that depends on temperature, particularly for polar solvents Gagliardi et al. 2007; Riniker et al. 2012; Orhan 2014. Nevertheless, we assume to be temperature-independent, and note that its temperature variation should not affect the results qualitatively, as pointed out in Cruz et al. 2019. In addition, it is known that polarizability of solvent and of ions may play an important role in the structure and properties of electrical double layers Gongadze and Iglič 2012; Fedorov and Kornyshev 2008a; Fedorov et al. 2010; Girotto et al. 2017; Pousaneh et al. 2012; Pousaneh et al. 2014. In particular, Gongadze and Iglič 2012 Gongadze and Iglič 2012 demonstrated a potentially strong variation of the dielectric constant close to a planar charged surface. These authors derived a formula for a position-dependent , by taking into account excluded volume effects and solvent polarization. In general, such variation of shall also depend on the affinity of ions/solvent towards electrode (electrode’s ionophilicity, see below), as well as on the applied potential. To avoid such complications, and to capture generic effects, unobscured by the chemical complexity, we have decided to take a position-independent dielectric constant, as in the majority of studies Borukhov et al. 1997; di Caprio et al. 2003; Kornyshev 2007; Fedorov and Kornyshev 2008b; Oldham 2008; Fedorov et al. 2010; Girotto et al. 2017; Girotto et al. 2018; Chen et al. 2018; McEldrew et al. 2018; clearly, the change of close to the surface will affect the results quantitatively, but it is reasonable to expect that the qualitative behaviour will not be altered.
The term describes the contribution from attractive non-Coulombic van der Waals-like interactions to the internal energy, which may lead to demixing of the IL and solvent. The explicit expression for is difficult to obtain due to the complexity of the interactions between the ions and solvent. However, when the phase separation is driven by the chemical difference between IL and neutral solvent, we can take into account only the effective interactions leading to phase separation. In this case, for the bulk system one can write
| (3) |
where is the difference between the chemical potentials of an IL and solvent, represents the effective interactions leading to phase separation, is the pair distribution function, , and is the number density of the IL at position . We have used the approach of Ref. Pousaneh et al. 2012; Pousaneh et al. 2014 to transform Eq. (3) to
| (4) |
where
| (5) |
measures the strength of the dispersion interactions, and
| (6) |
describes the spatial extension of these interactions ( is of the same order of magnitude as the molecular size ). In Eq. (4), we took into account that the interactions with the missing fluid neighbours beyond the system boundary should be subtracted (the first boundary term), and we included the direct short-range interactions of the fluid particles with the wall (the second boundary term). The electrode’s ionophilicity is denoted by and describes the preference of the electrode for ions or solvent; means that the wall favours ions, and we assumed this preference to be the same for anions and cations.
Within the local density approximation, the entropy is
| (7) |
The first two terms in Eq. (7) come from the entropy of mixing of ions, and the last term is the excess free energy associated with the excluded volume interactions. If the cations and anions are of comparable size, but the solvent molecules are much smaller, such that the solvent can be treated as a structureless continuum, it seems reasonable to use the Carnahan - Starling (CS) approximation Carnahan and Starling 1969 for the excluded volume interactions between the ions only, i.e.,
| (8) |
where is the packing fraction of ions. However, if both ions and solvent are of comparable size, it might be more suitable to use the popular lattice-gas expression
| (9) |
which arises from the solvent’s ideal-gas entropy, , by assuming the local incompressibility conditions, ( for the lattice–gas model). Eq. (9) has been employed in a number of important studies, most notably by Bikerman 1942 Bikerman 1942, Wicke and Eigen 1952 Wicke and Eigen 1952; Eigen and Wicke 1954, Borukhov et al. 1997 Borukhov et al. 1997, Kilic et al. 2007 Kilic et al. 2007 and Kornyshev 2007 Kornyshev 2007.
In Eqs. (8) and (9), the cations and anions are assumed to be of the same size, i.e., , whereas often Gongadze and Iglič 2015; Sin et al. 2015; Gongadze et al. 2018. Gongadze and Iglič 2015 Gongadze and Iglič 2015 proposed an improved mean-field model of EDLs that accounts for such ion-size asymmetry, and found that it leads to a pronounced decrease of the capacitance and to shape asymmetry of the capacitance-voltage curves (with respect to the potential of zero charge), which seems to be consistent with the experimental observations Lockett et al. 2008b; Lockett et al. 2010. These results suggest that the asymmetry in ion sizes may reduce the capacitance calculated in this work, and will additionally bring asymmetry in the capacitance-voltage dependence, but the qualitative behaviour due to proximity to demixing shall be captured already by a model featuring the same sizes of cations and anions.
Summing up, our final expression of the grand potential is Cruz et al. 2019
| (10) |
The equilibrium properties of the system are described by the minimum of . Minimization with respect to and yields
| (11) |
where is the Debye screening length in bulk electrolyte and is the equilibrium ion density (in bulk) and . The boundary conditions are, naturally, and , where is the potential applied at an electrode with respect to bulk. Minimization with respect to gives
| (12) |
where with , , and is dimensionless temperature. The boundary conditions are and , where . From the solution of Eq. (11)-(12), the total charge, , stored in an EDL is
| (13) |
An important quantity, which can be assessed experimentally, is the differential capacitance:
| (14) |
III Bulk phase diagram

In the absence of electrode, the thermodynamic potential is given by
| (15) |
The equilibrium condition, , leads to a non-linear equation, which we solved numerically. Our analysis indicates that, in some parameter region, there are two solutions, corresponding to the IL-rich () and IL-poor () phases. The first order phase transition between these phases occurs when . This is shown in Fig. 1 by solid lines for the CS and lattice-gas models.
At the spinodal line, , the homogeneous IL-solvent mixture becomes unstable with respect to density fluctuations (this corresponds to the diverging correlation length, c.f. Eq. (20)). Within our mean-field theory, the spinodal line is given by
| (16) |
where
| (17) |
The spinodals are shown by dashed lines in Fig. 1. The point on the spinodal that satisfies corresponds to a critical point (solid circles in the same figure). For the CS and lattice-gas expressions, we found for the critical points , and , , respectively.
We note that the obtained phase diagrams (Fig. 1) are in good qualitative agreement with the experimental data (see, e.g., Refs. Butka et al. 2008; Crosthwaite et al. 2004; Rotrekl et al. 2017).
IV Approximate analytical solution
To study the behaviour of IL-solvent mixtures at metallic surfaces within our model, one needs to solve Eqs. (11) - (12), which we have done numerically. However, before describing the results of those calculations, it is useful to discuss approximate analytical solutions, which can be obtained for weak surface potentials, , and ionophilicities, . To this end, we used the standard perturbation analysis, i.e., we assumed and , where is a small parameter. In the first order approximation, we obtained the following equations
| (18) |
and
| (19) |
where
| (20) |
is the correlation length and is given by Eq. (16). The solutions to Eqs. (18) and (19) are
| (21) |
and
| (22) |
Thus, as one may expect, in the first order approximation, the fields and are fully decoupled, that is, the behaviour of is determined solely by the Debye screening length, , as in the classical Debye-Hückel theory, while the decay of is governed by the correlation length, .

In the second order perturbation, we obtained
| (23) |
and
| (24) |
where
| (25) |
Note that , where is the critical density. Thus, in the second order, the and fields become coupled, and it is this coupling that determines the highly non-linear behaviour of the system as it approaches demixing. The solutions to Eqs. (24) and (23) are lengthy and are not presented here.
Fig. 2 compares the second–order analytical and numerical solutions to Eqs. (11) and (12) for the Carnahan-Starling and lattice-gas entropies. For the order parameter, , analytic and numerical solutions differ significantly for increasing the applied potential. Interestingly, however, for the charge density the perturbation expansion provides a relatively good approximation and the solutions agree even for higher potentials.
IV.1 Differential capacitance
Differential capacitance can be computed by plugging the electrostatic potential, , obtained by the perturbation expansion, into Eq. (13) and (14); the result is
| (26) |
where
| (27) |
and
| (28) |
where is the Debye capacitance and the Helmholtz capacitance.
The sign of describes the shape of the capacitance at low potentials. A positive corresponds to the so-called camel shape, exhibiting a minimum at , while a negative means a maximum at and is often associated with the bell-shaped capacitance Kornyshev 2007. Such capacitance shapes have been extensively studied in the literature Kornyshev 2007; Lockett et al. 2008a; Chen et al. 2018; Vatamanu et al. 2011; Fedorov and Kornyshev 2008b; Alam et al. 2008a; Fedorov and Kornyshev 2008a; Fedorov et al. 2010; Girotto et al. 2017; Girotto et al. 2018.

In the absence of dispersion interactions ( in Eq. (10)), Eqs. (27) and (28) reduce to and
| (29) |
respectively. For , therefore, the sign of , and thus the capacitance shape, depend only on the IL density.
For the lattice–gas model, combining Eq. (9) and Eq. (29) gives
| (30) |
which changes sign at , implying a transformation between the bell and camel shapes at , as first pointed out by Kornyshev Kornyshev 2007. For the CS free energy, Eq. (8), we obtained (for )
| (31) |
We have solved the equation numerically and obtained for the transition between the camel and bell shapes . Note that this value is significantly lower than predicted by the lattice-gas model. This is similar to the critical density, which is also higher for the lattice-gas model (Fig. 1).
Considering dispersion interactions (), Eq. (28) becomes more complex and we solved it numerically using bvp4c routine in MATLAB software. Figs. 3 show the resulting diagrams, which separate the regions of positive and negative curvatures in the low voltage capacitance. The examples of the capacitance shapes are presented in Figs. 3. This figure also demonstrates that our approximate solutions are valid only in the vicinity of , and hence the full numerical solution is needed to describe properly the capacitance behaviour.
V Numerical results
We have solved Eqs. (11) and (12) numerically to analyze the capacitive properties of our system in a wide range of voltages, temperatures and densities. In order to calculate the differential capacitance, we first computed the accumulated charge according to Eq. (13), and then differentiated it numerically with respect to the electrostatic potential (Eq. (14)).
V.1 Differential capacitance
Carnahan-Starling


Lattice-gas


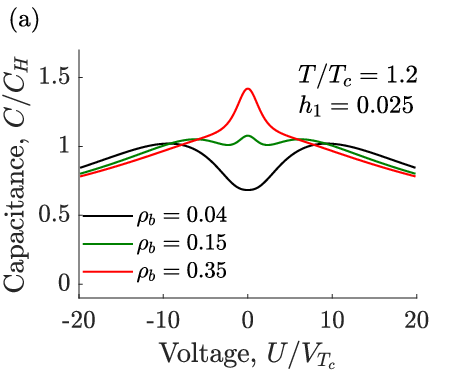
Fig. 4 shows that, for the CS model, there are three capacitance shapes Cruz et al. 2019: camel (), and bird and bell shapes (, compare Fig. 3). The lattice-gas model also predicts the emergence of all three capacitance shapes (Fig. 4). This is interesting since recently Chen et al. 2018 Chen et al. 2018 extended the steric-only lattice-gas model (i.e, in Eq. (10)) to account for the temperature dependence and studied the capacitance in a wide range of temperature, but they did not observe the bird-like capacitance.
Figs. 4 present the capacitance diagrams for the temperatures above the critical temperature (i.e., IL–solvent is always in the mixed state). It shows the regions of the camel, bird and bell-shaped capacitances for the CS and lattice-gas models. Both models exhibit the diagrams of similar topology. For the lattice-gas model, however, the transformations between the various capacitance shapes are shifted to higher densities. This is consistent with the result (Fig. 3), and is in similarity to the bulk phase diagram, in which the demixing region is also shifted to higher densities (Fig. 1).
Figs. 4 show the capacitance diagrams for the temperature below . Interestingly, the CS model predicts the camel shape even for high densities, but only provided the electrode is strongly ionophobic. This is likely because, close to demixing, an ionophobic electrode can induce a (macroscopically) thick layer of an ion-poor (or solvent-rich) phase, so that the system in the vicinity of the electrode behaves as being effectively dilute; note that for higher temperatures (far from demixing), only the bell shape is observed for dense ILs (Fig. 4). It is also interesting to note that the bell and camel shapes are separated by a narrow domain of bird-like capacitance. For the lattice-gas model, however, there is no camel shape at high densities, where only the birds and bells are observed. It must be noted that our theory is inaccurate at high densities, where steric repulsions start to play the dominant role. In view of the above results, it will be interesting to study this region by more robust theories or by simulations.
V.2 Energy storage

From the capacitance, we have calculated the energy density stored in an EDL as a function of the applied potential
| (32) |
The stored energy, together with the examples of the capacitance and charging parameter, are shown in Fig. 5. The charging parameter is Forse et al. 2016; Breitsprecher et al. 2017
| (33) |
where is the surface coverage by ionic liquid.
Fig. 5 shows the energy obtained for two temperatures for the CS entropy. In the entire range of voltages studied, the energy is higher for the lower temperature (closer to demixing). As suggested in Cruz et al. 2019, this temperature dependence of the stored energy can be used to generate electricity from waste heat Janssen et al. 2014; Härtel et al. 2015; Wang et al. 2015; Janssen and van Roij 2017; Janssen et al. 2017; Janssen and van Roij 2017. The increase of energy with decrease of temperature can be related to the capacitance behaviour. Close to demixing, capacitance increases due to the voltage-induced increase of ion density at the surface, so that the bell-shaped capacitance acquires wings and becomes bird-shaped (Fig. 5). This is manifested in the behaviour of the charging parameter, which becomes greater than unity for the temperature close to demixing (Fig. 5); thus, both cations and anions are adsorbed into the surface layer, leading to a strong peak in the charging parameter and capacitance. For higher voltages, however, the charging parameter decreases to and the capacitance also decreases in this range of voltages.
For the lattice-gas entropy, the temperature dependence of the stored energy is weaker, as compared to the CS model (Fig. 5). Moreover, the two curves cross each other at higher voltages, and the stored energy becomes higher for higher temperatures. Qualitatively, however, the differential capacitance (Fig. 5) and the charging parameter (Fig. 5) exhibit similar behaviours as for the CS model.
VI Summary
We have studied electrical double layers with ionic liquid–solvent mixtures close to demixing (Fig. 1). We proposed a model, Eq. (10), appropriate for this system, and considered the Carnahan-Starling (CS) and lattice-gas expressions for the excess free energy associated with the excluded volume interactions. This model was treated both analytically and numerically, and the results can be summarized as follows.
- 1.
Analytic expressions were obtained by using perturbation expansion, which provide good agreement with the numerical results for the charge density at low potentials (Fig. 2).
We also determined the capacitance shapes (at low potentials) and calculated analytically the capacitance diagrams, showing the regions of positive (camel-shaped) and negative curvatures. The transformation between these shapes can be induced by changing the ion density and temperature (Fig. 3).
- 2.
Our numerical calculations revealed the emergence of a bird-shaped capacitance, having three peaks as a function of voltage. We also calculated the capacitance diagrams, this time showing the regions with the camel, bird and bell shapes, obtained by changing the electrode’s ionophilicity and bulk ion density at different fixed temperatures (Fig. 4).
- 3.
Interestingly, for the Carnahan-Starling free energy (here applicable for small solvent molecules), the camel-shaped capacitance, which is a signature of dilute electrolytes, can appear at high densities in the case of ionophobic electrodes; the model with the lattice-gas entropy does not exhibit the camel-like capacitance in the high density regime, however.
- 4.
We calculated the energy stored in an EDL at different temperatures (Fig. 5a,d). For the CS entropy, the energy increases when approaching demixing, which can be used to generated electricity from heat Cruz et al. 2019; Janssen et al. 2014; Härtel et al. 2015; Wang et al. 2015; Janssen and van Roij 2017; Janssen et al. 2017. For the lattice-gas model, however, there seems to be no energy enhancement when approaching demixing. This suggests that the type of solvent (particularly the size of solvent molecules) can play an important role in the energy storage. It will be interesting to study such solvent-dependent effects in more details in future work.
- 5.
We also found that a transformation between the bell and bird shapes can be caused by varying temperature (Fig. 5b,e). This is due to a voltage-induced adsorption of an IL at an electrode, as manifested by the charging parameter , which shows a strong peak at a non-zero voltage. Such an enhanced electrosorption leads to stronger screening and hence to the appearance of wings in the bell-shaped capacitance.
We presented here a simple model, and to keep it simple, we had to make a number of simplifying assumptions, in order to be able to develop some analytical insights. In particular, we assumed the cations and anions to be of the same size; we took the dielectric constant temperature and position-independent; and, most importantly, we treated the hard-core interactions on the level of the local-density approximation. While it is clear that more realistic models, or simulations, will alter the results of our calculations quantitatively, it is reasonable to expect that the qualitative behaviour is captured by our model (particularly points 2 and 5 above). Thus, our model provides the basis for further studies of electrical double layers in the vicinity of ionic liquid–solvent demixing. It will be interesting to validate our predictions by more rigorous theories, simulations and experiments, especially those obtained at high ion concentrations (e.g. point 3 above), at which the local density approximation is known to be inaccurate Antypov et al. 2005.
Finally, we note that Alam et al. 2008b Alam et al. 2008b have observed experimentally the appearance of humps at the potential of zero charge in the U-shaped capacitance for N2-saturated room-temperature ILs on some electrodes; the emergence of wings in the bell-shaped capacitance was reported in a simulation study by Sha et al. 2014 Sha et al. 2014 for neat BMIM-PF6 on a gold surface. Our analysis suggests that these behaviours can be related to the wetting properties of ionic liquids. It will be useful to study such relations more systematically, in order to link explicitly the wetting and electrochemical characteristics of ionic liquid-electrode systems.
Acknowledgements.
This work was supported by the European Unions Horizon 2020 research and innovation programmes under the Marie Skłodowska-Curie grant agreement No. 711859 to C.C and No. 734276 to A.C. and S.K. Additional funding was received from the Ministry of Science and Higher Education of Poland for the project No. 734276 in the years 2017-2018 (agreement No. 3854/H2020/17/2018/2) and for the implementation of the international co-financed project No. 711859 in the years 2017-2021. We are grateful to Yan Levin for critical reading of the manuscript and insightful comments.References
- Welton (1999) Thomas Welton, “Room-Temperature Ionic Liquids. Solvents for Synthesis and Catalysis,” Chemical Reviews 99, 2071–2084 (1999).
- Fedorov and Kornyshev (2014) Maxim V Fedorov and Alexei A Kornyshev, “Ionic Liquids at Electrified Interfaces,” Chemical Reviews 114, 2978–3036 (2014).
- Perkin (2012) Susan Perkin, “Ionic liquids in confined geometries,” Phys. Chem. Chem. Phys. 14, 5052–5062 (2012).
- Ben-Yaakov et al. (2011) Dan Ben-Yaakov, David Andelman, Rudi Podgornik, and Daniel Harries, “Ion-specific hydration effects: Extending the Poisson-Boltzmann theory,” Current Opinion in Colloid & Interface Science 16, 542–550 (2011).
- Parsons (1990) Roger Parsons, “The electrical double layer: recent experimental and theoretical developments,” Chemical Reviews 90, 813–826 (1990).
- Bikerman (1942) J.J. Bikerman, “XXXIX. Structure and capacity of electrical double layer,” The London, Edinburgh, and Dublin Philosophical Magazine and Journal of Science 33, 384–397 (1942).
- Wicke and Eigen (1952) E Wicke and M Eigen, “Über den einfluß des raumbedarfs von ionen in wäßriger lösung auf ihre verteilung in elektrischen feld und ihre aktivitätskoeffizienten,” Zeitschrift für Elektrochemie, Berichte der Bunsengesellschaft für physikalische Chemie 56, 551–561 (1952).
- Freise (1952) V. Freise, “Zur Theorie der diffusen Doppelschicht,” Zeitschrift für Elektrochemie 56, 822–827 (1952).
- Eigen and Wicke (1954) M. Eigen and E. Wicke, “The thermodynamics of electrolytes at higher concentration,” J. Phys. Chem. 58, 702–714 (1954).
- Borukhov et al. (1997) Itamar Borukhov, David Andelman, and Henri Orland, “Steric Effects in Electrolytes: A Modified Poisson-Boltzmann Equation,” Phys. Rev. Lett. 79, 435–438 (1997).
- di Caprio et al. (2003) D. di Caprio, Z. Borkowska, and J. Stafiej, “Simple extension of the Gouy–Chapman theory including hard sphere effects.” Journal of Electroanalytical Chemistry 540, 17–23 (2003).
- Antypov et al. (2005) D. Antypov, M. C. Barbosa, and C. Holm, “A simple non-local approach to treat size correlations within Poisson-Boltzmann theory,” Phys. Rev. E 71, 061106 (2005).
- Oldham (2008) Keith B. Oldham, “A Gouy-Chapman-Stern model of the double layer at a (metal)/(ionic liquid) interface,” Journal of Electroanalytical Chemistry 613, 131–138 (2008).
- McEldrew et al. (2018) Michael McEldrew, Zachary A.H. Goodwin, Alexei A. Kornyshev, and Martin Z. Bazant, “Theory of the Double Layer in Water-in-Salt Electrolytes,” Journal of Physical Chemistry Letters 9, 5840–5846 (2018).
- Bohinc et al. (2001) Klemen Bohinc, Veronika Kralj-Iglič, and Aleš Iglič, “Thickness of electrical double layer. Effect of ion size,” Electrochimica Acta 46, 3033–3040 (2001).
- Kornyshev (2007) Alexei A Kornyshev, “Double-Layer in Ionic Liquids: Paradigm Change?” The Journal of Physical Chemistry B 111, 5545–5557 (2007).
- Kilic et al. (2007) Mustafa Sabri Kilic, Martin Z. Bazant, and Armand Ajdari, “Steric effects in the dynamics of electrolytes at large applied voltages. i. double-layer charging,” Phys. Rev. E 75, 021502 (2007).
- Frydel and Levin (2012) Derek Frydel and Yan Levin, “A close look into the excluded volume effects within a double layer,” J. Chem. Phys. 137, 164703 (2012).
- Minton and Lue (2016) Geraint Minton and Leo Lue, “The influence of excluded volume and excess ion polarisability on the capacitance of the electric double layer,” Molecular Physics 114, 2477–2491 (2016).
- Girotto et al. (2018) Matheus Girotto, Rodrigo M. Malossi, Alexandre P. dos Santos, and Yan Levin, “Lattice model of ionic liquid confined by metal electrodes,” J. Chem. Phys. 148, 193829 (2018).
- Lockett et al. (2008a) Vera Lockett, Rossen Sedev, John Ralston, Mike Horne, and Theo Rodopoulos, “Differential Capacitance of the Electrical Double Layer in Imidazolium-Based Ionic Liquids: Influence of Potential, Cation Size, and Temperature,” The Journal of Physical Chemistry C 112, 7486–7495 (2008a).
- Silva et al. (2008) Fernando Silva, Cristiana Gomes, Marta Figueiredo, Renata Costa, Ana Martins, and Carlos M. Pereira, “The electrical double layer at the [BMIM][PF6] ionic liquid/electrode interface - Effect of temperature on the differential capacitance,” Journal of Electroanalytical Chemistry 622, 153–160 (2008).
- Drüschler et al. (2012) Marcel Drüschler, Natalia Borisenko, Jens Wallauer, Christian Winter, Benedikt Huber, Frank Endres, and Bernhard Roling, “New insights into the interface between a single-crystalline metal electrode and an extremely pure ionic liquid: slow interfacial processes and the influence of temperature on interfacial dynamics,” Physical Chemistry Chemical Physics 14, 5090–5099 (2012).
- Ivaništšev et al. (2017) Vladislav B Ivaništšev, Kathleen Kirchner, and Maxim V. Fedorov, “Double layer in ionic liquids: capacitance vs temperature,” (2017).
- Holovko et al. (2001) Myroslav Holovko, Vitalyj Kapko, Douglas Henderson, and Dezsö Boda, “On the Influence of Ionic Association on the Capacitance of an Electrical Double Layer,” Chem. Phys. Lett. 341, 363–368 (2001).
- Reszko-Zygmunt et al. (2005) J. Reszko-Zygmunt, S. Sokołowski, D. Henderson, and D. Boda, “Temperature dependence of the double layer capacitance for the restricted primitive model of an electrolyte solution from a density functional approach,” Journal of Chemical Physics 122, 084504 (2005).
- Chen et al. (2018) Ming Chen, Zachary A H Goodwin, Guang Feng, and Alexei A Kornyshev, “On the Temperature Dependence of the Double Layer Capacitance of Ionic Liquids,” J. Electroanal. Chem. 819, 347–358 (2018).
- Vatamanu et al. (2011) Jenel Vatamanu, Oleg Borodin, and Grant D Smith, “Molecular Simulations of the Electric Double Layer Structure, Differential Capacitance, and Charging Kinetics for N-Methyl-N-propylpyrrolidinium Bis(fluorosulfonyl)imide at Graphite Electrodes,” The Journal of Physical Chemistry B 115, 3073–3084 (2011).
- Bonn et al. (2009) Daniel Bonn, Jens Eggers, Joseph Indekeu, Jacques Meunier, and Etienne Rolley, “Wetting and spreading,” Rev. Mod. Phys. 81, 739–805 (2009).
- Cruz et al. (2019) Carolina Cruz, Alina Ciach, Enrique Lomba, and Svyatoslav Kondrat, “Electrical Double Layers Close to Ionic Liquid-Solvent Demixing,” Journal of Physical Chemistry C 123, 1596–1601 (2019).
- Elshwishin et al. (2014) A. Elshwishin, J. Köser, W. Schröer, and Baofu Qiao, “Liquid-liquid phase separation of ionic liquids in solutions: Ionic liquids with the triflat anion solved in aryl halides,” Journal of Molecular Liquids 192, 127–136 (2014).
- Kralj-Iglič and Iglič (1996) Veronika Kralj-Iglič and Aleš Iglič, “A Simple Statistical Mechanical Approach to the free Energy of the Electric Double Layer Including the Excluded Volume Effect,” J. Phys. II 6, 477–491 (1996).
- Gagliardi et al. (2007) Leonardo G. Gagliardi, Cecilia B. Castells, Clara Ràfols, Martí Rosés, and Elisabeth Bosch, “Static Dielectric Constants of Acetonitrile/Water Mixtures at Different Temperatures and Debye−Hückel A and a 0 B Parameters for Activity Coefficients,” J. Chem. Eng. Data 52, 1103–1107 (2007).
- Riniker et al. (2012) Sereina Riniker, Bruno A. C. Horta, Bram Thijssen, Saumya Gupta, Wilfred F. van Gunsteren, and Philippe H. Hünenberger, “Temperature Dependence of the Dielectric Permittivity of Acetic Acid, Propionic Acid and Their Methyl Esters: A Molecular Dynamics Simulation Study,” ChemPhysChem 13, 1182–1190 (2012).
- Orhan (2014) Mehmet Orhan, “Dielectric and Transport Properties of Acetonitrile at Varying Temperatures: a Molecular Dynamics Study,” Bull. Korean Chem. Soc. 35, 1469–1478 (2014).
- Gongadze and Iglič (2012) Ekaterina Gongadze and Aleš Iglič, “Decrease of permittivity of an electrolyte solution near a charged surface due to saturation and excluded volume effects,” Bioelectrochemistry 87, 199–203 (2012).
- Fedorov and Kornyshev (2008a) M. Fedorov and Alexei A. Kornyshev, “Towards understanding the structure and capacitance of electrical double layer in ionic liquids,” Electrochimica Acta 53, 6835–6840 (2008a).
- Fedorov et al. (2010) M. V. Fedorov, N. Georgi, and A. A. Kornyshev, “Double layer in ionic liquids: The nature of the camel shape of capacitance,” Electrochemistry Communications 12, 296–299 (2010).
- Girotto et al. (2017) Matheus Girotto, Alexandre P. dos Santos, and Yan Levin, “Simulations of ionic liquids confined by metal electrodes using periodic Green functions,” J. Chem. Phys. 147, 074109 (2017).
- Pousaneh et al. (2012) Faezeh Pousaneh, Alina Ciach, and Anna Maciołek, “Effect of ions on confined near-critical binary aqueous mixture,” Soft Matter 8, 7567–7581 (2012).
- Pousaneh et al. (2014) Faezeh Pousaneh, Alina Ciach, and Anna Maciołek, “How ions in solution can change the sign of the critical Casimir potential,” Soft Matter 10, 470–483 (2014).
- Fedorov and Kornyshev (2008b) M. V. Fedorov and A. A. Kornyshev, “Ionic Liquid Near a Charged Wall: Structure and Capacitance of Electrical Double Layer,” The Journal of Physical Chemistry B 112, 11868–11872 (2008b).
- Carnahan and Starling (1969) Norman F. Carnahan and Kenneth E. Starling, “Equation of State for Nonattracting Rigid Spheres,” The Journal of Chemical Physics 51, 635–636 (1969).
- Gongadze and Iglič (2015) Ekaterina Gongadze and Aleš Iglič, “Asymmetric size of ions and orientational ordering of water dipoles in electric double layer model - an analytical mean-field approach,” Electrochim. Acta 178, 541–545 (2015).
- Sin et al. (2015) Jun Sik Sin, Song Jin Im, and Kwang Il Kim, “Asymmetric electrostatic properties of an electric double layer: A generalized Poisson-Boltzmann approach taking into account non-uniform size effects and water polarization,” Electrochim. Acta 153, 531–539 (2015).
- Gongadze et al. (2018) Ekaterina Gongadze, Luka Mesarec, Veronika Kralj-Iglic, and Ales Iglic, “Asymmetric Finite Size of Ions and Orientational Ordering of Water in Electric Double Layer Theory Within Lattice Model,” Mini-Reviews Med. Chem. 18, 1559–1566 (2018).
- Lockett et al. (2008b) Vera Lockett, Rossen Sedev, John Ralston, Mike Horne, and Theo Rodopoulos, “Differential Capacitance of the Electrical Double Layer in Imidazolium-Based Ionic Liquids: Influence of Potential, Cation Size, and Temperature,” J. Phys. Chem. C 112, 7486–7495 (2008b).
- Lockett et al. (2010) Vera Lockett, Mike Horne, Rossen Sedev, Theo Rodopoulos, and John Ralston, “Differential capacitance of the double layer at the electrode/ionic liquids interface,” Phys. Chem. Chem. Phys. 12, 12499 (2010).
- Butka et al. (2008) Annamaria Butka, Vlad Romeo Vale, Dragos Saracsan, Cornelia Rybarsch, Volker C. Weiss, and Wolffram Schröer, “Liquid-liquid phase transition in solutions of ionic liquids with halide anions: Criticality and corresponding states,” Pure Appl. Chem. 80, 1613–1630 (2008).
- Crosthwaite et al. (2004) Jacob M. Crosthwaite, Sudhir N. V. K. Aki, Edward J. Maginn, and Joan F. Brennecke, “Liquid phase behavior of imidazolium-based ionic liquids with alcohols,” J. Phys. Chem. B 108, 5113–5119 (2004).
- Rotrekl et al. (2017) Jan Rotrekl, Jan Storch, Petr Velíšek, Wolffram Schröer, Johan Jacquemin, Zdeněk Wagner, Pascale Husson, and Magdalena Bendová, “Liquid phase behavior in systems of 1-butyl-3-alkylimidazolium bis(trifluoromethyl)sulfonylimide ionic liquids with water: Influence of the structure of the c5 alkyl substituent,” J. Solution Chem. 46, 1456–1474 (2017).
- Alam et al. (2008a) Muhammad Tanzirul Alam, Md. Mominul Islam, Takeyoshi Okajima, and Takeo Ohsaka, “Capacitance Measurements in a Series of Room-Temperature Ionic Liquids at Glassy Carbon and Gold Electrode Interfaces,” The Journal of Physical Chemistry C 112, 16600–16608 (2008a).
- Forse et al. (2016) Alexander C Forse, Céline Merlet, John M Griffin, and Clare P Grey, “New Perspectives on the Charging Mechanisms of Supercapacitors,” J. Am. Chem. Soc. 138, 5731–5744 (2016).
- Breitsprecher et al. (2017) Konrad Breitsprecher, Manuel Abele, Svystolsav Kondrat, and Christian Holm, “The effect of finite pore length on ion structure and charging,” The Journal of Chemical Physics (2017), 10.1063/1.4986346.
- Janssen et al. (2014) Mathijs Janssen, Andreas Härtel, and René van Roij, “Boosting Capacitive Blue-Energy and Desalination Devices with Waste Heat,” Phys. Rev. Lett. 113, 268501 (2014).
- Härtel et al. (2015) Andreas Härtel, Mathijs Janssen, Daniel Weingarth, Volker Presser, and René van Roij, “Heat-to-Current Conversion of Low-Grade Heat from a Thermocapacitive Cycle by Supercapacitors,” Energ. Environ. Sci. 8, 2396–2401 (2015).
- Wang et al. (2015) Jianjian Wang, Shien-Ping Feng, Yuan Yang, Nga Yu Hau, Mary Munro, Emerald Ferreira-Yang, and Gang Chen, “”Thermal Charging” Phenomenon in Electrical Double Layer Capacitors,” Nano Lett. 15, 5784–5790 (2015).
- Janssen and van Roij (2017) Mathijs Janssen and René van Roij, “Reversible heating in electric double layer capacitors,” Phys. Rev. Lett. 118, 96001 (2017).
- Janssen et al. (2017) Mathijs Janssen, Elian Griffioen, P. M. Biesheuvel, René van Roij, and Ben Erné, “Coulometry and Calorimetry of Electric Double Layer Formation in Porous Electrodes,” Phys. Rev. Lett. 119, 166002 (2017).
- Alam et al. (2008b) M. T. Alam, M. M. Islam, T. Okajima, and T. Ohsaka, “Capacitance measurements in a series of room-temperature ionic liquids at glassy carbon and gold electrode interfaces,” J. Phys. Chem. C 112, 16600–16608 (2008b).
- Sha et al. (2014) Maolin Sha, Qiang Dou, Fabao Luo, Guanglai Zhu, and Guozhong Wu, “Molecular insights into the electric double layers of ionic liquids on au(100) electrodes,” ACS Applied Materials & Interfaces 6, 12556–12565 (2014).