Starbursting [O iii] emitters and quiescent [C ii] emitters in the reionization era Starbursting [O iii] emitters and quiescent [C ii] emitters in the reionization era–192008
Abstract
Recent observations have successfully detected [O iii] and [C ii] lines from galaxies in the early Universe with the Atacama Large Millimeter Array (ALMA). Combining cosmological hydrodynamic simulations and radiative transfer calculations, we present relations between the metal line emission and galaxy evolution at . We find that galaxies during their starburst phases have high [O iii] luminosity of . Once supernova feedback quenches star formation, [O iii] luminosities rapidly decrease and continue to be zero for . The slope of the relation between and at is 1.03, and 1.43 for . As gas metallicity increases from sub-solar to solar metallicity by metal enrichment from star formation and feedback, the line luminosity ratio decreases from to because the O/C abundance ratio decreases due to carbon-rich winds from AGB stars and the mass ratio of H ii to H i regions decreases due to rapid recombination. Therefore, we suggest that the combination of [O iii] and [C ii] lines is a good probe to investigate the relative distribution of ionized and neutral gas in high- galaxies. In addition, we show that deep [C ii] observations with a sensitivity of can probe the extended neutral gas disks of high- galaxies.
Keywords:
hydrodynamics – galaxies: formation – galaxies: high-redshift – galaxies: evolution – galaxies: ISM – radiative transfer1 Introduction
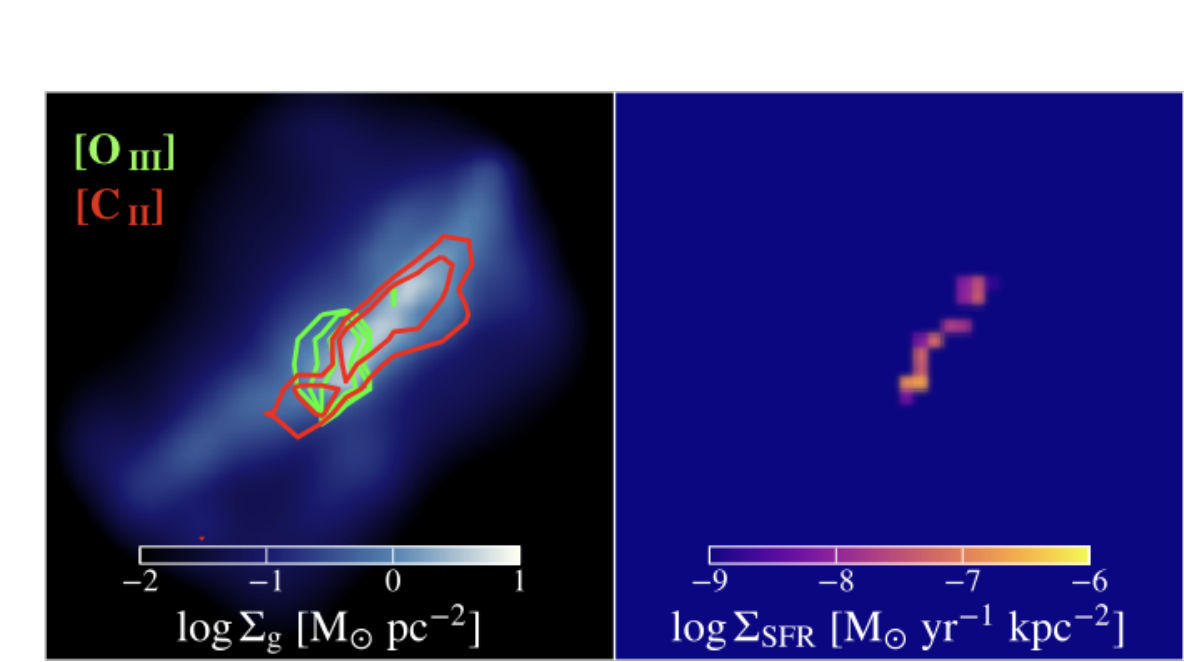
Understanding the physical properties of distant galaxies is one of the major goals of present astrophysical research. Observations of metal lines and dust continuum can be a useful tool to investigate the physical state of the ISM in distant galaxies. Recent ALMA observations have detected metal and dust in galaxies at via the [C ii] line (Willott et al. 2015; Carniani et al. 2017; Decarli et al. 2017; Knudsen et al. 2017; Smit et al. 2018; Marrone et al. 2018; Hashimoto et al. 2019), the [O iii] line (Inoue et al. 2016; Carniani et al. 2017; Laporte et al. 2017; Hashimoto et al. 2018; Marrone et al. 2018; Hashimoto et al. 2019; Tamura et al. 2019), and dust continuum (Watson et al. 2015; Laporte et al. 2017; Bowler et al. 2018; Marrone et al. 2018; Hashimoto et al. 2019; Tamura et al. 2019). These observations can provide information about the physical state and star formation activities of galaxies. For example, the [C ii] line is the main coolant for the warm ISM (Wolfire et al. 2003), and leads to the formation of the cold neutral medium (CNM) via thermal instabilities even in a low-metallicity environment (Arata et al. 2018). The confined CNM becomes molecular clouds, and forms stars. UV radiation from young stars subsequently produces O iii regions. Therefore, combining [C ii] and [O iii] observations will help to understand the physical processes of star formation within a multi-phase ISM (Cormier et al. 2012, e.g.).
Recent observations showed interesting features in high- galaxies. Inoue et al. 2016 reported [O iii] detection for an Lyman- emitter at , but [C ii] was undetected. The upper limit of [C ii] luminosity was much lower than the expected from the relation of local galaxies (De Looze et al. 2014). Laporte et al. 2019 also reported the [C ii] absence for two [O iii] emitters at (Laporte et al. 2017; Hashimoto et al. 2018, see also, ). Meanwhile, Hashimoto et al. 2019 successfully detected both metal lines [C ii] and [O iii] (Marrone et al. 2018; Smit et al. 2018; Tamura et al. 2019, see also,). These galaxies show a negative correlation between the luminosity ratio and bolometric luminosity . The origin of these features has been a puzzle so far.
Some theoretical works studied metal emission lines from high- galaxies. Combining cosmological simulations and analytical model for the multi-phase ISM, Nagamine et al. 2006 predicted the ALMA observability of the [C ii] line from star-forming galaxies at . Pallottini et al. 2017b focused on properties of Lyman-Break Galaxies at . They used zoom-in simulations, and found that H2 galactic disk mainly contributed to the total [C ii] luminosity (Pallottini et al. 2017a; Pallottini et al. 2019, see also). Recently, Moriwaki et al. 2018 studied the observability of [O iii] emitters at using a simulation with a sub-grid model for the ionization structure. Very recently Katz et al. 2019 studied various metal emission lines at using zoom-in radiative hydrodynamics simulations and Cloudy, and found kpc-scale offsets between [O iii] and [C ii] emitting regions. However, their galaxy sample was limited due to the expensive calculation.
As stated above, observed high- galaxies were likely to have a wide variety of metal line properties. In this work, we calculate the metal line properties of 10 galaxies with zoom-in initial conditions and study the relation between metal lines and galaxy evolution. As suggested in the simulations of Yajima et al. 2017 (hereafter Y17), high- galaxies could repeat star-bursts, which results in galactic outflow due to SN feedback. This in turn quenches subsequent star formation, and results in intermittent star-formation histories (Hopkins et al. 2014; Kimm & Cen 2014; Davis et al. 2014, see also,).
Combining hydrodynamic simulations of Y17 and radiative transfer calculations, Arata et al. 2019 studied how the intermittent star formation affected UV and infrared SEDs. We found that the escape fraction of UV photons fluctuated due to changing dust distribution, which resulted in the fluctuations of IR luminosity. In this paper, we focus on how FIR metal emission lines ([O iii] 88 and [C ii] 158 ) are affected by the intermittent star formation.
Our paper is organized as follows. We describe our models for cosmological hydrodynamic simulations and radiative transfer calculations in Section 2. In Section 3, we present our results. In Sections 3.1 and 3.2, we focus on which gas phases contribute to total metal line luminosities (). In Section 3.3, we focus on the fluctuations of due to intermittent star formation in first galaxies. We also show the relation between SFR and , and discuss how ratio decreases with metal enrichment. In Section 3.6, we discuss the ratio, which reflects the ratio of absorbed energy by gas or dust. In Section 3.7, we focus on the spatial distributions of metal emission lines. In addition, we discuss the dependence of our results on sub-grid models for star formation and SN feedback in Sec. 4.1. Finally, we summarise our main conclusions in Section 5.
2 Method
2.1 Cosmological hydrodynamic simulations
We use the Gadget-3 code (Springel 2005, an updated version of Gadget-2 described in) with sub-grid models developed in the Overwhelming Large Simulation project (Schaye et al. 2010) and extended for the First Billion Year (FiBY) project to include sub-grid models for galaxy formation in the early Universe such as e.g. POP-III star formation and molecular networks (Johnson et al. 2013; Paardekooper et al. 2015, see e.g.). The FiBY implementation reproduces general properties of the high- galaxy population well (Cullen et al. 2017; Arata et al. 2019, see e.g.). We first focus on the two haloes presented in Y17, whose total masses are and at (Halo-11 and Halo-12), and call them the fiducial runs. Halo-12 is identified as the most massive halo at with in a simulation box of comoving . To increase our simulated galaxy samples, we perform additional cosmological hydrodynamic simulations. Here we briefly summarize our models.
| Halo ID | SNe feedback | ||||||
|---|---|---|---|---|---|---|---|
| Halo-11 | ON | 1.52 | |||||
| Halo-12 | ON | 2.02 | |||||
| MHalo-0 | ON | 1.54 | |||||
| MHalo-1 | ON | 1.48 | |||||
| MHalo-2 | ON | 1.66 | |||||
| MHalo-3 | ON | 1.58 | |||||
| LHalo-0 | ON | 3.12 | |||||
| LHalo-1 | ON | 2.50 | |||||
| LHalo-2 | ON | 2.29 | |||||
| LHalo-3 | ON | 2.20 | |||||
| LHalo-4 | ON | 2.19 | |||||
| LHalo-5 | ON | 2.09 | |||||
| Halo-11-lowSF | ON | 1.52 | |||||
| Halo-11-noSN | OFF | 1.52 | |||||
| Halo-12-lowSF | ON | 2.02 | |||||
| Halo-12-noSN | OFF | 2.02 |
We first conduct -body simulations with box-sizes of and , and identify the four most massive haloes at . We call them MHalo-0, 1, 2, 3 and LHalo-0, 1, 2, 3, respectively. We also perform an additional N-body simulation with box size until and identify the two most massive haloes with masses of and . We then recompute hydrodynamics in the zoom-in region until (LHalo-4, 5). We set the gravitational softening length to in comoving units for every zoom runs.
Figure 1 shows the redshift evolution of halo masses in the zoom runs. We observe differences in the growth rates between Halo-12 and the LHaloes, which we ascribe to the environments that they live in. This can be quantified by the mass overdensity at within a sphere of radius centered on each halo: (for Halo-12), and and for LHalo-0, 1, 2, 3, 4 and 5 respectively. Here, we measure the overdensity as with a spherical top-hat window of comoving radius 1 Mpc, where and are the mean matter density in the zoom-in regions and the cosmic mean density, respectively. The overdensity for LHalo-0, 1, 2 and 3 corresponds to . From these values, it is evident that LHaloes live in more dense environments than Halo-12, which results in earlier growth of halo masses. At , Halo-12 catches up with LHaloes and achieves an intermediate halo mass among them. Also, Halo-11 shows somewhat slower growth than MHalo-0, 1, 2 with higher values. In practice, the halo growth at could be affected by smaller-scale density fluctuation, and may not be tightly correlated with the overdensity on 1 Mpc scale. Nevertheless, the different overdensity within 1 Mpc do reflect the different growth rates of haloes roughly.
Next we make zoom-in initial conditions with effective resolution of particles for box and particles for box using the MUSIC code (Hahn & Abel 2011), and carry out hydrodynamics simulations up to . The detailed information of the models is shown in Table 1.
The local star formation rate is calculated as (Schaye & Dalla Vecchia 2008)
| (1) |
where is a specific heat index, and is the mass of gas particle. The is gas mass fraction in the self-gravitating galactic disk, and is total ISM pressure. This equation is based on the Kennicutt–Schmidt relation (Kennicutt 1998). We assume and . We also use as the fiducial value, which is 10 times higher than that of local star-forming galaxies, but recent observations have shown that higher values are preferred for merging or high- galaxies (Genzel et al. 2010; Tacconi et al. 2013, e.g.). To check the impact of on our main results, we also study a run with (indicated as ‘low-SF’ in Table 1). Our star formation threshold density is (Johnson et al. 2013).
Our simulations track the abundances of 9 elements (H, He, C, N, O, Ne, Mg, Si and Fe) for each particle separately (Wiersma et al. 2009b). The sources of chemical enrichment are Type-Ia/II SNe, and AGB stars (Portinari et al. 1998; Marigo 2001). For galaxies, it is dominated by Type-II SNe, because it takes to become AGB stars for low- and intermediate-mass stars. However, as we will show later, the AGB star contribution is important for some of the abundance ratio, such as O/C. In this paper, we consider all of the above chemical sources in our calculations of metal line luminosities (Sec. 2.3, 2.4).
SN feedback injects thermal energy into neighbouring gas particles stochastically (Dalla Vecchia & Schaye 2012). The injection energy is per single SN event, and the randomly selected gas particles are heated up to . The thermal energy is efficiently converted into kinetic energy against radiative cooling, if the gas density is lower than the critical value of . The numerical resolution of our simulations are adequate to successfully launch galactic winds and suppress star formation (see Y17). We further perform simulations without SN feedback to investigate the impact on metal line properties (indicated as ‘no-SN’ in Table 1). In this case, surrounding gas is not heated by the SN feedback, but only the metal enrichment occurs into neighbouring gas particles.
2.2 Radiative transfer
In next sub-sections, we model metal emissions based on the ionization structure of hydrogen gas. To obtain it, we use the radiative transfer code, All-wavelength Radiative Transfer with Adaptive Refinement Tree (Art2) code (Li et al. 2008; Yajima et al. 2012b). The details of this code were described in A19.
The Art2 is based on the Monte Carlo technique. It tracks propagation of photon packets emitted from stellar particles, and computes the emergent SED. We use a total of photon packets for ionizing ( eV) and non-ionizing ( eV) radiation with 500 frequency bins.
The intrinsic SED for each stellar particle is taken from Starburst99 (Leitherer et al. 1999) assuming the Chabrier initial mass function with a mass range of (Chabrier 2003). Art2 calculates the transfer of ionizing photons, UV continuum and dust absorption/re-emission using adaptive mesh refinement (AMR) cells. The spatial resolution of the minimum size cells is set to physical for Halo-11 at which is similar to the minimum smoothing length of SPH particles. The construction of the AMR cells is based on the gas density structure. The minimum smoothing length of gas particles is 20 comoving pc, and the physical scale becomes close to the minimum cell size pc at . Thus our AMR grid follows the detailed ISM structures which are described by the SPH simulations. The stellar distribution is restricted by the softening length of 200 comoving pc, which brings uncertainties in the small scale structures of Hii regions ( physical pc). However, our main interests are in the total metal-line luminosities and large scale morphologies ( physical kpc). Therefore, our results should not change significantly due to the uncertainties of the super-sampling by the AMR grid.
We assume that the dust-to-gas mass ratio is proportional to gas metallicity as seen in local galaxies, (Draine et al. 2007). We adopt the dust size distribution derived in Todini & Ferrara 2001. They modeled the formation and evolution processes of dust grains in the expanding ejecta of SN, and investigated the size distribution. More massive SN progenitors create heavy elements more efficiently, however, large amounts of metals in the internal layers fall back to the center if the kinetic energy is not large enough for escape. Thus they argue that intermediate-mass progenitors are the main sources of interstellar dust. We use their model for SN from stars of with and solar metallicity. For example, this model could explain the extinction curves of quasars (Maiolino et al. 2004). Also, observability of high- dust emission by the ALMA was reproduced with large simulation samples (Arata et al. 2019). This model uses the cross-sections for absorption and scattering (Weingartner & Draine 2001) to obtain the dust opacity. In addition, before the radiative transfer calculation, the local is multiplied by a scaling factor which is a function of gas temperature of the cell, , where is the minimum dust-to-gas mass ratio, considering that the dust abundance is much lower in the ionized regions (Burke & Silk 1974; Reynolds et al. 1997). Note that we focus on high-redshift galaxies whose ISM is not heavily enriched by metals. Therefore, the dust absorption in ionized regions is unlikely to be significant.
In addition, we do not consider the UV background in our RT calculations, which is important for the ionization state of the IGM (Haardt & Madau 2012). However, we are mainly interested in gas at densities higher than that for self-shielding (Nagamine et al. 2010; Altay et al. 2011; Yajima et al. 2012a; Bird et al. 2013; Rahmati et al. 2013, ;). Thus our conclusions do not change by neglecting the effect of the UVB.
2.3 [O iii] emission model
UV photons from massive stars create [O iii] regions. Therefore, the [O iii] luminosity is likely to be related closely with star formation activity. Recent observations successfully detected [O iii] lines and confirmed the redshifts of distant galaxies even at (Hashimoto et al. 2018, e.g.,). Since the ionization potential of O+ O2+ is , O2+ ions exist only in H ii regions. Based on the photo-ionization radiative transfer calculations (Sec. 2.2), we classify all cells into ‘H i cell’ and ‘H ii cell’ according to their hydrogen neutral fractions, separated at the value of 0.5. Next we calculate doubly ionized fraction of oxygen in each H ii cell assuming ionization equilibrium between O+ and O2+ 11 1 Here we neglect the O i abundance, because the ionization potential is similar to that of H i (), and most O i atoms are ionized in H ii region.:
| (2) |
The left hand side represents the photo-ionization rate per volume, where is the minimum frequency for ionization. For the photo-ionization cross section we use the fitting function derived in Verner et al. 1996 (Ferland et al. 1998; Richings et al. 2014, same as in Cloudy,). We evaluate the flux using the optically-thin approximation and sum up contributions from nearby stellar particles:
| (3) |
where is the specific luminosity of the -th stellar particle, and is the distance from the cell. In the above estimation, we calculate the radius of the Strömgren sphere as , where [] is the ionizing photon emissivity of a nearby stellar particle. If the radius reaches a target cell, the flux from stars in the nearby cell is considered using the above equation. We need this condition to exclude the contributions from stellar particles in the other H ii regions, because their UV radiation should be interrupted by intervening neutral gas. In this estimate, we do not consider the expansion of the Strömgren sphere due to the overlap of ionizing flux from nearby stars. Also, the dust absorption is ignored here because of the modeled low dust content in H ii regions. The right-hand-side of Eq. (2) represents recombination rate per volume, where is the coefficient as a function of temperature (Nahar & Pradhan 1997; Nahar 1999).
The O2+ ground state has three fine-structures: , , and . The FIR line is emitted via the transition. We calculate the rate equations among three levels (Nussbaumer & Storey 1981), and obtain the level populations. Local [O iii] luminosity from a H ii cell is estimated by
| (4) |
where () is the Einstein coefficient of collisional excitation (de-excitation) which depends on electron density. The is the cell volume, and is the escape probability, for which we assume optically thin case of . In addition, if gas temperature is higher than , we set the luminosity to zero because the ionization degree of oxygen is triple or higher (Nahar 1999). We show the comparison between our model and Cloudy in Appendix A. Most of the gas shows [O iii] emission similar to Cloudy, while a part of the gas deviates from it by a factor of a few. However, we find that the total [O iii] luminosity is almost the same as the Cloudy result.
2.4 [C ii] emission model
The [C ii] FIR line can be radiated from gas in various phases, i.e., warm neutral and ionized medium, CNM and molecular clouds (Wolfire et al. 2003, e.g.), thus the modeling is relatively difficult. Previous theoretical work studied the contributions from each component with cosmological hydrodynamics simulations (Olsen et al. 2017; Pallottini et al. 2017a; Katz et al. 2019). Olsen et al. 2017 showed that diffuse ionized gas and molecular clouds were the main contributors to the [C ii] luminosity. Whereas Pallottini et al. 2017a and Katz et al. 2019 suggested that the [C ii] luminosity was connected to gas in dense environment. Observational constrains on the contributions suffer from the difficulty of determining the optical depth to the line (Neri et al. 2014, e.g.).
The [C ii] emission model is similar to that of [O iii] emission described in previous sub-section. However, in the case of [C ii] , we consider both H i and H ii cells as the emission sites. For the H ii cells, we calculate the ionization equilibrium between C+ and C2+ under the stellar radiation field (Eq. 2). Meanwhile, we assume that all carbons are in C+ ions for H i cells. In our Galaxy, carbons are almost completely in C+ ions under the FUV () and cosmic ray background which are radiated by nearby star-forming regions and external galaxies (Webber 1998; Seon et al. 2011, e.g.). Thus our assumption is valid if the galaxy is exposed to such a strong radiation field in the Habing band, or at least our model provides an upper limit of the [C ii] luminosity. If we consider the attenuation of the Habing band by hydrogen molecules, the C+ abundance could decrease because some fraction of carbons would be C i.
The [C ii] 158 line is radiated via the transition . The luminosity is calculated as in Eq. 4. If the temperature of a cell is higher than , the luminosity is set to zero because carbons are collisionally ionized to double or higher (Nahar & Pradhan 1997). Here we adopt the optically-thin approximation for the [C ii] 158 line, i.e., . Note that, however, Neri et al. 2014 suggested that the optical depth for an observed galaxy could be . If this is common in high- galaxies, our model may somewhat overestimate the [C ii] luminosity. In addition, we also note that the cosmic microwave background (CMB) can affect [C ii] emission (Goldsmith et al. 2012; da Cunha et al. 2013, e.g.). As the redshift increases, the CMB temperature () approaches the equivalent temperature of [C ii] emission (), although it is still smaller by a factor of a few. Thus stimulated emission/absorption may be significant for galaxies (Vallini et al. 2015; Lagache et al. 2018). In Appendix B, we estimate the CMB effect and find that the stimulated emission/absorption due to CMB (spin temperature coupling) is not significant. Therefore, the CMB reduces the luminosity only by a few percent.
3 Result
3.1 Projected Images

The left panel of Figure 2 presents a 2-D map of gas column density in Halo-11 at . The total stellar mass, gas mass, and dust mass are , and . The gas structure shows filaments and clumps, and extends over . The middle and right panels show the surface brightness of [O iii] 88 and [C ii] 158 , which represent ionized and neutral regions (see Fig. 3.2), and the brightest pixels have 157.6 and 485.7 , respectively. We find that the [O iii] map is sharply cut off at high-density regions of (white in the left panel). In addition, future deep [C ii] observations with a sensitivity of will be able to probe the structure of extended cold gas disks over (pink in the left panel). The integration time of hours with the fully operated ALMA achieves detection. We here use the ALMA sensitivity calculator22 2 https://almascience.eso.org/proposing/sensitivity-calculator.
3.2 Physical properties of gas with metal-line emission
The left panel of Figure 3 shows the phase diagram of gas in Halo-11 at . The hot ionized medium () cools down to via metal cooling (Wiersma et al. 2009a) and hydrogen cooling. Star formation occurs in dense gas clouds (). The star-forming clouds contracts based on the effective equation of state (Schaye & Dalla Vecchia 2008). Due to SN feedback, the gas near young stars is returned to the hot phase. In this work, we consider the photo-ionization of gas due to young stars by post-processing, and heating up the gas to if the ionization degree of hydrogen exceeds 0.99. In the post-processing ionization transfer, the minimum temperature of gas is set to the results of the hydrodynamic simulations. The corrected gas temperature is shown by the gray contours in the middle and right panels.
The middle panel of Fig. 3 shows the physical state of gas emitting the [O iii] line. The total luminosity is , and the half of it is contributed by completely ionized gas (). The right panel shows [C ii] emitting phases. The total luminosity is , and its 99% is contributed by the neutral gas (). In particular, the gas clouds with are the main contributor (88%) to the total luminosity. The large contribution from high-density regions is similar to the results of previous works (Pallottini et al. 2017b; Katz et al. 2019). Since the density is higher than the critical density for thermalization of 158 fine-structure transition (, see Fig. 19), the cooling rate per hydrogen atom is saturated. Observationally, Croxall et al. 2017 studied the contribution from neutral gas using local star-forming galaxies, and showed that it decreased from to as gas metallicity increased from to . The metallicity of Halo-11 at is . Thus the observational result supports our very high contribution from the neutral gas. We show that the metal-line luminosities rapidly change due to SN feedback as shown in the next sub-section.
3.3 Redshift Evolution of Metal Emission Lines
As shown in A19, UV and IR continuum flux from high- galaxies rapidly change due to the intermittent star formation history and SN feedback. Here we study the time evolution of metal lines. The top panel of Figure 4 shows the redshift evolution of the SFR of Halo-11 at . SN feedback evacuates most of the gas in galaxies and quenches star formation. The galaxy repeats the cycle of starburst and quenching at . The time-scale of fluctuation is which corresponds to the free-fall time of the halo. As the halo mass increases, the deep gravitational potential holds the gas against SN feedback, resulting in more continuous star formation (see Arata et al. 2019, for details).
The middle panel of Fig. 4 shows the escape fraction of ionizing (Lyman-continuum) photons. During the star-burst phases, ionizing photons are efficiently absorbed by dusty clouds surrounding star-forming regions, while increases during outflow phases because SN feedback makes holes allowing photons to escape. This results in the fluctuation of between at . Recent simulations also showed a similar trend (Paardekooper et al. 2013; Kimm & Cen 2014; Kimm et al. 2017; Katz et al. 2018). Kimm & Cen 2014 showed that fluctuated in and the time-averaged decreased with increasing halo mass by using cosmological radiative hydrodynamic simulations.
At , the gas structure becomes filamentary, and star formation occurs in the knots as shown in Fig. 5. The ionizing photons efficiently escape into the perpendicular direction to the filament (). As described in the previous sections, the [O iii] and [C ii] lines are emitted from ionized regions (knots) and neutral gas (filament), respectively. Thus we suggest that the combination of [O iii] and [C ii] observations will reveal the neutral and ionized gas distribution, and indicate the escaping direction of ionizing photons. In addition, other simulations, which include radiative feedback from massive stars, have suggested rapid expansion of H ii bubbles (Hopkins et al. 2014, e.g.). This implies extended low-density [O iii] regions. Meanwhile, our simulations predict very compact and high-density regions with , extending over with a surface brightness of at (see Fig. 2, the half light radius of the central clump is as discussed in Sec. 3.7). Thus we suggest that the comparison of size and surface brightness of [O iii] regions with observations can help constrain the physical models of radiative feedback in high- galaxies. Note that, however, if the metal distribution is still confined to only star-forming regions, it is likely to be difficult to distinguish the models. Therefore, the comparison test should be applied to massive metal-rich galaxies.
At , decreases to as the halo mass increases, which is consistent with the literature (Yajima et al. 2011; Yajima et al. 2014; Paardekooper et al. 2015, e.g.). In addition, as shown in A19, dusty gas is held in the massive halo against SN feedback, and the dust efficiently absorbs ionizing photons.
The bottom panel of Fig. 4 shows the [O iii] and [C ii] luminosities. The [O iii] line is emitted only in the star-bursting phase because O2+ ions exist in H ii regions formed by massive stars. We find that fluctuates with intermittent star formation in the range of at for Halo-11. Meanwhile, the main source of [C ii] emission is neutral gas, thus it is continuously emitted even in the outflowing phase. The contribution of [C ii] emission from H ii regions to the total luminosity (dotted line) increases during the star-bursting phase, but it does not exceed 50 % over all redshifts. It gradually decreases with time due to dust absorption and results in at .
We note that in some snapshots Halo-11 has high [O iii] luminosity at very high redshifts () even when the escape fraction is . This is because the stars have low-metallicity () and emit ionizing photons efficiently. Thus one needs to consider stellar populations carefully when discussing the –SFR relation (see next sub-section).
3.4 Metal-line luminosity vs. SFR
Figures 6 and 7 present [O iii] and [C ii] luminosities vs. SFR for Halo-11 and Halo-12 at and 9. Our simulations reproduce the observed luminosities well at . In particular, Halo-12 shows , , and at , which are remarkably consistent with B14-65666 at (, , and ) as reported by Hashimoto et al. 2019. [O iii] luminosities in our simulations cannot reproduce the galaxies with lower luminosities observed in Inoue et al. 2016 and Laporte et al. 2017. Also our simulations have higher [C ii] luminosities than some observed galaxies with . The origin of this deviation requires simulating a larger sample of galaxies which we aim in future work.
Also we compare our results with the relation of local galaxies derived in De Looze et al. 2014. They presented calibrations of the SFR– relations in the range of using low-metal galaxies from the Herschel Dwarf Galaxy Survey and other local samples from previous FIR line measurements (Brauher et al. 2008; Parkin et al. 2013; Sargsyan et al. 2012; Díaz-Santos et al. 2013; Farrah et al. 2013; Graciá-Carpio et al. 2011). The [O iii] luminosities in our simulations are similar to those of metal-poor dwarf galaxies rather than local starburst galaxies. This result is consistent with Moriwaki et al. 2018, but is opposite to those of (Olsen et al. 2017; Katz et al. 2019). The chemical abundance pattern of galaxies at is dominated by Type-II SNe, and quite different from the solar neighbourhood. In the calculation of [O iii] luminosity, we use the oxygen abundance of each gas particle, which is the same treatment as in Moriwaki et al. 2018 but not as in Olsen et al. 2017 and Katz et al. 2019. Katz et al. 2019 showed that their SFR– relations had a good agreement with the local galaxies of De Looze et al. 2014, however their simulations did not track element abundances separately. The oxygen abundance (mass-weighted mean) of Halo-12 evolves from at to at , and the range is close to that of local relation of (De Looze et al. 2014). Thus we suggest that the physical state of the ISM in the first galaxies might be similar to that of local dwarf galaxies except for massive high- galaxies like Halo-12 at .
From the least-square fitting to all samples (Halo-11, Halo-12, MHaloes, LHaloes) at , we derive the following relations:
| (5) |
| (6) |
We find that [O iii] luminosity is linearly proportional to the SFR, because most of the ionizing photons are absorbed by gas () for all of the galaxies and the volume of H ii regions ([O iii] emitting regions) linearly increases. These fits nicely match the observed results at (Harikane et al. 2019). The –SFR relation at high- is very close to the relation for local metal-poor dwarf galaxies, while the slope of –SFR relation is steeper than the local ones (De Looze et al. 2014, 1.0 for starburst galaxies and 1.25 for metal-poor galaxies,). Therefore, this indicates that neutral gas distribution in high-redshift galaxies is different from local ones. In addition, these results are also supported by a more statistical study using semi-analytical models (Lagache et al. 2018).
Note that if efficient absorption is a common feature for high- galaxies, any deviation from a Chabrier IMF would be reflected in the first term of Eq. (5). Noting that . In other words, a top-heavy IMF predicts higher [O iii] luminosity at a given SFR, because more gas clouds would be ionized. Therefore a good observational estimate of this relationship can give us insights about the physics of star formation in high- galaxies. The same is also true for Eq. (6), which includes the contribution from accreting cold gas () (Dekel & Birnboim 2006, e.g.). A higher normalization of Eq. (6) points toward higher accretion rates from cold accretion, and we can also expect this relation to change with redshift slightly as accretion rates are higher at earlier times. Additionally, a top-heavy IMF can also change the gas distribution significantly via stronger feedback. If a strong gas outflow is induced, ionizing photon can escape efficiently, resulting in lower [O iii] luminosity. Therefore, further simulations are needed to provide stronger constraints on the impact of the IMF.
Finally, we compare the stellar masses of different halos at to examine the effect of different star formation histories. Figure 8 shows the stellar-to-halo-mass ratio (SHMR) as a function of halo mass. Halo-11 and MHaloes roughly match with the observational SHMR at (Behroozi et al. 2013, the so-called abundance matching result by). However, Halo-12 and LHaloes have slightly higher SHMR than the Behroozi result. One of the interpretations of this is that we need more effective feedback processes, e.g., stellar radiation or AGN feedback, which suppresses star formation in massive haloes. We also note that the observations might be highly biased due to lack of large high- samples.
3.5 [O iii] and [C ii] luminosity ratio
In this subsection, we focus on the [O iii] and [C ii] luminosity ratio. Hashimoto et al. 2019 showed the negative correlation between and bolometric luminosity for galaxies at , in range of (Marrone et al. 2018, see also). The luminosity ratio can reflect the multi-phase ISM structure (Cormier et al. 2012, e.g.). Cormier et al. 2015 found the same trend in local star-forming galaxies, and suggested that it depended on gas metallicity. Here we suggest that the origin of the negative correlation of high- galaxies is the carbon enrichment by AGB stars and the decrease of H ii fraction.

Figure 9 presents the – relation at , where is measured from . We find that ratio decreases from to in the range of with increasing metallicity from to . The increases from to , while is constant (). The lower-mass galaxies has higher O/C ratio because Type-II SNe efficiently enrich the ISM with oxygen than carbon. As the galaxy evolves, low- and intermediate-mass stars begin to eject carbon-rich winds by dredge-up events of AGB phases (Berg et al. 2019, see also). The decreases from to when metallicities increase from to , therefore the ratio decreases (Figure 11). To confirm the validity of this scenario, we use the Chemical Evolution Library (Saitoh 2017, CELib,), and compute in a star-forming cloud with and the Chabrier IMF. The decreases from to when the age exceeds which corresponds to half of the cosmic time at . Of course, in the actual hydrodynamic simulation, we have inflow of low-metallicity gas as well as metal-enriched outflows, so the situation is not as simple as the CELib result. However, the line luminosities are weighted by the densities of each element, and more dominated by the higher density gas near the galactic center, which is less affected by the outer gas. At least, the qualitatively trend of CELib result is consistent with our simulation result.
Our simulations are in good agreement with high- observations. Also, ratios decreases as the metallicity increases, of which the trend is similar to local dwarf galaxies (Cormier et al. 2015). However, the absolute values of the ratios are higher than the local galaxies (grey symbols). Our samples have high ionization parameter (, where is mean ionization parameter weighted by [O iii] luminosity) and high volume fraction of H ii regions (). Using Cloudy models, Harikane et al. 2019 suggested that galaxies with high- and low covering fraction of PDR can explain higher ratio than local galaxies. Our results are consistent with Harikane’s picture of the first galaxies.
Figure 10 describes more details of redshift evolution of ratio. The top panel shows that ratio largely fluctuates with intermittent star formation in case of Halo-11 (blue line). But it gradually decreases with decreasing redshift due to carbon enrichment by AGB winds (second panel). Due to continuous star formation at , gas in Halo-11 is highly ionized (). However, the gas density in H ii regions is high, because the massive haloes keep gas against SN feedback, resulting in lower-. The third panel shows the mass ratio of H ii to H i regions. At lower redshifts, the dense gas rapidly recombines and reduces the mass ratio, resulting in decreasing the luminosity ratio because the dominant [O iii] and [C ii] sources are H ii and H i regions, respectively. The bottom panel shows that the gas metallicity in the halo gradually increases from towards lower redshift, because metal-enriched gas ejected by SN feedback can fall back to the halo due to the deeper gravitational potential well.
Note that from the equation of line emission, the ratio depends on the O/C abundance ratio, mass ratio of and a factor of the Einstein’s -coefficient. At , both of the O/C ratio and ratio of Halo-11 become times as much as at , resulting in largely decreasing the ratio. The evolution of density and temperature also contributes to this decline.
We also compare the ratio with that of lowSF (green) and noSN (red) cases. In the lowSF case, we set a lower value for the coefficient of Kennicutt–Schmidt relation () than that of the fiducial case, which induces higher gas density (see also, Y17). The SFR becomes similar in both cases by feedback processes, but the H ii volume fraction in the lowSF case is lower, because the dense gas rapidly recombines (see Sec. 4.1). The high density also makes the energy injection by SNe inefficient due to radiative cooling, thus the metal enrichment proceeds faster. These factors lead to very low ( at ). On the other hand, the noSN case has similar gas densities as the fiducial case, but SN feedback does not evacuate gas from the halo, resulting in rapid metal enrichment. The O/C abundance ratio stays at low values, resulting in low ().
Metallicity in high- galaxies are observationally estimated using the attenuation by Fe ions in the UV part of the stellar spectrum. However, Cullen et al. 2017 shows that simulated galaxies at are -element enhanced, which is consistent with the observational study of Steidel et al. 2016. They found a factor of difference between stellar and nebular metallicities. Thus the observational metallicity estimate based on Fe abundance does not trace the total metallicity in high- galaxies. Figure 11 shows that observations of ratio could be a useful tool to estimate the total metallicity of galaxies at high- more precisely. Using a least-square fitting for galaxies with , we derive the following relation for the total metallicity:
| (7) |
For example, the metallicity of B14-65666 at (Hashimoto et al. 2019) is estimated to be using the above relation. Note that the dispersion is large with dex, and there are some outliers. This can be due to other factors, e.g., ionization degree, or the small sample sizes. We will investigate in more detail statistically in the future work.

3.6 The ()– relations
In addition to the ionization of hydrogen and metals, UV radiation from young stars also heats up dust, resulting in IR thermal emission. Therefore, both [O iii] and IR luminosities are likely to be related with the SFR. However, depending on the ratio of absorbed energy of ionizing photons between gas and dust, the luminosity ratio changes. Local observations show that and decrease as increases (De Looze et al. 2014; Cormier et al. 2015; Díaz-Santos et al. 2014). Cormier et al. 2015 point out that extended dwarf galaxies have higher and suggest the large volume fraction of ionized regions be the reason for this. In addition, recent observations show a similar trend even for high- galaxies (Tamura et al. 2019, e.g.). Here we study the origin of the correlations in – relation.
Figure 12 shows the relation between and at . There is a weak negative correlation that is consistent with local star-forming galaxies, dusty star-forming galaxies and ultra-luminous infrared galaxies (ULIRGs). At , most of the ionizing photons are absorbed by the gas even in less massive galaxies, resulting in a low escape fraction (, see Fig. 4) and a linear –SFR relation (equation 5). Meanwhile, UV continuum photons can escape through the direction of low dust column density in the outflowing phase (). We find that the negative correlation is closely related to the escape fraction of UV photons. In A19, using all of the galaxies including main and satellites in the zoom-in boxes of Halo-11 and Halo-12, we presented the –SFR relation at (Equation 6 in A19):
| (8) |
If the UV light is completely reprocessed into the IR-band, the slope must be unity because UV luminosity is linearly proportional to SFR (Kennicutt 1998, e.g.,). However, the high UV escape fraction of low-mass galaxies reduces the IR luminosity, resulting in as steeper slope. Combining Eq. (5) and (8), we plot the thick yellow band on the figure. It roughly reproduces our simulation results and observations of high- galaxies, while some high-redshift galaxies are distributed far away from our model results. In addition, our galaxies have high volume fraction of H ii regions (), which is responsible for higher than in local star-forming galaxies at a specific .

Figure 13 shows ()– relation. The model based on the combination of Eq. (6) and (8) is plotted as a thick yellow band. It increases with because of the steeper slope of the –SFR relation than that of the –SFR relation. Our simulations match the model nicely. However, the luminosity ratios of observed galaxies decreases as unlike in our simulations. This discrepancy can be explained by the dust effect. Luhman et al. 2003 suggested the ‘dust-bounded model’, where the dust in H ii regions efficiently absorbs UV photons, resulting in inefficient photo-electric heating of polycyclic aromatic hydrocarbons (PAHs) in PDRs. Therefore, the thermally-balanced [C ii] cooling also becomes inefficient. Also, if the dust is positively charged, the photo-electric heating and [C ii] cooling can be suppressed (Wolfire et al. 1990; Luhman et al. 2003). Combining [C ii] 158 and CO (3-2) observations at , Rybak et al. 2019 suggests that high-temperature saturation of C+ level populations due to a strong UV radiation field induce the [C ii] deficit (Muñoz & Oh 2016). Our simulations do not include photo-electric heating. Given that the photo-electric heating is included, the [C ii] luminosities of bright galaxies could be decreased because a part of far-UV photons are absorbed in H ii regions near the star, and the temperature of H i regions becomes lower. Also, [C ii] luminosities of faint galaxies could be increased by the photo-electric heating because in their dust-less ISM most of FUV photons reach to H i regions and increase the temperature, inducing the [C ii] emission. These effects can change the trend. In addition, we assume that all carbons in neutral hydrogen gas cells are in the C+ state. In high-density low-temperature regions, a part of carbons form CO molecules. If its effect is not negligible, we overestimate the [C ii] luminosity.
We also note that the observed IR luminosity of high- galaxies are not constrained well. Since most galaxies were detected with a single sub-mm band, the dust mass and total IR luminosity were estimated with assumed dust temperatures (Watson et al. 2015, e.g.). In our previous paper, we showed that dust temperature of high- galaxies could be higher than that of local ones (Ma et al. 2019, see also,). Currently, the multi-wavelength observations of dust continuum have advanced. Bakx et al. 2020 observed a galaxy (Tamura et al. 2019, MACS0416_Y1,) in three sub-mm wavelength, and showed that the dust temperature should be warm (). Meanwhile, Harikane et al. 2019 showed that their two galaxies at have similar dust temperature with the local ones (.) Future observations will reveal dust temperature of high- galaxies, allowing us to estimate the IR luminosity more accurately.

3.7 Galaxy size measured by [C ii] line
The size of galaxy was classically considered to be determined by the conservation of angular momentum of accreting gas (Mo et al. 1998). However, recent simulations showed that stellar feedback re-distributes angular momentum and changes galaxy sizes (Genel et al. 2015, Y17). Therefore the galaxy morphology can be used as a test of theoretical feedback models. Recently, Fujimoto et al. 2019 stacked the ALMA data of 18 galaxies at , and detected the [C ii] emission extended over . The effective radius was larger than the disk scale measured from the rest-UV and FIR continuum emissions.
Our simulated galaxies have disk structures at , and the sizes are affected by SN feedback as described in Y17. In A19, we showed that the UV half-light radius changed within the range of of virial radius due to intermittent star formation history. The UV radial profile was dominated by the central star-forming regions in star-burst phases. On the other hand, in outflowing phases, the gas is ejected from the centre and the gravitational potential becomes shallower, resulting in an extended distribution of residual high-mass stars and UV radial profile.
Recent ALMA observations have allowed us to study the kinematics and sizes of distant galaxies via [C ii] emission. Thus we here focus on the galaxy size measured by [C ii] 158 line. Figure 14 shows that the half-light radius of [C ii] intensity map changes with intermittent star formation. It is dominated by the emission from central high-density clumps and becomes small () in star-burst phases, while it becomes extended in the outflow phase. In this figure, we set an upper limit to the half-light radius at () to avoid artificially large sizes due to galaxy mergers. At , [C ii] sizes rapidly changes due to complex clumpy gas structures in the disk.
In the lowSF case (green dotted), the inefficient star formation (lower- coefficient in the Kennicutt–Schdmit relation) induces higher gas density at the galactic center, because the gas is transported before the star formation proceeds. The high-density regions can keep the higher SFR due to lower feedback efficiency via efficient radiative cooling (see also Y17 and A19). We find that [C ii] size in the lowSF case has lower values than that of the fiducial case, because high-density clumps continuously reside in the central region (see also, Sec. 4.1).
Figure 15 presents the stacked [C ii] radial profiles for haloes (red; Halo-11 + MHaloes), and for haloes (blue; Halo-12 + LHaloes) at . Here we make the [C ii] intensity maps seen from three viewing angles for each halo, and examine the variation. Our simulations show that the surface brightness extension becomes large as the galaxy mass increases. The two solid lines in Fig. 15 show that the intrinsic intensity profiles are very peaky at the inner radii (), and has extend wings in the outskirts which decreases slowly. To mimic the observation by ALMA, we convolve the simulated profiles with the point spread function (PSF) of ALMA in two different ways. The ALMA PSF has a gaussian-like central peak and a long tail with slight negative values (Fujimoto, in private communication). The first method is to fully consider the negative tail of ALMA PSF at , which causes abrupt truncation of the convolved profile at kpc as shown by the dot-dashed lines. The second method is to simply neglect the negative part of PSF and only use the positive gaussian-like peak in the central part for convolution, which results in the dotted curve. In the second method, the central profile is identical with the first method at kpc, but the extended outer tail is preserved after the convolution without being subtracted to zero. In both cases, the PSF is normalized to unity, so that the total flux is conserved before and after the convolution. Both cases show that the shape of inner profiles () is completely determined by that of the PSF (because the central intrinsic peak is acting almost like a delta-function), and the contribution from outer radii are negligible. The observational result by Fujimoto et al. 2019 is shown by the black solid line, which extends out to kpc with a shallower slope than the simulation results. They used galaxies with , which is in the similar range of simulated galaxies in our haloes (see Table 1). The average [C ii] luminosity of observed galaxies () is intermediate between the averages of Halo-11 + MHaloes () and Halo-12 + LHaloes (). Even after the convolution, we find that the simulation results are much steeper than the observed result with higher intensities in the central region. The intensity profile in the outer part ( kpc) is similar to the observed one by Fujimoto et al. 2019, but is slightly lower at kpc. These differences in the intensity profiles might give us important clues regarding the physics of feedback in high- galaxies. In order for our simulations to reproduce the observation, the [C ii] flux has to be decreased in the central region by about orders of magnitude. Using the escape-probability program RADEX (van der Tak et al. 2007), Neri et al. 2014 suggested that the [C ii] line of high- galaxies might be optically thick at a C+ column density of (Crawford et al. 1985; Stacey et al. 1991a; Stacey et al. 1991b; Mashian et al. 2013, see also,), which corresponds to a hydrogen column density (which further corresponds to the SFR density of ). Here we assume the solar abundance ratio (Asplund et al. 2009, ,). If the metallicity is less than solar, the critical hydrogen column density should be higher, and we can estimate it as . The central column densities of our simulated galaxies are and the metallicities are higher than . Thus we conclude that the assumption of optically-thin emission in our model would overestimate the central [C ii] luminosity. In addition, our simulations do not resolve molecular cloud formation in which C+ ions will rapidly react to form CO molecules and reduce further central [C ii] emission (Narayanan & Krumholz 2017).
Furthermore, a more realistic feedback model might reduce the discrepancy of [C ii] luminosity in the outer part. For star-forming galaxies, stellar radiation pressure ejects the gas out of the disk within a few Myr, then the cold gas clouds are further accelerated by the ram pressure of SNe. These processes generate cold outflows with (Murray et al. 2011; Muratov et al. 2015, e.g.), and the stacking from various viewing angles might produce the extended [C ii] profile. In addition, we note that there is the difference of gas distribution among the code schemes (Kim et al. 2016, e.g.). In Fujimoto et al. 2019, we compared our simulations with those of Pallottini et al. 2017a which were calculated by an adaptive mesh refinement code Ramses (Teyssier 2002). Their galaxies are more extended than ours and matched with observation in the inner part. However, both simulations could not reproduce the extended [C ii] halo in the outer part.
Furthermore, using a spherically symmetric outflow model, Pizzati et al. 2020 studied the [C ii] profile semi-analytically. They argued that a very high-mass loading factor () was required to explain the observed profiles. To achieve the high-, we might need to introduce additional feedback processes in our simulations.
There are some observational hints from observations on this point already. Using the [C ii] stacked data of galaxies in the ALPINE survey, Ginolfi et al. 2019 reported a detection of outflows with a velocity of . They also showed that higher-SFR galaxies have more extended [C ii] profiles. Our simulations show that high-SFR galaxies are embedded in massive haloes. Therefore we expect that more massive haloes have more extended [C ii] profiles. We will examine how star formation and feedback models affect [C ii] profiles of high- galaxies in our future work, and will compare with above observations further.
4 Discussion
4.1 Impact of Star Formation and SN Feedback Models
Physical properties of the first galaxies and their UV/IR continuum fluxes can sensitively depend on the models of star formation and SN feedback (Wise & Cen 2009; Maio et al. 2011; Johnson et al. 2013; Hopkins et al. 2014; Kimm & Cen 2014; Paardekooper et al. 2015; Yajima et al. 2015; Yajima et al. 2017; Behrens et al. 2018; Ma et al. 2019; Arata et al. 2019, e.g.,). In this subsection, we study the impact of star formation and feedback models on metal emission lines.
Figure 16 compares the [O iii] and [C ii] luminosities from different sub-grid models. In the low-SF run, the central gas density becomes higher than in the fiducial case, which results in inefficient SN feedback due to rapid cooling of injected energy (Yajima et al. 2017). The dense gas also induces rapid hydrogen recombination, resulting in the shrinkage of H ii regions. Therefore, the [O iii] luminosity becomes smaller by a factor of than in the fiducial case at . Conversely, [C ii] luminosity in the low-SF case is higher than that of fiducial case due to efficient H i cloud formation. Using an analytical model based on the Kennicutt–Schmidt relation, Ferrara et al. 2019 showed that a high- coefficient could explain the lower [C ii] luminosity of high- galaxies than local ones, because high at a specific induces a high ionization degree of ISM. Our simulation is consistent with their results.
The central density and SFR in the no-SN model are similar to the fiducial run during the star-burst phases (Yajima et al. 2017, see Fig. 3 in), resulting in similar volume fraction of H ii regions, and the –SFR relations in the two models are very close. On the other hand, the [C ii] luminosity is higher by a factor of few than that of fiducial case, because carbon enrichment has proceeded earlier (see Fig. 10). Due to these effects the changes significantly depending on the star formation and feedback models (bottom panel). Only the fiducial case reproduces the observed negative correlation between the luminosity ratio and SFR.
Figure 17 shows the [C ii] radial profiles for different models at . In the fiducial case, the SN feedback destroys H i clouds in the extended disk, which leads to the concentrated structure. On the other hand, as described above, the other models can have many [C ii]-bright clumps even at the outer halo. We find that the half-light radius significantly extends in low-SF and no-SN cases. Therefore resolving [C ii] distribution of individual galaxy would be a key to constrain theoretical models.
5 Summary
Combining zoom-in cosmological hydrodynamic simulations and radiative transfer calculations, we have investigated the radiative properties of galaxies at focusing on the [O iii] 88 and [C ii] 158 emission lines. We use 12 haloes whose masses are (Halo-11 and MHalo-0, 1, 2, 3) and (Halo-12 and LHalo-0, 1, 2, 3, 4, 5) at . Our major findings are as follows:
- 1.
The metal line luminosities rapidly change with intermittent star formation histories due to SN feedback and gas accretion. The [O iii] line is emitted only during the star-burst phases because O2+ ions exist in H ii regions formed by massive stars, while the [C ii] line is continuously emitted from neutral gas even during the outflowing phases (Fig. 4). We show that, in the case of haloes of , the [O iii] luminosity changes between at .
- 2.
We find that is linearly proportional to (Fig. 6). The relation is very close to that of local metal-poor galaxies (De Looze et al. 2014). Meanwhile, the – relation is steeper (slope of ) than that of local ones () (Fig. 7). We provide fitting formulae for these relations in § 3.4. The [O iii] surface brightness is with very compact and high-density regions at . The comparison of size and surface brightness of [O iii] regions with observations can help to constrain physical model of feedback from massive stars.
- 3.
In our samples, line luminosity ratio decreases from to with increasing bolometric luminosity () and metallicity (), which is in good agreement with local and high- observations (Fig. 9). We find that abundance ratio is initially dominated by the oxygen enrichment of Type-II SNe, and decreases from to due to carbon-rich wind from AGB stars. Thus, the ratio decreases with galaxy evolution and metal enrichment. We provide fitting formula for the relation between and metallicity, which could be used to constrain the metallicity of high- galaxies in the future from the line ratio.
- 4.
The luminosity ratio of our samples weakly correlates with with the slope of , and the negative trend is consistent with high- observations. We find that the relation depends on the escape fraction of UV photons. In the case of low-mass galaxies, most of UV photons can escape without dust absorption. Therefore, the conversion fraction from UV to IR radiation via dust absorption increases with the galaxy mass. This results in making the – relation steeper (slope of ). On the other hand, we see a positive correlation in the – relation, which is inconsistent with observations (Fig. 13). We argue that this inconsistency might be alleviated using a more detailed dust model.
- 5.
To clarify the impact of sub-grid models of star formation and SN feedback on our results, we examine simulations with lower star formation efficiency (lowSF) and without supernova feedback (noSN). We find that, in the lowSF case, H ii regions are not as much extended due to high-density gas and rapid recombination, which results in lower and higher than in the fiducial case by order unity. In the noSN case, the density structure is similar to that of the fiducial case, resulting in similar [O iii] luminosities. However, the galaxies in the noSN model experience rapid metal enrichment by Type-II SNe and AGB stars and have high carbon abundances. Therefore the [C ii] luminosity is higher than in the fiducial run. We find that only the fiducial runs reproduce the observed negative correlation between and .
Acknowledgments
We thank the referee for the constructive comments. We are grateful to Dr. Inoue for helpful comments on model calculations, and to Dr. Fujimoto for useful discussions on ALMA PSF. Numerical computations were carried out on the Cray XC30 & XC50 at the Center for Computational Astrophysics, National Astronomical Observatory of Japan, and the OCTOPUS at the Cybermedia Center, Osaka University as part of the HPCI system Research Project (hp180063, hp190050). This work is supported in part by the MEXT/JSPS KAKENHI Grant Number JP17H04827, 18H04570, 20H04724 (H.Y.) and JP17H01111, 19H05810 (K.N.), and NAOJ ALMA Scientific Research Grant Number 2019-11A. KN acknowledges the travel support from the Kavli IPMU, World Premier Research Center Initiative (WPI), where part of this work was conducted. Data availability: Data available on request.
References
- Aggarwal & Keenan (1999) Aggarwal K. M., Keenan F. P., 1999, ApJS, 123, 311
- Altay et al. (2011) Altay G., Theuns T., Schaye J., Crighton N. H. M., Dalla Vecchia C., 2011, ApJ, 737, L37
- Arata et al. (2018) Arata S., Yajima H., Nagamine K., 2018, MNRAS, 475, 4252
- Arata et al. (2019) Arata S., Yajima H., Nagamine K., Li Y., Khochfar S., 2019, MNRAS, 488, 2629
- Asplund et al. (2009) Asplund M., Grevesse N., Sauval A. J., Scott P., 2009, ARA&A, 47, 481
- Bakx et al. (2020) Bakx T. J. L. C., Tamura Y., Hashimoto T., Inoue A. K., Lee M. M., Mawatari K., Ota K., Umehata H., Zackrisson E., Hatsukade B., Kohno K., Matsuda Y., Matsuo H., Okamoto T., Shibuya T., Shimizu I., Taniguchi Y., Yoshida N., 2020, MNRAS, 493, 4294
- Behrens et al. (2018) Behrens C., Pallottini A., Ferrara A., Gallerani S., Vallini L., 2018, MNRAS, 477, 552
- Behroozi et al. (2013) Behroozi P. S., Wechsler R. H., Conroy C., 2013, ApJ, 770, 57
- Berg et al. (2019) Berg D. A., Erb D. K., Henry R. B. C., Skillman E. D., McQuinn K. B. W., 2019, arXiv e-prints
- Bird et al. (2013) Bird S., Vogelsberger M., Sijacki D., Zaldarriaga M., Springel V., Hernquist L., 2013, MNRAS, 429, 3341
- Bowler et al. (2018) Bowler R. A. A., Bourne N., Dunlop J. S., McLure R. M., McLeod D. J., 2018, ArXiv e-prints
- Brauher et al. (2008) Brauher J. R., Dale D. A., Helou G., 2008, ApJS, 178, 280
- Brocklehurst (1971) Brocklehurst M., 1971, MNRAS, 153, 471
- Burke & Silk (1974) Burke J. R., Silk J., 1974, ApJ, 190, 1
- Capak et al. (2015) Capak P. L., Carilli C., Jones G., Casey C. M., Riechers D., Sheth K., Carollo C. M., Ilbert O., Karim A., Lefevre O., Lilly S., Scoville N., Smolcic V., Yan L., 2015, Nature, 522, 455
- Carniani et al. (2017) Carniani S., Maiolino R., Pallottini A., Vallini L., Pentericci L., Ferrara A., Castellano M., Vanzella E., Grazian A., Gallerani S., Santini P., Wagg J., Fontana A., 2017, A&A, 605, A42
- Carniani et al. (2018) Carniani S., Maiolino R., Smit R., Amorín R., 2018, ApJ, 854, L7
- Chabrier (2003) Chabrier G., 2003, PASP, 115, 763
- Cormier et al. (2012) Cormier D., Lebouteiller V., Madden S. C., Abel N., Hony S., Galliano F., Baes M., Barlow M. J. e. a., 2012, A&A, 548, A20
- Cormier et al. (2015) Cormier D., Madden S. C., Lebouteiller V., Abel N., Hony S., Galliano F., Rémy-Ruyer A., Bigiel F. e. a., 2015, A&A, 578, A53
- Crawford et al. (1985) Crawford M. K., Genzel R., Townes C. H., Watson D. M., 1985, ApJ, 291, 755
- Croxall et al. (2017) Croxall K. V., Smith J. D., Pellegrini E., Groves B., Bolatto A., Herrera-Camus R., Sand strom K. M., Draine B., Wolfire M. G., Armus L., Boquien M., Brandl B., Dale D., Galametz M., Hunt L., Kennicutt R. J., Kreckel K., Rigopoulou D., van der Werf P., Wilson C., 2017, The Astrophysical Journal, 845, 96
- Cullen et al. (2017) Cullen F., McLure R. J., Khochfar S., Dunlop J. S., Dalla Vecchia C., 2017, MNRAS, 470, 3006
- da Cunha et al. (2013) da Cunha E., Groves B., Walter F., Decarli R., Weiss A., Bertoldi F., Carilli C., Daddi E., Elbaz D., Ivison R., Maiolino R., Riechers D., Rix H.-W., Sargent M., Smail I., 2013, ApJ, 766, 13
- Dalla Vecchia & Schaye (2012) Dalla Vecchia C., Schaye J., 2012, MNRAS, 426, 140
- Davis et al. (2014) Davis A. J., Khochfar S., Dalla Vecchia C., 2014, MNRAS, 443, 985
- De Looze et al. (2014) De Looze I., Cormier D., Lebouteiller V., Madden S., Baes M., Bendo G. J., Boquien M., et al. B., 2014, A&A, 568, A62
- Decarli et al. (2017) Decarli R., Walter F., Venemans B. P., Bañados E., Bertoldi F., Carilli C., Fan X., Farina E. P., Mazzucchelli C., Riechers D., Rix H. W., Strauss M. A., Wang R., Yang Y., 2017, Nature, 545, 457
- Dekel & Birnboim (2006) Dekel A., Birnboim Y., 2006, MNRAS, 368, 2
- Díaz-Santos et al. (2017) Díaz-Santos T., Armus L., Charmandaris V., Lu N., Stierwalt S., Stacey G., Malhotra S., van der Werf P. P., Howell J. H., Privon G. C., Mazzarella J. M., Goldsmith P. F., Murphy E. J., Barcos-Muñoz L., Linden S. T., Inami H., Larson K. L., Evans A. S., Appleton P., Iwasawa K., Lord S., Sanders D. B., Surace J. A., 2017, ApJ, 846, 32
- Díaz-Santos et al. (2014) Díaz-Santos T., Armus L., Charmandaris V., Stacey G., Murphy E. J., Haan S., Stierwalt S., Malhotra S. e. a., 2014, The Astrophysical Journal, 788, L17
- Díaz-Santos et al. (2013) Díaz-Santos T., Armus L., Charmandaris V., Stierwalt S., Murphy E. J., Haan S., Inami H., Malhotra S., Meijerink R., Stacey G., Petric A. O., Evans A. S., Veilleux S., van der Werf P. P., Lord S., Lu N., Howell J. H., Appleton P., Mazzarella J. M., Surace J. A., Xu C. K., Schulz B., Sanders D. B., Bridge C., Chan B. H. P., Frayer D. T., Iwasawa K., Melbourne J., Sturm E., 2013, ApJ, 774, 68
- Draine et al. (2007) Draine B. T., Dale D. A., Bendo G., Gordon K. D., Smith J. D. T., Armus L., Engelbracht C. W., Helou G., Kennicutt Jr. R. C., Li A., Roussel H., Walter F., Calzetti D., Moustakas J., Murphy E. J., Rieke G. H., Bot C., Hollenbach D. J., Sheth K., Teplitz H. I., 2007, ApJ, 663, 866
- Farrah et al. (2013) Farrah D., Lebouteiller V., Spoon H. W. W., Bernard-Salas J., Pearson C., Rigopoulou D., Smith H. A., González-Alfonso E., Clements D. L., Efstathiou A., Cormier D., Afonso J., Petty S. M., Harris K., Hurley P., Borys C., Verma A., Cooray A., Salvatelli V., 2013, ApJ, 776, 38
- Ferkinhoff et al. (2010) Ferkinhoff C., Hailey-Dunsheath S., Nikola T., Parshley S. C., Stacey G. J., Benford D. J., Staguhn J. G., 2010, ApJ, 714, L147
- Ferland et al. (1998) Ferland G. J., Korista K. T., Verner D. A., Ferguson J. W., Kingdon J. B., Verner E. M., 1998, PASP, 110, 761
- Ferrara et al. (2019) Ferrara A., Vallini L., Pallottini A., Gallerani S., Carniani S., Kohandel M., Decataldo D., Behrens C., 2019, MNRAS, 489, 1
- Fujimoto et al. (2019) Fujimoto S., Ouchi M., Ferrara A., Pallottini A., Ivison R. J., Behrens C., Gallerani S., Arata S. e. a., 2019, arXiv e-prints, arXiv:1902.06760
- Genel et al. (2015) Genel S., Fall S. M., Hernquist L., Vogelsberger M., Snyder G. F., Rodriguez-Gomez V., Sijacki D., Springel V., 2015, ApJ, 804, L40
- Genzel et al. (2010) Genzel R., Tacconi L. J., Gracia-Carpio J., Sternberg A., Cooper M. C., Shapiro K., Bolatto A., Bouché N. et al., 2010, MNRAS, 407, 2091
- Ginolfi et al. (2019) Ginolfi M., Jones G. C., Bethermin M., Fudamoto Y., Loiacono F., Fujimoto S., Fevre L., Faisst A., Schaerer D., Cassata P., Silverman J. D., Yan L., Capak P., Bardelli S., Boquien M., Carraro R., Dessauges-Zavadsky M., Giavalisco M., Gruppioni C., Ibar E., Khusanova Y., Lemaux B. C., Maiolino R., Narayanan D., Oesch P., Pozzi F., Rodighiero G., Talia M., Toft S., Vallini L., Vergani D., Zamorani G., 2019, arXiv e-prints, arXiv:1910.04770
- Glover & Jappsen (2007) Glover S. C. O., Jappsen A. K., 2007, ApJ, 666, 1
- Goldsmith et al. (2012) Goldsmith P. F., Langer W. D., Pineda J. L., Velusamy T., 2012, ApJS, 203, 13
- Graciá-Carpio et al. (2011) Graciá-Carpio J., Sturm E., Hailey-Dunsheath S., Fischer J., Contursi A., Poglitsch A., Genzel R., González-Alfonso E., Sternberg A., Verma A., Christopher N., Davies R., Feuchtgruber H., de Jong J. A., Lutz D., Tacconi L. J., 2011, ApJ, 728, L7
- Haardt & Madau (2012) Haardt F., Madau P., 2012, ApJ, 746, 125
- Hahn & Abel (2011) Hahn O., Abel T., 2011, MNRAS, 415, 2101
- Harikane et al. (2019) Harikane Y., Ouchi M., Inoue A. K., Matsuoka Y., Tamura Y., Bakx T., Fujimoto S., Moriwaki K., Ono Y., Nagao T., Tadaki K.-i., Kojima T., Shibuya T., Egami E., Ferrara A., Gallerani S., Hashimoto T., Kohno K., Matsuda Y., Matsuo H., Pallottini A., Sugahara Y., Vallini L., 2019, arXiv e-prints, arXiv:1910.10927
- Harikane et al. (2020) —, 2020, ApJ, 896, 93
- Hashimoto et al. (2019) Hashimoto T., Inoue A. K., Mawatari K., Tamura Y., Matsuo H., Furusawa H., Harikane Y., Shibuya T., Knudsen K. K., Kohno K., Ono Y., Zackrisson E., Okamoto T., Kashikawa N., Oesch P. A., Ouchi M., Ota K., Shimizu I., Taniguchi Y., Umehata H., Watson D., 2019, PASJ, 71, 71
- Hashimoto et al. (2018) Hashimoto T., Laporte N., Mawatari K., Ellis R. S., Inoue A. K., Zackrisson E., Roberts-Borsani G., Zheng W. et al., 2018, Nature, 557, 392
- Herrera-Camus et al. (2018a) Herrera-Camus R., Sturm E., Graciá-Carpio J., Lutz D., Contursi A., Veilleux S., Fischer J., González-Alfonso E. e. a., 2018a, The Astrophysical Journal, 861, 94
- Herrera-Camus et al. (2018b) —, 2018b, The Astrophysical Journal, 861, 95
- Hopkins et al. (2014) Hopkins P. F., Kereš D., Oñorbe J., Faucher-Giguère C.-A., Quataert E., Murray N., Bullock J. S., 2014, MNRAS, 445, 581
- Howell et al. (2010) Howell J. H., Armus L., Mazzarella J. M., Evans A. S., Surace J. A., Sanders D. B., Petric A., Appleton P., Bothun G., Bridge C., Chan B. H. P., Charmandaris V., Frayer D. T., Haan S., Inami H., Kim D.-C., Lord S., Madore B. F., Melbourne J., Schulz B., U V., Vavilkin T., Veilleux S., Xu K., 2010, ApJ, 715, 572
- Inoue (2011) Inoue A. K., 2011, MNRAS, 415, 2920
- Inoue et al. (2014) Inoue A. K., Shimizu I., Tamura Y., Matsuo H., Okamoto T., Yoshida N., 2014, ApJ, 780, L18
- Inoue et al. (2016) Inoue A. K., Tamura Y., Matsuo H., Mawatari K., Shimizu I., Shibuya T., Ota K., Yoshida N. et al., 2016, Science, 352, 1559
- Ivison et al. (2010) Ivison R. J., Swinbank A. M., Swinyard B., Smail I., Pearson C. P., Rigopoulou D., Polehampton E., Baluteau J. P. e. a., 2010, A&A, 518, L35
- Johnson et al. (2013) Johnson J. L., Dalla Vecchia C., Khochfar S., 2013, MNRAS, 428, 1857
- Katz et al. (2019) Katz H., Galligan T. P., Kimm T., Rosdahl J., Haehnelt M. G., Blaizot J., Devriendt J., Slyz A., Laporte N., Ellis R., 2019, MNRAS, 487, 5902
- Katz et al. (2018) Katz H., Kimm T., Haehnelt M., Sijacki D., Rosdahl J., Blaizot J., 2018, MNRAS, 478, 4986
- Kennicutt (1998) Kennicutt Jr. R. C., 1998, ARA&A, 36, 189
- Kim et al. (2016) Kim J.-h., Agertz O., Teyssier R., Butler M. J., Ceverino D., Choi J.-H., Feldmann R., Keller B. W., Lupi A., Quinn T., Revaz Y., Wallace S., Gnedin N. Y., Leitner S. N., Shen S., Smith B. D., Thompson R., Turk M. J., Abel T., Arraki K. S., Benincasa S. M., Chakrabarti S., DeGraf C., Dekel A., Goldbaum N. J., Hopkins P. F., Hummels C. B., Klypin A., Li H., Madau P., Mandelker N., Mayer L., Nagamine K., Nickerson S., O’Shea B. W., Primack J. R., Roca-Fàbrega S., Semenov V., Shimizu I., Simpson C. M., Todoroki K., Wadsley J. W., Wise J. H., AGORA Collaboration, 2016, ApJ, 833, 202
- Kimm & Cen (2014) Kimm T., Cen R., 2014, ApJ, 788, 121
- Kimm et al. (2017) Kimm T., Katz H., Haehnelt M., Rosdahl J., Devriendt J., Slyz A., 2017, MNRAS, 466, 4826
- Knudsen et al. (2017) Knudsen K. K., Watson D., Frayer D., Christensen L., Gallazzi A., Michałowski M. J., Richard J., Zavala J., 2017, MNRAS, 466, 138
- Kohandel et al. (2019) Kohandel M., Pallottini A., Ferrara A., Zanella A., Behrens C., Carniani S., Gallerani S., Vallini L., 2019, MNRAS, 487, 3007
- Lagache et al. (2018) Lagache G., Cousin M., Chatzikos M., 2018, A&A, 609, A130
- Laporte et al. (2017) Laporte N., Ellis R. S., Boone F., Bauer F. E., Quénard D., Roberts-Borsani G. W., Pelló R., Pérez-Fournon I., Streblyanska A., 2017, ApJ, 837, L21
- Laporte et al. (2019) Laporte N., Katz H., Ellis R. S., Lagache G., Bauer F. E., Boone F., Inoue A. K., Hashimoto T. e. a., 2019, MNRAS, 487, L81
- Leitherer et al. (1999) Leitherer C., Schaerer D., Goldader J. D., Delgado R. M. G., Robert C., Kune D. F., de Mello D. F., Devost D., Heckman T. M., 1999, ApJS, 123, 3
- Li et al. (2008) Li Y., Hopkins P. F., Hernquist L., Finkbeiner D. P., Cox T. J., Springel V., Jiang L., Fan X., Yoshida N., 2008, ApJ, 678, 41
- Luhman et al. (2003) Luhman M. L., Satyapal S., Fischer J., Wolfire M. G., Sturm E., Dudley C. C., Lutz D., Genzel R., 2003, ApJ, 594, 758
- Ma et al. (2019) Ma X., Hayward C. C., Casey C. M., Hopkins P. F., Quataert E., Liang L., Faucher-Giguère C.-A., Feldmann R., Kereš D., 2019, arXiv e-prints
- Madden et al. (2013) Madden S. C., Rémy-Ruyer A., Galametz M., Cormier D., Lebouteiller V., Galliano F., Hony S., Bendo G. J. e. a., 2013, PASP, 125, 600
- Maio et al. (2011) Maio U., Khochfar S., Johnson J. L., Ciardi B., 2011, MNRAS, 414, 1145
- Maiolino et al. (2004) Maiolino R., Schneider R., Oliva E., Bianchi S., Ferrara A., Mannucci F., Pedani M., Roca Sogorb M., 2004, Nature, 431, 533
- Marigo (2001) Marigo P., 2001, A&A, 370, 194
- Marrone et al. (2018) Marrone D. P., Spilker J. S., Hayward C. C., Vieira J. D., Aravena M., Ashby M. L. N., Bayliss M. B., Béthermin M. et al., 2018, Nature, 553, 51
- Mashian et al. (2013) Mashian N., Sternberg A., Loeb A., 2013, MNRAS, 435, 2407
- Matthee et al. (2019) Matthee J., Sobral D., Boogaard L. A., Röttgering H., Vallini L., Ferrara A., Paulino-Afonso A., Boone F., Schaerer D., Mobasher B., 2019, ApJ, 881, 124
- Mo et al. (1998) Mo H. J., Mao S., White S. D. M., 1998, MNRAS, 295, 319
- Moriwaki et al. (2018) Moriwaki K., Yoshida N., Shimizu I., Harikane Y., Matsuda Y., Matsuo H., Hashimoto T., Inoue A. K., Tamura Y., Nagao T., 2018, MNRAS, 481, L84
- Muñoz & Oh (2016) Muñoz J. A., Oh S. P., 2016, MNRAS, 463, 2085
- Muratov et al. (2015) Muratov A. L., Kereš D., Faucher-Giguère C.-A., Hopkins P. F., Quataert E., Murray N., 2015, MNRAS, 454, 2691
- Murray et al. (2011) Murray N., Ménard B., Thompson T. A., 2011, ApJ, 735, 66
- Nagamine et al. (2010) Nagamine K., Choi J.-H., Yajima H., 2010, ApJ, 725, L219
- Nagamine et al. (2006) Nagamine K., Wolfe A. M., Hernquist L., 2006, ApJ, 647, 60
- Nahar (1999) Nahar S. N., 1999, ApJS, 120, 131
- Nahar & Pradhan (1997) Nahar S. N., Pradhan A. K., 1997, ApJS, 111, 339
- Narayanan & Krumholz (2017) Narayanan D., Krumholz M. R., 2017, MNRAS, 467, 50
- Neri et al. (2014) Neri R., Downes D., Cox P., Walter F., 2014, A&A, 562, A35
- Nussbaumer & Storey (1981) Nussbaumer H., Storey P. J., 1981, A&A, 99, 177
- Olsen et al. (2017) Olsen K., Greve T. R., Narayanan D., Thompson R., Davé R., Niebla Rios L., Stawinski S., 2017, ApJ, 846, 105
- Ota et al. (2014) Ota K., Walter F., Ohta K., Hatsukade B., Carilli C. L., da Cunha E., González-López J., Decarli R., Hodge J. A., Nagai H., Egami E., Jiang L., Iye M., Kashikawa N., Riechers D. A., Bertoldi F., Cox P., Neri R., Weiss A., 2014, ApJ, 792, 34
- Paardekooper et al. (2013) Paardekooper J.-P., Khochfar S., Dalla Vecchia C., 2013, MNRAS, 429, L94
- Paardekooper et al. (2015) —, 2015, MNRAS, 451, 2544
- Pallottini et al. (2017a) Pallottini A., Ferrara A., Bovino S., Vallini L., Gallerani S., Maiolino R., Salvadori S., 2017a, MNRAS, 471, 4128
- Pallottini et al. (2019) Pallottini A., Ferrara A., Decataldo D., Gallerani S., Vallini L., Carniani S., Behrens C., Kohandel M., Salvadori S., 2019, MNRAS, 487, 1689
- Pallottini et al. (2017b) Pallottini A., Ferrara A., Gallerani S., Vallini L., Maiolino R., Salvadori S., 2017b, MNRAS, 465, 2540
- Parkin et al. (2013) Parkin T. J., Wilson C. D., Schirm M. R. P., Baes M., Boquien M., Boselli A., Cooray A., Cormier D., Foyle K., Karczewski O. Ł., Lebouteiller V., De Looze I., Madden S. C., Roussel H., Sauvage M., Spinoglio L., 2013, ApJ, 776, 65
- Pizzati et al. (2020) Pizzati E., Ferrara A., Pallottini A., Gallerani S., Vallini L., Decataldo D., Fujimoto S., 2020, MNRAS, 495, 160
- Portinari et al. (1998) Portinari L., Chiosi C., Bressan A., 1998, A&A, 334, 505
- Rahmati et al. (2013) Rahmati A., Pawlik A. H., Raičević M., Schaye J., 2013, MNRAS, 430, 2427
- Reynolds et al. (1997) Reynolds C. S., Ward M. J., Fabian A. C., Celotti A., 1997, MNRAS, 291, 403
- Richings et al. (2014) Richings A. J., Schaye J., Oppenheimer B. D., 2014, MNRAS, 440, 3349
- Rybak et al. (2019) Rybak M., Calistro Rivera G., Hodge J. A., Smail I., Walter F., van der Werf P., da Cunha E., Chen C.-C. e. a., 2019, The Astrophysical Journal, 876, 112
- Saitoh (2017) Saitoh T. R., 2017, AJ, 153, 85
- Sargsyan et al. (2012) Sargsyan L., Lebouteiller V., Weedman D., Spoon H., Bernard-Salas J., Engels D., Stacey G., Houck J., Barry D., Miles J., Samsonyan A., 2012, ApJ, 755, 171
- Schaye & Dalla Vecchia (2008) Schaye J., Dalla Vecchia C., 2008, MNRAS, 383, 1210
- Schaye et al. (2010) Schaye J., Dalla Vecchia C., Booth C. M., Wiersma R. P. C., Theuns T., Haas M. R., Bertone S., Duffy A. R., McCarthy I. G., van de Voort F., 2010, MNRAS, 402, 1536
- Seon et al. (2011) Seon K.-I., Edelstein J., Korpela E., Witt A., Min K.-W., Han W., Shinn J., Kim I.-J. e. a., 2011, ApJS, 196, 15
- Smit et al. (2018) Smit R., Bouwens R. J., Carniani S., Oesch P. A., Labbé I., Illingworth G. D., van der Werf P., Bradley L. D., Gonzalez V., Hodge J. A., Holwerda B. W., Maiolino R., Zheng W., 2018, Nature, 553, 178
- Springel (2005) Springel V., 2005, MNRAS, 364, 1105
- Stacey et al. (1991a) Stacey G. J., Geis N., Genzel R., Lugten J. B., Poglitsch A., Sternberg A., Townes C. H., 1991a, ApJ, 373, 423
- Stacey et al. (1991b) Stacey G. J., Townes C. H., Poglitsch A., Madden S. C., Jackson J. M., Herrmann F., Genzel R., Geis N., 1991b, ApJ, 382, L37
- Steidel et al. (2016) Steidel C. C., Strom A. L., Pettini M., Rudie G. C., Reddy N. A., Trainor R. F., 2016, ApJ, 826, 159
- Tacconi et al. (2013) Tacconi L. J., Neri R., Genzel R., Combes F., Bolatto A., Cooper M. C., Wuyts S., Bournaud F. et al., 2013, ApJ, 768, 74
- Tamura et al. (2019) Tamura Y., Mawatari K., Hashimoto T., Inoue A. K., Zackrisson E., Christensen L., Binggeli C., Matsuda Y. e. a., 2019, ApJ, 874, 27
- Teyssier (2002) Teyssier R., 2002, A&A, 385, 337
- Todini & Ferrara (2001) Todini P., Ferrara A., 2001, MNRAS, 325, 726
- Vallini et al. (2015) Vallini L., Gallerani S., Ferrara A., Pallottini A., Yue B., 2015, ApJ, 813, 36
- Valtchanov et al. (2011) Valtchanov I., Virdee J., Ivison R. J., Swinyard B., van der Werf P., Rigopoulou D., da Cunha E., Lupu R. e. a., 2011, MNRAS, 415, 3473
- van der Tak et al. (2007) van der Tak F. F. S., Black J. H., Schöier F. L., Jansen D. J., van Dishoeck E. F., 2007, A&A, 468, 627
- Verner et al. (1996) Verner D. A., Ferland G. J., Korista K. T., Yakovlev D. G., 1996, ApJ, 465, 487
- Vishwas et al. (2018) Vishwas A., Ferkinhoff C., Nikola T., Parshley S. C., Schoenwald J. P., Stacey G. J., Higdon S. J. U., Higdon J. L., Weiss A., Güsten R., Menten K. M., 2018, ApJ, 856, 174
- Watson et al. (2015) Watson D., Christensen L., Knudsen K. K., Richard J., Gallazzi A., Michałowski M. J., 2015, Nature, 519, 327
- Webber (1998) Webber W. R., 1998, The Astrophysical Journal, 506, 329
- Weingartner & Draine (2001) Weingartner J. C., Draine B. T., 2001, ApJ, 548, 296
- Wiersma et al. (2009a) Wiersma R. P. C., Schaye J., Smith B. D., 2009a, MNRAS, 393, 99
- Wiersma et al. (2009b) Wiersma R. P. C., Schaye J., Theuns T., Dalla Vecchia C., Tornatore L., 2009b, MNRAS, 399, 574
- Willott et al. (2015) Willott C. J., Carilli C. L., Wagg J., Wang R., 2015, ApJ, 807, 180
- Wise & Cen (2009) Wise J. H., Cen R., 2009, ApJ, 693, 984
- Wolfire et al. (2003) Wolfire M. G., McKee C. F., Hollenbach D., Tielens A. G. G. M., 2003, ApJ, 587, 278
- Wolfire et al. (1990) Wolfire M. G., Tielens A. G. G. M., Hollenbach D., 1990, ApJ, 358, 116
- Yajima et al. (2011) Yajima H., Choi J.-H., Nagamine K., 2011, MNRAS, 412, 411
- Yajima et al. (2012a) —, 2012a, MNRAS, 427, 2889
- Yajima et al. (2012b) Yajima H., Li Y., Zhu Q., Abel T., 2012b, Monthly Notices of the Royal Astronomical Society, 424, 884
- Yajima et al. (2015) —, 2015, ApJ, 801, 52
- Yajima et al. (2014) Yajima H., Li Y., Zhu Q., Abel T., Gronwall C., Ciardullo R., 2014, MNRAS, 440, 776
- Yajima et al. (2017) Yajima H., Nagamine K., Zhu Q., Khochfar S., Dalla Vecchia C., 2017, ApJ, 846, 30
Appendix A Comparison with Cloudy
We compare [O iii] 88 luminosity in our model with that of Cloudy model (Ferland et al. 1998; Inoue 2011; Inoue et al. 2014, e.g.). The Cloudy table gives us luminosity ratio of [O iii] 88 to H lines as a function of density (), ionization parameter (, where is flux of hydrogen ionizing photons), and metallicity (), which is based on radiative transfer calculations assuming plane-parallel geometry and pressure equilibrium. The range of parameter are , and . The input stellar spectrum is produced by the Starburst99 with Salpeter IMF [], constant star formation for , and the same stellar metallicity with gaseous component (Inoue et al. 2014). The Cloudy table uses the solar elemental abundance ratio. We use the values of in each cell, which are the result of ionization RT calculation by Art2 code, and refer to the Cloudy table for [O iii] emissivity ().
To obtain [O iii] emissivity in our model (), we divide by H luminosity, , where is the effective recombination coefficient (Brocklehurst 1971) and () is the proton (electron) density in the cell. We note that the attenuation by dust grains does not affect significantly because the dust column density in the central regions of our galaxies is corresponding to the optically-thin regime for the line. Although the Cloudy table takes the attenuation effect into account, it does not contribute to significantly in the range of our input parameters.
Figure 18 shows the ratio of to as a function of metallicity. For most of the cells, is almost unity, which implies that our simple emission model is in good agreement with Cloudy. Total [O iii] luminosity is dominated by the contribution from cells with (). Here we focus on the origin of the differences between our model calculation and Cloudy. There are two-types of outliers at : low- cells () and high-density cells (). In the former case, Cloudy predicts that weak radiation field ionizes the surface of plane-parallel gas (), and [O iii] is emitted only from the thin layer. Meanwhile, if the electron fraction of a cell is higher than , our model calculates optically-thin oxygen ionization equilibrium in the whole cell volume and obtains O2+ abundance, which would overestimate [O iii] emissivity. In the later case (indicated by yellow points in Fig. 18), the emissivity in Cloudy rapidly decreases with increasing density, because the density exceeds the critical density for transition of . Meanwhile, our model predicts that the critical density is higher by a factor of ( at ), thus the emissivity increases with density. The difference probably comes from referred collision strength (Aggarwal & Keenan 1999).
As described above, Cloudy uses input spectrum assuming a simple stellar population. However, the actual SED would be the sum of various stellar populations with different ages and metallicities, which could be more complex. Our model calculates O2+ abundance under the complex SEDs, and the oxygen enrichment by SNe and AGB stars is tracked by particles separately. Thus, we argue that, at least for the SED treatment, our model is doing a more appropriate treatment for estimating [O iii] emission in high- galaxies.

Appendix B The CMB effect
Here we estimate the CMB effect onto [C ii] luminosity (Goldsmith et al. 2012, e.g.). The population of two energy levels is determined by the rate equation:
| (9) |
where is number density of C+ ions in the upper (lower) level, and is the mean intensity of background radiation at 158 . We assume an escape probability of , and a black-body spectra . The term is sum of collision rate with electrons (), hydrogen atoms () and hydrogen molecules () (Glover & Jappsen 2007). The and are related to each other by detailed balance. The emergent luminosity is calculated by Equation (4). In diffuse ISM, the stimulated absorption rate () is higher than stimulated emission rate (), thus the CMB increases ratio and reduces [C ii] luminosity.
Figure 19 shows how much [C ii] emission is attenuated by CMB at . For a low temperature gas (), the CMB effect becomes significant compared to collisional excitation, resulting in a reduction of luminosity (Lagache et al. 2018, see also,). At , the densities of and dramatically change due to hydrogen recombination, thus the collision partner for C+ ions switches. If gas density is higher than the critical density of the collision partner, the rate equation is dominated by the collision terms, and as a result, the CMB effect becomes negligible. Note that gas temperature in our simulations is higher than (Fig. 3), thus the CMB affects [C ii] luminosity only by a few percent.
Additionally, note that the CMB at also reduces the detectability due to obscuring the line signal by the background noise (da Cunha et al. 2013; Kohandel et al. 2019). We do not consider this effect, because we focus on the intrinsic luminosity of high- galaxies. However, it could be important when comparing the line profiles in detail between simulations and observations. We will take this effect into account in a future paper.
