(W)hole new field: the new GEM Time Projection Chamber of ALICE
Abstract
The ALICE Time Projection Chamber has just been upgraded by replacing the readout chambers, which cover the two ends of the cylinder, with new detectors based on the Gas Electron Multiplier (GEM) technology. We report here on the related activities at GSI Darmstadt: GEM framing and chamber production, as well as the quality assurance accompanying both procedures.
1 Introduction
The ALICE Time Projection Chamber (TPC) (Fig. 1)

is the world’s largest detector of its kind [1]. It served as the main central tracking and particle-identification detector of ALICE from 2009 till now (see Refs. [2] and [3] for the description of the experiment and its performance). Its upgrade is an essential part of the experiment’s preparation for the LHC Run 3 starting in 2021, when the machine will deliver Pb–Pb collisions at a rate of 50 kHz [4, 5].
The principle of operation of the ALICE TPC as used in Runs 1 and 2 is as follows. The TPC is filled with Ne-CO2-N (90-10-5). Charged particles traversing its drift volume ionize gas atoms. An electric field of 400 V/cm makes the ionization electrons drift towards the readout chambers (Fig. 2) in which the charges are amplified and produce measurable signals. The nominal gas amplification factor is 7000–8000. The ions produced during the amplification slowly drift towards the cathode and, if not stopped, would result in a space charge within the active volume. The space charge would affect the electron drift in the subsequent events. In order to avoid this, a dedicated wire plane (gating grid) is located at the boundary between the drift volume and the readout chambers. About 100 s after every trigger, after the last ionization electrons have arrived to the readout chambers but before the first ions reach the drift volume, the gating grid is made opaque by applying alternating voltages to its wires. The gating grid is kept closed for 180 s. This method solves the problem of ion backflow, at the expense of introducing a significant deadtime limiting the trigger rate to about 3 kHz.

The ongoing upgrade of the CERN accelerators will allow for Pb–Pb collision rates of 50 kHz from 2021 on. In order to fully make use of this, the readout chambers of the ALICE TPC have just been replaced by chambers of similar geometry but without the gating grid. Also the cathode and anode wire planes have been removed, the gas amplification is now performed sequentially in four layers of GEMs. Most of the ions are thus produced at the last GEM layer, and their way to the drift volume is made difficult by the presence of the first three GEM foils. With 8 potentials to tweak and with a somewhat reduced total gain factor, configurations can be found that result in an acceptable ion backflow (1%) while preserving the energy resolution (12% for 5.9 keV x-rays). The parameters of wire and GEM chambers are compared in Table 1. After eliminating the gating grid and the related dead time, the plan is to run the upgraded TPC in a continuous – rather then triggered – readout mode, thus recording all Pb–Pb interactions offered by the LHC.
| \br | wire chamber | GEM chamber | |
|---|---|---|---|
| grid open | grid closed | ||
| \mrgain | 8000 | 0 | 2000 |
| ion backflow | 0.13 | 0.01 | |
| \br | |||
2 GEM-chamber production
The ALICE TPC Upgrade collaboration consists of teams from 52 institutions. The chamber production was highly decentralized (Fig. 3).

The GSI team joined the detector building activities in 2015, getting involved in GEM framing as well as assembly and tests of OROCs. The relevant steps of the production scheme are described below.
A basic test of a GEM, as performed in particular before and after every transport, consisted in measuring its dark current. For this, a dry GEM (a few days spent at a relative humidity 1%) was placed in a plexiglass box equipped with spring-loaded pin contacts, and flushed with nitrogen (Fig. 4). A voltage of 500 V was applied to all segments (20–24, depending on GEM size) and the respective currents were monitored.

Typically, the currents stabilized at a level of 10–50 pA, depending on the hole pitch of a GEM. The currents of individual segments within a GEM normally agreed within 10%. An excessive current of a segment meant a shorted GEM. Increased current (see example in Fig. 5)

may come from a defect/contamination and was considered a potential danger. Shorted and contaminated GEMs had a fair chance of recovery when sent back to their production site for recleaning.
An advanced quality assurance procedure, performed once for each GEM, consisted in a long-term (at least 5 hours) dark-current measurement and an optical survey. During the latter, microscope photographs were taken of the entire GEM. The pictures were stitched together and analyzed for defects and hole-size nonuniformities (Fig. 6).

The gain of a single GEM appeared to be clearly anticorrelated with the diameter of the holes. This correlation, however, was practically lost in a stack of four GEMs.
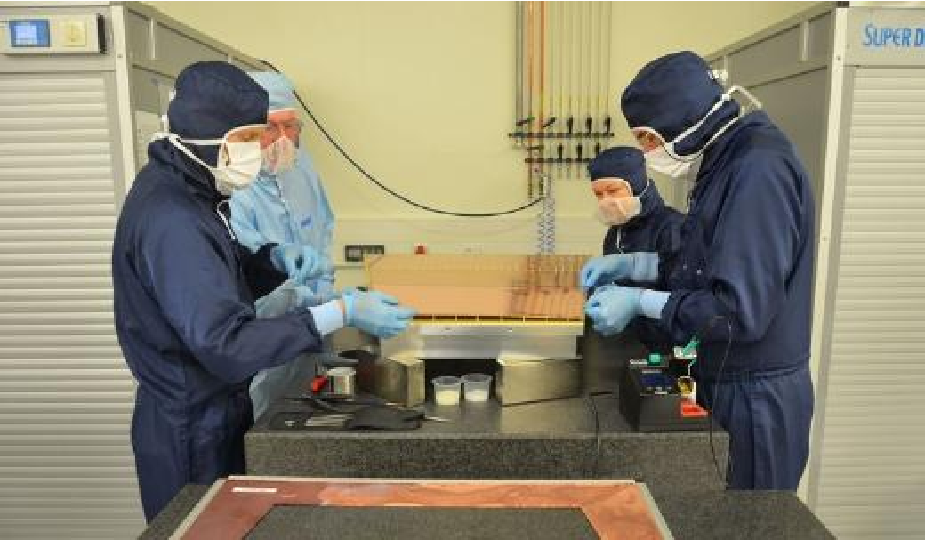
Framing a GEM consisted in stretching it and positioning 0.5 mm above a rigid frame made of G11 with a thin layer of epoxy glue on it. After a careful alignment (Fig. 7),

the GEM foil was pressed to the frame and covered with a plexiglass hood. The box was flushed with nitrogen and left overnight.
The complete information about the 923 GEM foils of the project was stored in a dedicated database. With an intuitive user interface and numerous analysis macros, the database was a valuable tool in steering and monitoring the production process.
The OROC chamber assembly consisted in adding three stacks of 4 GEMs each to the chamber bodies (Figs. 8, 9). The bodies were equipped with pad planes and connection wires bringing HV into the chambers and the signals out of it. The GEMs were attached to them with densely spaced nylon bolts (Fig. 8),

ensuring a reasonable level of tension. The GEMs were trimmed to trapezoidal shape and mounted one by one. The HV connections were soldered to both sides of each GEM. As anticipated, the size, shape, and precise location of the soldering points were of high importance for the HV stability of the chambers.
3 GEM-chamber quality assurance
The chambers were subject to several tests at the assembly site. For this, they were enclosed in a test box filled with the nominal gas mixture, with a low-mass entrance windows and a 13 mm drift gap with 400 V/cm before the first GEM. The gain of the chamber, for each of the three GEM stacks separately, was measured by irradiating it with 5.9 keV x-rays from a 55Fe source. The photons that reach the drift gap ionize gas atoms, producing on average a primary charge of 166 electrons. The absolute gain factor is calculated by dividing the pad current by the x-ray rate (measured using a scaler) and the primary charge. An example of the obtained gain curves is shown in Fig. 10.

The charge induced on the pads is proportional to the primary ionization and thus to the energy deposited by the traversing charged particle. The energy resolution is checked by recording the 55Fe x-ray spectrum and fitting the 5.9 keV peak (Fig. 11).

The test is performed at a voltage corresponding to a gain of 2000. The relative width of the peak, calculated taking into account the position and the width of the pedestal, was typically around 12-14%, usually slightly above the limit of 12%. As the energy resolution and the ion backflow can be traded against each other by changing the GEM voltages, and as we notoriously observed an ion backflow significantly better than the limit, the poor values of the energy resolution were not considered to be a problem.
The gain homogeneity was evaluated by shifting a collimated x-ray tube over the chamber surface and monitoring the anode current (sum of all pads). This test was performed with the three stacks kept at a voltage corresponding to a gain of 2000. An example of the resulting current map is shown in Fig. 12.

The ion backflow (IBF) measurement is performed in parallel with the gain uniformity test. For this purpose, the cathode current is recorded along with the pad one. The cathode current is caused by ions traversing the drift volume and reaching the cathode. The IBF factor is calculated as the ratio between the cathode and the pad currents. An example map is shown in Fig. 13.

The stability of each chamber was checked by illuminating it semi-uniformly with two strong x-ray tubes. The level of irradiation was such that the pad current was 10 nA/cm2 and the test duration was 6 hours. The pad and cathode currents were monitored. After the test, the health of all GEMs was checked by measuring their dark currents.
Upon completion of the tests, each chamber was enclosed in its transportation box. The gas tightness was checked and the boxes were flushed with nitrogen. After the last check of the GEM integrity, performed by applying 250 V to each GEM and measuring its dark current, the chambers were shipped to CERN.
4 GEM chamber installation
In the beginning of 2019, the ALICE TPC was extracted and brought to a dedicated cleanroom on the surface. The replacement of the chambers started in April and was completed in September. Installation of a chamber requires inserting it into the TPC, turning, and pressing from inside against the backplate (Fig. 14). The removal of wire chambers and the installation of GEM chambers each proceeded at a pace of two sectors per day. Replacing all 72 chambers took six months.

5 Concluding remarks
The involvement of the GSI group in the construction of the GEM chambers for the ALICE TPC upgrade started in 2015 with planning, ordering equipment, and defining procedures. The peak production took place in 2017–2018. With the new GEM technology and large detector sizes, the production encountered several surprises and some procedures had to be adjusted correspondingly. In all production steps, strong emphasis was put on quality assurance.
The works were performed in the GSI detector laboratory. It was a privilege and pleasure to use its excellent infrastructure. Our hosts, the detlab colleagues, were welcoming and helped to quickly overcome some of the encountered problems. We appreciate their purely science- and curiosity-driven motivation and gratefully acknowledge their contribution to our project.
By the end of 2019, the time of submission of these proceedings, the chambers have been installed in the TPC, and the TPC commissioning has just started. We are all looking forward to seeing the upgraded TPC performing beautifully in the coming LHC Run 3.
References
References
- [1] Alme J et al 2010 The ALICE TPC, a large 3-dimensional tracking device with fast readout for ultra-high multiplicity events Nucl. Instrum. Meth. A622 316-367
- [2] Aamodt K et al. [ALICE Collaboration] 2008 The ALICE experiment at the CERN LHC JINST 3 S08002
- [3] Abelev B et al. [ALICE Collaboration] 2014 Performance of the ALICE Experiment at the CERN LHC Int. J. Mod. Phys. A 29 1430044
- [4] ALICE Collaboration 2013 Upgrade of the ALICE Time Projection Chamber CERN-LHCC-2013-020, ALICE-TDR-016
- [5] ALICE Collaboration 2015 Addendum to the Technical Design Report for the Upgrade of the ALICE Time Projection Chamber CERN-LHCC-2015-002, ALICE-TDR-016-ADD-1