Visualizing structural balance in signed networks
Abstract
Network visualization has established as a key complement to network analysis since the large variety of existing network layouts are able to graphically highlight different properties of networks. However, signed networks, i.e., networks whose edges are labeled as friendly (positive) or antagonistic (negative), are target of few of such layouts and none, to our knowledge, is able to show structural balance, i.e., the tendency of cycles towards including an even number of negative edges, which is a well-known theory for studying friction and polarization.
In this work we present Structural-balance-viz: a novel visualization method showing whether a connected signed network is balanced or not and, in the latter case, how close the network is to be balanced. Structural-balance-viz exploits spectral computations of the signed Laplacian matrix to place network’s nodes in a Cartesian coordinate system resembling a balance (a scale). Moreover, it uses edge coloring and bundling to distinguish positive and negative interactions. The proposed visualization method has characteristics desirable in a variety of network analysis tasks: Structural-balance-viz is able to provide indications of balance/polarization of the whole network and of each node, to identify two factions of nodes on the basis of their polarization, and to show their cumulative characteristics. Moreover, the layout is reproducible and easy to compare. Structural-balance-viz is validated over synthetic-generated networks and applied to a real-world dataset about political debates confirming that it is able to provide meaningful interpretations.
Keywords:
network visualization, signed networks, structural balance, spectral theory1 Introduction
balanced unbalanced
Signed networks are simple yet informative network representations in which edges are annotated as positive or negative harary1953notion. They are applied in a large variety of domains in which interactions between entities are either friendly or antagonistic, e.g., international relations doreian2015structural, and online social media and social networks tang2016survey. The theory of structural balance has established as the standard for studying, from a theoretical standpoint in sociology and psychology, the formation of opinions in both individuals and social groups. Structural balance is widely applied to signed networks, e.g., for the analysis of social media leskovec2010signed, and the study of opinion separation xia2015structural. A signed network has been proved to be structurally balanced or balanced if and only if all cycles are balanced, i.e., include an even number of negative edges cartwright1956structural. As a consequence, network’s nodes can be assigned to two different sets such that we find only positive ties between nodes in the same set and all negative ones between nodes of different sets easley2010positive. Figure 1 shows two simple examples of balanced and unbalanced networks. The network on the left is balanced and has the two properties discussed above, i.e., all cycles are balanced and a clustering can be found in agreement to all edges’ signs. On the other hand, the network on the right is not balanced: there are unbalanced cycles (e.g., the one composed by the node sequence ) and there are edges disagreeing with the clustering (e.g., edge ). Even if a balanced network represents the most natural configuration, structural balance is not necessarily a “positive” configuration, e.g., it is observed in the alliance network between European nations just before World War I redner2006social. Moreover, most of the large real-world networks are expected to be unbalanced since a single unbalanced cycle makes the whole network unbalanced. Therefore, it has also been shown the importance of measuring to what extent an unbalanced signed network is close to be balanced kunegis2010spectral. Structural balance is also linked with group polarization, i.e., the division of a group of entities (e.g., nodes of a network) into two subgroups each reaching consensus and having opposite opinions bonchi2019discovering.
Network visualization has emerged as a key complement to standard network analysis techniques to fill the gap between computation and interpretation, communicate findings, and deepen insight krzywinski2011hive. A large variety of network layouts exists in literature kaufmann2003drawing and, also, implemented for visualization applications, as, e.g., Gephi and Cytoscape. Surprisingly, little attention has been paid to the visualization of signed networks kunegis2010spectral and, to our knowledge, none of the existing layouts highlights structural balance properties of signed networks.
In this work we tackle the task of identifying, through a visualization, whether a connected signed network is balanced or unbalanced and, in the latter case, how much the network is unbalanced. The proposed visualization method, Structural-balance-viz, places nodes in a Cartesian coordinate system exploiting spectral properties of the signed Laplacian matrix. Edges are colored and bundled to make positive and negative signs distinguishable and to ease the understanding of the global balance/polarization of the network. At a glance, it is possible to catch if a network is balanced: no positive edges cross the -axis and no negative edges have both endpoints in the same quadrant, namely, the -axis finds a partition of the nodes as explained in easley2010positive. The visual perception of the portion of edges “disagreeing” with the partitioning, i.e., the fraction of positive edges crossing the -axis and negative edges internal to a quadrant, gives an indication of the level of balance of a network. Moreover, we utilize the -axis as a scale to show cumulative characteristics of the sets of nodes identified by the -axis, and include a textual indication of the level of balance of the network under analysis in order to improve the comparability between different visualizations.
The layout produced by Structural-balance-viz has the following characteristics that are useful in a variety of network analysis tasks: it shows whether the input network is balanced or not and, in the second case, how close the network is to be balanced; by nodes’ -coordinate, it provides an indication of the contribute to the balance structure of the network and, also, of the individual balance/polarization of each node (such information might be exploited, e.g., for the task of finding non-polarized representatives ordozgoiti2019reconciliation); it identifies two factions of nodes on the basis of their polarization which finds applications in clustering problems, e.g., 2-correlation-clustering coleman2008local; aref2018computing; the scale represented by the -axis shows cumulative characteristics of the identified factions, e.g., size or internal clustering coefficient; and, the resulting visualization are reproducible (desirable feature but not common to all network layouts, e.g., force based) and easy to compare in terms of balance structure. We verify such characteristics by running Structural-balance-viz on synthetic networks and a real-world dataset representing political debates.
2 Related work
Structural balance and signed networks. The concept of structural balance first appears as psychological theory of balance in triangles of sentiments. Signed networks are later introduced in the seminal work by Harary harary1953notion, who also generalizes the balance theory to signed networks cartwright1956structural. Harary and Kabell develop a simple algorithm to test whether a given signed network is balanced harary1980simple by enumerating the cycles in the network containing an even number of negative edges. A complete signed network is balanced if and only if all its triangles are balanced easley2010positive. Akiyama et al. akiyama1981balancing study how to estimate the minimum number of sign changes required so that a signed network satisfies the balance property. Recent works link spectral properties of signed networks to the balance theory. Hou et al. hou2003laplacian prove that a signed network is balanced if and only if the smallest eigenvalue of the signed Laplacian is 0. Moreover, hou2005bounds investigates the relationship between the smallest eigenvalue of the signed Laplacian and the level of balance of a signed network.
A fundamental problem studied in signed networks is correlation clustering bansal2004correlation, i.e., partition the nodes into clusters so as to maximize (minimize) the number of edges that “agree” (“disagree”) with the partitioning. The 2-correlation-clustering problem coleman2008local, also known as the frustration-index problem aref2018computing, is also widely studied. Finally, a more recent line of work introduces the problem of discovering antagonistic communities in signed networks bonchi2019discovering.
Network visualization. Many network visualizations have been proposed in literature in order to graphically express specific characteristics, properties, and patterns of networks. Force-based visualizations map an energy function to the desired layout and minimize it kaufmann2003drawing. Hive plots krzywinski2011hive place nodes on radially oriented linear axes according to a coordinate system defined by nodes characteristics and/or network properties. Eigenvectors are exploited for visualizing networks in different works. In particular, kunegis2010spectral studies the application of clustering, prediction, and visualization methods to signed networks by using the signed Laplacian and its eigenvalue decomposition. Despite using eigenvectors to place nodes in a Cartesian coordinate system, the visualization algorithm of kunegis2010spectral has different purposes and strongly differs from ours: it wants to highlight clustering properties and not structural balance; it does not provide information about the contribute of each node to the balance/polarization structure; it does not cluster nodes into two factions and, therefore, it cannot show factions’ cumulative properties; and, the resulting layouts are hardly comparable between each other.
3 Visualizing structural balance
In this section we describe the details of Structural-balance-viz, the proposed visualization method whose main objective is to show whether a connected signed network is balanced or unbalanced and, in the latter case, how much the network is unbalanced.
First, we provide preliminary notations and definitions. We denote a signed undirected network as , where is a set of nodes, is a set of positive edges, and is a set of negative edges. In this work, we require to be connected. Let be the signed adjacency matrix of , i.e., for each pair of nodes , if , if , otherwise. Let also be the signed degree matrix of , where represents the signed degree, i.e., the number of neighbors disregarding the sign, of a node . Finally, we define the signed Laplacian matrix of as:
We now describe our algorithm for visualizing structural balance in signed networks, which is outlined as Algorithm 1. As mentioned beforehand, Structural-balance-viz makes use of the signed Laplacian of the input network . In fact, it starts by computing the signed Laplacian together with its smallest eigenvalue and the corresponding eigenvector (Line 1). At this point, we already have all the information required for the visualization handy. At first, we identify the coordinates of the nodes in and store them in and (cycle starting at Line 1). The -coordinate of each node is directly obtained by the element of corresponding to . Since more than a node might have the same abscissa and we want to avoid nodes to overlap, the -coordinates are computed in order to distribute nodes having the same -coordinate vertically. Next (Lines 1 - 1), edges are divided into four sets since, on the basis of the coordinates of their endpoints and of their sign, different layouts are applied:
- •
contains the positive edges having two endpoint with the same -coordinate;
- •
contains the negative edges having two endpoint with the same -coordinate;
- •
contains the positive edges having two endpoint with different -coordinate;
- •
contains the negative edges having two endpoint with different -coordinate.
Structural-balance-viz is then ready to draw the visualization (Lines 1 - 1). At first, the Cartesian axes and the nodes are positioned. Then, the edges are drawn exploiting coloring and bundling to highlight their sign. In particular, positive edges are depicted in blue, while negative edges in red. A positive edge is bundled towards the top of the visualization, if , or externally, if ; while a negative edge is bundled towards the bottom, if , or internally, if .
In order to improve the informativeness of our layout, we include two additional features in Structural-balance-viz (from Line 1): one wants to provide information about the two sets of nodes identified by the -axis, while the latter has the aim of making different visualizations more comparable.
Any eigenvector of the signed Laplacian can be used to derive a partition of network’s nodes into two sets on the basis of the sign of the corresponding elements in . Such partitioning is at the basis of spectral-clustering methods coleman2008spectral and it can identify polarized structures, i.e., two sets of nodes showing high internal consensus and warring between each other bonchi2019discovering. In the proposed visualization, the two sets are identified by the nodes in the left and in the right quadrants, i.e., and computed at Line 1 of Structural-balance-viz, respectively. In practical applications, it is often of interest to know (and visualize) network measures of the two polarized sets, e.g., size, internal clustering coefficient, internal density of positive edges, ratio of positive edges, etc. We provide a simple visual expedient based on the angular coefficient of the -axis that resembles the behavior of a scale. Let be the network measure of interest. Note that is an optional input parameter of Structural-balance-viz and the lines corresponding to this additional feature are executed if is actually provided in input. We define the angular coefficient of the -axis as
The work enclosed in hou2003laplacian; hou2005bounds proves theoretical bounds on the smallest eigenvalue of the Laplacian of a signed network and investigates its relationship with respect to the level of balance in the network. It is shown that a connected signed network is structurally balanced if and only if , i.e., the smallest eigenvalue of the Laplacian is zero, and that the higher , the lower the level of balance of the network is. Therefore, is the simplest indicator to take into account for comparing structural balance in different networks (of equal densities). More complex indicators of balance could also be employed aref2017measuring. Ideally, the -coordinate where the -axis crosses the -axis would be a simple manner to graphically show . Unfortunately, we devoted consistent effort to visualize such information in this way, but all attempts worsened the clarity of the layout (e.g., cut off edges). To this extent, we include in Structural-balance-viz a label reporting the value of on the top of the -axis and leave the visualization of without the label as future work.
The time complexity of Structural-balance-viz is governed by the time required by the eigenvalue decomposition of , while the space complexity is , again imposed by . Note that computational-intensive network measures might considerably extend the running time when drawing large networks.
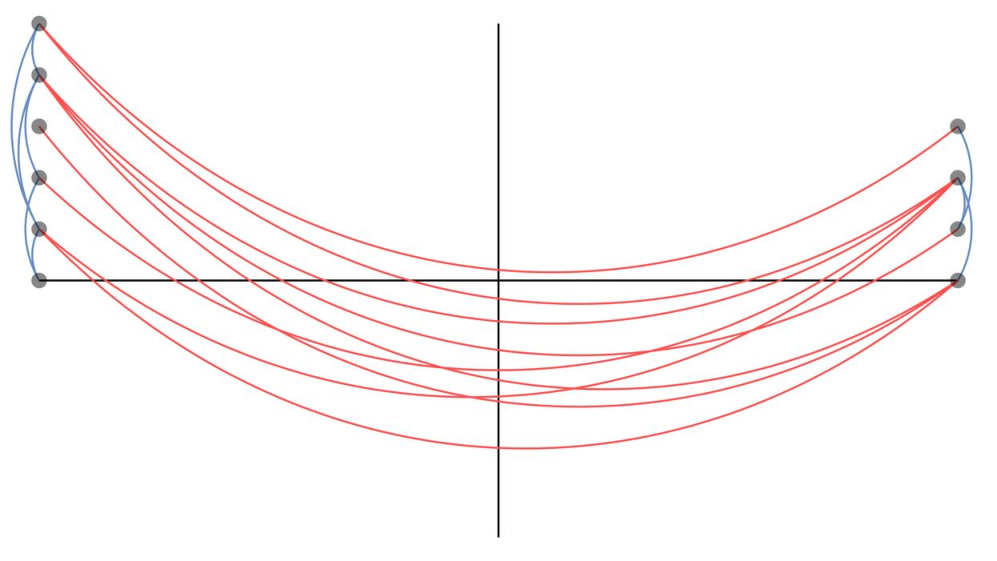

Figures 2 and 3 show two examples of visualizations generated by Structural-balance-viz for a balanced and an unbalanced network, respectively. For such visualizations, we remove the label reporting to prove how obvious the difference between the two networks is even without textual information. Also, as for all other examples in this paper, edge bundling is not applied; however, it will be available in the tools we plan to publicly release. It is immediate to note that the network represented in Figure 2 is balanced: all the nodes are at the extremes of the -axis and no blue (red) edge crosses the -axis (lays in the same quadrant). This configuration highlights the fact that all the cycles of the represented network are balanced. On the other hand, Figure 3 shows an unbalanced network since there are positive edges in-between the two factions of nodes and a negative edge within two nodes in the left quadrant; therefore, we easily find the presence of unbalanced cycles.

Figure 4 shows the same network of Figure 3 with both the additional features of Structural-balance-viz; in this case, the -axis scale compares the size of the two factions of nodes, i.e., counts the number of nodes in the sets. At a glance, it is possible to understand that the left faction is slightly larger than the right one (six and four nodes, respectively) and that the smallest eigenvalue of the signed Laplacian is not far from zero; this means that the network is not far from being balanced (i.e., there are not many unbalanced cycles).
4 Validation and application
In this section we validate the proposed network layout by visualizing synthetic networks. Also, we apply Structural-balance-viz to derive concrete insights from a dataset representing political debates.
We develop Structural-balance-viz by using D3.js with a Java back-end. The visualization is made available by a web interface that allows the selection of the input dataset and of (i.e., the network measure that defines the angular coefficient of the -axis)11 1 Code available at github.com/egalimberti/balance_visualization.. The current implementation can consider only the size of the sets of nodes as , but the code is easily extendable to consider other characteristics. The time required by our implementation to produce each visualization has always been less than a few seconds.


Validation: synthetic networks
We first focus our attention on synthetic-generated networks with the aim of proving that the visualizations produced by Structural-balance-viz are easily comparable. The generative process for signed networks we follow requires in input three parameters: indicates the number of nodes, defines the edge density, while is the ratio of unbalanced triangles in the network (which is another indicator of how much a network is balanced easley2010positive). The procedure works as follows:
- •
generate a complete balanced network of nodes (this can be achieved by partitioning the nodes into two and by assigning negative sign to the edges connecting nodes in different sets while positive sign to all others edges);
- •
randomly remove edges that do not disconnect the network until the edge density is less or equal than ;
- •
randomly change signs of edges appearing in balanced triangles until the ratio of unbalanced triangles is less or equal than .
In Figure 5 we report our visualization for six networks generated by the described procedure by progressively increasing () while keeping and fixed (, ). Therefore, we have the full range of networks in terms of structural balance: on one extreme () the network is perfectly balanced, on the other () the network has no balanced triangles. When , as expected, we obtain the perfectly distinguishable configuration of balanced networks, where all nodes are in either extremes of the -axis, no positive edge crosses the -axis, and no negative edge entirely lies in the same quadrant. Note that, for the balanced case, we do not provide in input to Structural-balance-viz any network function since the number of nodes in the sets can be inferred by the height of the two stacks. As grows, the most of the nodes gradually moves from the extreme ordinates to the center of the plot; nonetheless, even for , we note a few highly-polarized nodes at the margins of the horizontal domain. In addition, more and more both positive edges cross the -axis and negative edges are within one of the two quadrants. The additional features result to be extremely useful in these cases. At first, the scale gives a precise indication that the right faction is larger than the left one for all values of . Also, the smallest eigenvalue of the signed Laplancian, which grows coherently with , eases the comparison of visualizations that might appear similar (e.g., and ) and provides a definitive indication about the structural balance of the visualized networks.
A case study: the United States Congress network
Next, we apply Structural-balance-viz to the analysis of a real-world network obtained from data of the United States Congress modeling a political debate22 2 Dataset available at konect.cc.. Nodes () are politicians speaking in the Congress, edges () denote that a speaker mentions another speaker, while signs report whether mentions are in support (positive) or opposition (negative).


Figure 6 shows the visualization of the original Congress network. It is easy to notice that the members are divided into two (almost) equally-sized factions that are close to be balanced; in fact, there is only one negative edge within the left faction and a relatively few positive edges crossing the -axis. The -axis can be seen as the left-right political spectrum: the most of the politicians are quite moderate, while there are some polarized members especially in the right, and a few nodes close to (probably the mediators between the two factions).
To have a better understanding of the structural balance of the the Congress network, we compare it to a null model. In particular, we maintain the same network structure while reshuffling the edge signs, leaving the number of positive and negative edges unchanged. The visualization of the resulting reshuffled network is reported in Figure 7. In this case, the balance/polarization structure of the network is destroyed since the majority of the nodes collapse close to the origin. All the negative edges (except one) lay between such nodes and are no more visible in the layout. Only five members maintain their polarization in the right. Moreover, the smallest eigenvalue of the signed Laplacian is greater than in the original network. All this indications suggests that, the United States Congress network is more balanced/polarized than what is expected by chance, according to a reshuffled null model. The Congress is instead quite polarized, very close to being structurally balanced, due to the political parties and alliances.
5 Conclusions
In this paper we introduce Structural-balance-viz: a novel algorithm that places nodes in a Cartesian coordinate system, that resembles the behavior of a scale, and exploits edge coloring and bundling for showing whether a connected signed network is balance or unbalanced and, in the latter case, how far it is from being balanced. Structural-balance-viz is validated by the analysis of synthetic networks: it is proved to provide an indication of balance/polarization of the whole network and individually of each node, to identify two factions of nodes on the basis of their polarization and show their cumulative characteristics, and to produce reproducible and easily comparable visualizations. An application to a real-world dataset about political debates confirms that Structural-balance-viz can provide meaningful insights about the polarization structure of the network.
As future work, we plan to devote more effort in embedding the value of the smallest eigenvalue of the signed Laplacian in Structural-balance-viz without textual supplement. Moreover, we want to deploy our implementation, including edge bundling, to a public web interface and make it available for network visualization tools, e.g., Cytoscape. Finally, we will employ Structural-balance-viz for future analysis of real-world signed networks.
References
- (1) Jin Akiyama, David Avis, Vasek Chvátal, and Hiroshi Era. Balancing signed graphs. Discrete Applied Mathematics, 3(4):227–233, 1981.
- (2) Samin Aref, Andrew J Mason, and Mark C Wilson. Computing the line index of balance using integer programming optimisation. In Optimization Problems in Graph Theory, pages 65–84. Springer, 2018.
- (3) Samin Aref and Mark C Wilson. Measuring partial balance in signed networks. Journal of Complex Networks, 6(4):566–595, 2017.
- (4) Nikhil Bansal, Avrim Blum, and Shuchi Chawla. Correlation clustering. Machine learning, 56(1-3):89–113, 2004.
- (5) Francesco Bonchi, Edoardo Galimberti, Aristides Gionis, Bruno Ordozgoiti, and Giancarlo Ruffo. Discovering polarized communities in signed networks. In Proceedings of the 2019 ACM on Conference on Information and Knowledge Management. ACM, 2019.
- (6) Dorwin Cartwright and Frank Harary. Structural balance: a generalization of heider’s theory. Psychological review, 63(5):277, 1956.
- (7) Tom Coleman, James Saunderson, and Anthony Wirth. A local-search 2-approximation for 2-correlation-clustering. In European Symposium on Algorithms, pages 308–319, 2008.
- (8) Tom Coleman, James Saunderson, and Anthony Wirth. Spectral clustering with inconsistent advice. In Proceedings of the 25th international conference on Machine learning, pages 152–159. ACM, 2008.
- (9) Patrick Doreian and Andrej Mrvar. Structural balance and signed international relations. Journal of Social Structure, 16:1, 2015.
- (10) David Easley and Jon Kleinberg. Positive and negative relationships. Networks, Crowds, and Markets: Reasoning about a Highly Connected World, Cambridge University Press, 2010.
- (11) Frank Harary. On the notion of balance of a signed graph. The Michigan Mathematical Journal, 2(2):143–146, 1953.
- (12) Frank Harary and Jerald A Kabell. A simple algorithm to detect balance in signed graphs. Mathematical Social Sciences, 1(1):131–136, 1980.
- (13) Yao Ping Hou. Bounds for the least Laplacian eigenvalue of a signed graph. Acta Mathematica Sinica, 21(4):955–960, 2005.
- (14) Yaoping Hou, Jiongsheng Li, and Yongliang Pan. On the Laplacian eigenvalues of signed graphs. Linear and Multilinear Algebra, 51(1):21–30, 2003.
- (15) Michael Kaufmann and Dorothea Wagner. Drawing graphs: methods and models, volume 2025. Springer, 2003.
- (16) Martin Krzywinski, Inanc Birol, Steven JM Jones, and Marco A Marra. Hive plots—rational approach to visualizing networks. Briefings in bioinformatics, 13(5):627–644, 2011.
- (17) Jérôme Kunegis, Stephan Schmidt, Andreas Lommatzsch, Jürgen Lerner, Ernesto W De Luca, and Sahin Albayrak. Spectral analysis of signed graphs for clustering, prediction and visualization. In Proceedings of the 2010 SIAM International Conference on Data Mining, pages 559–570. SIAM, 2010.
- (18) Jure Leskovec, Daniel Huttenlocher, and Jon Kleinberg. Signed networks in social media. In Proceedings of the SIGCHI conference on human factors in computing systems, pages 1361–1370. ACM, 2010.
- (19) Bruno Ordozgoiti and Aristides Gionis. Reconciliation k-median: Clustering with non-polarized representatives. In The World Wide Web Conference, pages 1387–1397. ACM, 2019.
- (20) Sidney Redner. Social balance on networks: The dynamics of friendship and hatred. In APS Meeting Abstracts, 2006.
- (21) Jiliang Tang, Yi Chang, Charu Aggarwal, and Huan Liu. A survey of signed network mining in social media. ACM Computing Surveys (CSUR), 49(3):42, 2016.
- (22) Weiguo Xia, Ming Cao, and Karl Henrik Johansson. Structural balance and opinion separation in trust–mistrust social networks. IEEE Transactions on Control of Network Systems, 3(1):46–56, 2015.