Kinetic Proofreading and the Limits of Thermodynamic Uncertainty
Abstract
To mitigate errors induced by the cell’s heterogeneous noisy environment, its main information channels and production networks utilize the kinetic proofreading (KPR) mechanism. Here, we examine two extensively-studied KPR circuits, DNA replication by the T7 DNA polymerase and translation by the E. coli ribosome. Using experimental data, we analyze the performance of these two vital systems in light of the fundamental bounds set by the recently-discovered thermodynamic uncertainty relation (TUR), which places an inherent trade-off between the precision of a desirable output and the amount of energy dissipation required. We show that the DNA polymerase operates close to the TUR lower bound, while the ribosome operates times farther from this bound. This difference originates from the enhanced binding discrimination of the polymerase which allows it to operate effectively as a reduced reaction cycle prioritizing correct product formation. We show that approaching this limit also decouples the thermodynamic uncertainty factor from speed and error, thereby relaxing the accuracy-speed trade-off of the system. Altogether, our results show that operating near this reduced cycle limit not only minimizes thermodynamic uncertainty, but also results in global performance enhancement of KPR circuits.
I Introduction
Fast and accurate processing of molecular information is essential for proper control, growth and regulation in the living cell. In carrying out essential tasks like protein synthesis, ribosomes are known to operate at error levels of incorrect peptide bindings per cycle Edelmann and Gallant 1977; Drummond and D. Wilke 2009; Kramer and Farabaugh 2007, with even lower error rates for polymerases carrying out RNA transcription () Gout et al. 2017; Blank et al. 1986; Traverse and Ochman 2016 and DNA replication () Charles et al. 2015; Schaaper 1993; Drake et al. 1998. This implies that the involved molecular machines must readily discriminate and preferentially bind the correct substrates over very similar, yet incorrect, competing substrates. However, simple energy discriminant binding models imply prohibitive energy binding differences among the pool of analogous substrates, and fail to predict the high level of fidelity observed. Instead, as originally proposed by Hopfield Hopfield 1974 and Ninio Ninio 1975, high accuracy may be achieved through kinetic proofreading (KPR), a mechanism that couples an effectively irreversible process to an intermediate reaction step which can then preferentially react or discard substrates — via kinetic discrimination — further down in the reaction pathway. In this manner, the original discrimination step that relies on binding energy differences is amplified through a second round of substrate verification. This mechanism has been confirmed experimentally for a variety of polymerase and ribosome systems Kunkel and Bebenek 2000; Thompson and Stone 1977; Gromadski and Rodnina 2004, and later recognized in signal transduction Hlavacek et al. 2001; Goldstein et al. 2008 and homologous recombination Sagi et al. 2006.
While KPR facilitates high fidelity synthesis, it imparts a significant energy cost to the overall process. Furthermore, the nanometric scale of these molecular systems renders them vulnerable to strong thermal and active fluctuations from the cellular environment, suggesting performance limits set by fundamental thermodynamic fluctuation-dissipation trade-offs Gnesotto et al. 2018; Brown and Sivak 2019; Jarzynski 2011. Indeed, recent work on generic KPR models linked the amount of energy dissipated to the loss of configurational entropy during accurate product formation, and found that the efficiency of this process decreased rapidly for increasing levels of accuracy Rao and Peliti 2015. More generally, accuracy of the copying process was found to be fundamentally tied by the amount of excess work dissipated by the system, with higher dissipation corresponding to higher accuracy, independent of underlying system topology Sartori and Pigolotti 2015.
In analyzing KPR processes, one typically coarse-grains the full complex biochemical system into a discrete set of states connected by stochastic transitions approximated as a Markov process. However, even under these simplified dynamics, thermodynamics places an inherent energetic cost to the output precision of an observed quantity. This seminal result has been dubbed the thermodynamic uncertainty relation (TUR), which is expressed in terms of the trade-off measure as
| (1) |
where is the temperature, is the Boltzmann constant, is time, is the energy dissipation rate, and is the ratio of mean and variance of a current observable Barato and Seifert 2015a. In short, Eq. 1 implies that a reduction in the uncertainty of an observable must be accompanied by a matching increase in energy consumption. Optimal trade-off is achieved in the the limit of vanishing energy use (i.e., equilibrium) and with normally-distributed heat dissipation Hyeon and Hwang 2017. The TUR was first shown to hold in the limit of linear response, and later proven to hold for any Markov jump process in the short or long time limits Gingrich et al. 2016; Horowitz and Gingrich 2017. More recently, this relation has been shown to follow for currents from a generalized fluctuation theorem framework Hasegawa and Van Vu 2019.
In the context of enzymatic kinetics, the TUR has been used to infer performance boundaries in molecular systems such as motors Barato and Seifert 2015b; Pietzonka et al. 2016a; Seifert 2018. For instance, in a study by Hyeon and Hwang Hwang and Hyeon 2018, the transport efficiency of microtubule protein motors was defined in terms of and analyzed using experimental data, showing that is sub-optimized within physiological ATP fuel levels and cargo loadings. Notably, while the studied wild-type kinesin protein operates near a minimum in , the defective mutant was about three times less efficient and did not display a minimum.
Clearly, the TUR not only places fundamental constraints on system performance, but highlights the degree to which present day molecular systems may have accommodated to this limitation. While extensive kinetic analysis of copying-fidelity or proofreading mechanisms have been advanced in various contexts Tawfik 2014; Murugan et al. 2012; Murugan et al. 2014; Ouldridge et al. 2017; Wong et al. 2018; Tlusty et al. 2004; Bar-Ziv et al. 2002, direct TUR analysis of experimental KPR systems is surprisingly lacking. To this end, we consider a recent work by Banerjee, Kolomeisky and Igoshin Banerjee et al. 2017 on the KPR systems of the E. coli ribosome and the T7 bacteriophage polymerase, and analyze these circuits in the context of TUR. In Banerjee et al. 2017, the reaction networks were adapted to a standard Hopfield-Ninio KPR model using experimental values of the kinetic rate constants. Taking the physiological state as a reference point, they investigated the speed-accuracy trade-off as a function of the kinetic rates, finding that speed is prioritized over error rate. In a follow-up work on the same systems, they found that speed is also prioritized over energy dissipation and output noise Mallory et al. 2019.
In this paper, we offer a complementary view on the existing body of analysis, focusing on the fundamental implications of the TUR on the synthesis process in the KPR networks of E. coli ribosome and T7 DNA polymerase. We show that, in general, decreasing error rates and mean production times coincide with an underlying effective reduced network of reactions steps that minimizes the TUR measure of production. Approaching this reduced network not only provides the best energetic trade-off between production precision and energy dissipation through , but also decouples the operational speed from the dispersion of production. As a result, this regime minimizes trade-off constraints between the mean production time and the error rate for a given set of control parameters and fixed energy budget. Together, we show that approaching the reduced network regime corresponds to enhanced global performance of the studied ribosome and polymerase systems.
II Kinetic Proofreading Circuits
| Parameters | Ribosome WT | Ribosome Acc | Ribosome Err | T7 polymerase |
|---|---|---|---|---|
| 11 1 Value chosen from same experimental limits to ensure positive values of . | ||||

We study the standard Hopfield-Ninio KPR model as adapted to the T7 DNA polymerase and the E.coli ribosome by Banerjee et al. Banerjee et al. 2017, using measured values of the kinetic rate constants. These networks, shown in Figure 1, capture the main steps of nucleotide ligation in the polymerase and peptide elongation in the ribosome.
In particular, these kinetic pathways model the steady-state processive action of the polymerase or ribosome and consist of the following three major steps. For the T7 DNA polymerase, the cycle starts at the polymerase bound to the growing DNA strand in state E where it adds either the correct (R) or incorrect (W) deoxy-NTP molecule to the growing strand and forms the ER/W state. The system can then ligate another dNTP molecule (path p) to restart the cycle or shift the strand to the polymerase exo-site ER*/W* where the dNTP is hydrolized and removed back to state E. Similarly for the ribosome cycle in (b), state E represents the mRNA template bound in the growing ribosome poly-peptide complex. Binding of the cognate (R) or non-cognate (W) aminoacyl-tRNA, EF-TU elongation factor and GTP leads to the second state ER/W. Hydrolysis of the GTP molecule brings the complex to state ER*/W* where the amino-acid can be added to the growing polypeptide strand (link p, green) or discarded (link 3,blue) which restarts the cycle. Note that the main difference in the topology of the cycles is that the KPR and production steps follow the first intermediate ER/W in the polymerase, whereas in the ribosome these occur only following the second hydrolyzed intermediate ER*/W*.
All underlying kinetic rates for these cycles are assumed to be reversible and first order (i.e., measured in units) in constant substrate concentration at physiological conditions. Additionally, we maintain constant chemical potential differences of the underlying chemical reactions in both R and W cycles. This requirement constrains the rates as
| (2) |
where for proofreading cycles () or for production cycle () and chemical potentials are hereafter measured in units. We take the approximate physiological values of the chemical potential differences, for poly-peptide elongation, for nucleotide ligation and for the hydrolysis KPR step in both systems Mallory et al. 2019. For convenience, we also define discrimination factors which relate the R and rate constants as and represent the biased discriminant enzyme behavior when bound to either the right or wrong substrate. These factors are similarly constrained through Eq. 2,
| (3) |
Values for all and are as adapted by Banerjee et al. Banerjee et al. 2017 from experimental sources Zaher and Green 2010; Wong et al. 1991; Donlin et al. 1991; Patel et al. 1991 and listed in Table 1 above.
For the purpose of our thermodynamic uncertainty analysis, we calculate the TUR measure for correct product transitions across the path in the ribosome and polymerase as follows. The relative uncertainty across this production path can be found from the mean transition current and its diffusion constant so that
| (4) |
Using the definition for in Eq.1 and above we thus get
| (5) |
where the energy dissipation is defined in terms of the entropy production rate as
| (6) |
The currents that determine in Eq. 6 are , the production current for both R and W cycles, and , the discarded substrate current from kinetic proofreading (for in polymerase or ribosome). We also calculate the mean production time defined as the average time required to observe one net product addition onto the growing strand. This is given from the production rate as
| (7) |
This definition of time is equivalent to a mean passage time in the limit of irreversible product formation and vanishing incorrect product rate . Similarly, the error is defined as the fraction of incorrect substrate units added onto a growing peptide chain or DNA strand,
| (8) |
where is the current across the link in the wrong W cycle. The values of the currents, and , and the diffusion constant , are calculated using Koza’s steady-state method Koza 1999, as demonstrated extensively in other studies Barato and Seifert 2015a; Mallory et al. 2019; Barato and Seifert 2015b.
In addition to the full reaction networks, it is instructive to consider idealized cycles consisting of only states and paths leading to correct product formation (shown on the right side in Figure 1). These reduced cycles (RC) represent, by construction, perfect performance of the underlying protein systems. The RC circuits allow direct comparison of current-dependent metrics like and between the actual and ideal system. Considering that for the systems studied here, the production current in these idealized cycles is a simplified function of the forward rate constants of the form . One can thus define the forward rate constants in terms of a single control parameter as where are the ratios of the rate constants at physiological values. It follows that current in the idealized circuit is a monotonic function (a power) of that conserves the rate constant proportionality of the original system. The physiological state is matched when . As we later show, operating near the regime of the ideal RC cycles implies minimimal values, and affords enhanced accuracy/speed trade-off performance.
III Results and Discussion
| () | ||
|---|---|---|
| Err Ribosome | 137 | 16 |
| WT Ribosome | 48 | 5.6 |
| Acc Ribosome | 28 | 3.2 |
| T7 Polymerase | 7.1 | 1.3 |

The approach of KPR circuits to the TUR limit.— We begin by reporting the physiological values of for product transitions in the ribosome and polymerase systems as shown in Table 2. Here, the T7 polymerase achieves the lowest value of which is about seven times smaller than the native WT ribosome, with the more accurate mutant Acc closer to the limit than either WT or the less accurate Err. In order to compare these results more meaningfully, however, we must account for the underlying energy cost of cycle operation, which differs between the T7 DNAP and ribosome systems.
This can be achieved by considering the reduced cycles (RCs) consisting of only states and transitions leading to correct product formation as introduced in section II and Figure 1(b). These RCs were extracted from the full network of states and represent an idealized limit where only the correct substrate is processed in the absence of any competing paths. Operating at the RC limit therefore provides the best overall enzyme performance for a fixed energy budget. In particular, the RC limit implies a unicycle regime for which a lower bound for is known to be
| (9) |
where denotes the number of states in the network, and is the overall change in Gibbs free energy of the underlying chemical reactions per cycle (in units) Pietzonka et al. 2016b; Seifert 2018. This hyperbolic lower bound is achieved for a system with uniform forward and backward rate constants and reduces to the minimal value of in the vanishing limit. Thus, the hyperbolic bound is pertinent for far-from-equilibrium driven process such as KPR and represents the best efficiency attainable given an energy input. The ratio of the physiological values of shown in Table 2 are therefore a normalized optimization score, for a specific energetic constraint, of either the polymerase or ribosome systems. Markedly, the polymerase operates close to the TUR limit at , while the ribosomes are times further away, even after accounting for the specific energy cost of the underlying chemical transitions.
One can obtain a deeper appreciation of the score ratios by comparing the full enzymatic cycles to their respective RC limits. To achieve this, we define a collective rate constant which governs the product output current in RC networks, and from which and other performance metrics are calculated as detailed in section II. Consequently, serves as a control parameter that allows for direct performance comparison between actual and idealized RC systems. Figure 2, presents as a function of for both RCs and the full ribosome and polymerase systems. As seen, the ideal current is increasing montonically with , while the actual current is non-monotonic for the ribosome systems and nearly indistinguishable from RC for the T7 polymerase. These results are a first indication that the polymerase is indeed working at virtually reduced network conditions, hence the lower value, while the ribosomes only approach this limit at longer operation times (lower currents).

The proximity of these systems to their lower TUR limits motivates a further examination of the full circuits and their corresponding RC limits. To this end, we consider two operating cases that either reduce or preserve the full reaction network respectively: (a) perfect binding discrimination corresponding to and b) perfect proofreading discrimination corresponding to . In case (a) the full system gradually reduces to the RC limit by entire omission of the branch. In contrast, case (b) preserves the overall system topology while minimizing the impact of incorrect synthesis in the W branch. As shown below, comparing , the error rate and the mean production time for either case allows us to see how the approach to the RC limit governs the performance of the full systems.
Approaching the RC limit decouples the TUR measure from the mean production time .— To allow for normalized comparison of the actual system over its RC cycle, independent of system topology and energetic cost, we define the normalized TUR measure . Figure 3 shows for the WT ribosome against the mean production time , as a function of while (case (a)) or (case (b)) are parametrically varied. As seen in (a) the WT ribosome displays a clear trade-off between and (red line), but quickly attenuates and decouples as it approaches the RC limit (black dashed line). On the other hand, increasing (b) maintains the trade-off constraint between and at all points, even when approaching the RC limit. Similar trends are seen for the polymerase in figure 3 (c) and (d). From these results we find that a system operating near the RC limit may more readily minimize both the product output noise and mean production time without being constrained by a strong trade-off relation.

The error rate decouples from the TUR measure in high fidelity regimes.— Figure 4 shows against the error for decreasing (a) and increasing (b) from the measured physiological values. In both cases, decreases with decreasing and becomes decoupled in the low error regime. However, this asymptotic value of only matches the RC limit in the vanishing case (a) but not in case (b) where the Err mutant stays well above the RC value at the limit. The inset illustrates this asymptotic behavior more clearly where in this case has been rescaled from the physiological values as for the WT ribosome, and shows that the RC limit can be reached for , but not for .
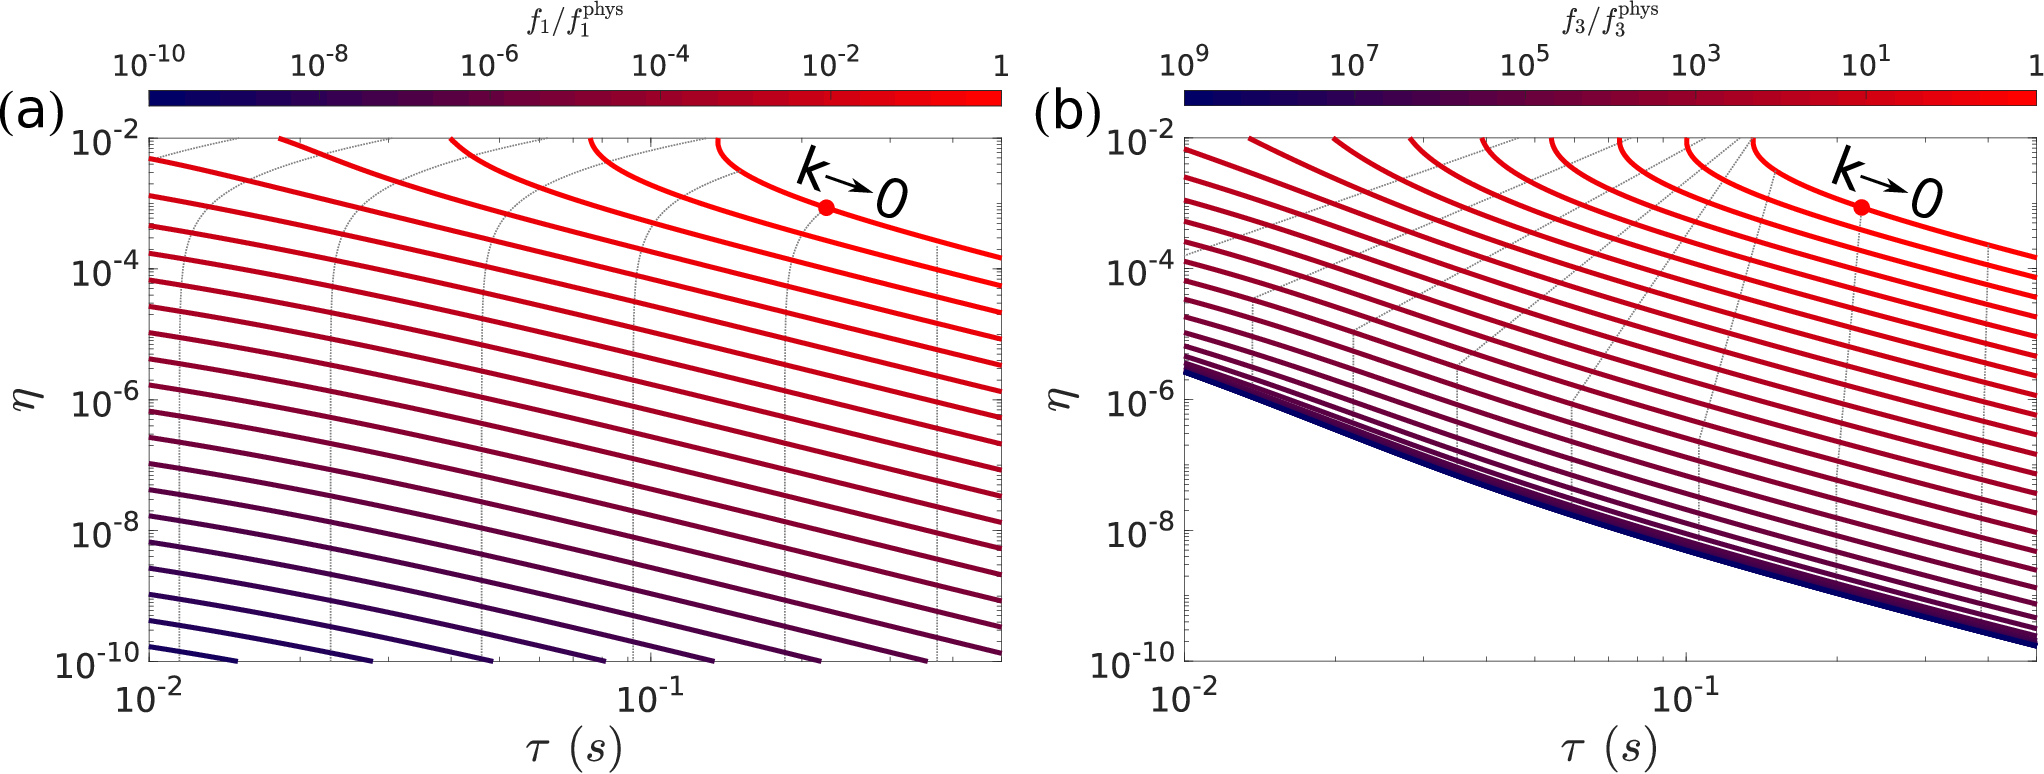
Approaching the RC limit relaxes the trade-off constraint between error rate and mean production time.— It is also instructive to compare the error to the mean production time as a function of in the context of the idealized RC limit (Figure 5). While changing either or parametrically is not expected to decouple the trade-off between measures, these curves highlight improved performance close to the RC limit in addition of minimizing . For instance, while increasing discriminant proofreading naturally improves the accuracy of the system, it ultimately approaches a best trade-off curve for this parameter variation (a Pareto front). In contrast, reducing weakens the trade-off relationship (smaller negative derivatives) while moving these trade-off curves arbitrarily close to the origin by construction (incorrect substrate is never bound).

The energy cost rate for faster speed of operation is minimized in the RC limit.— Lastly, we consider energy dissipation in the limit of the RC cycle. While in general provides an efficiency measure of dissipation and product output precision, it is independent of time and hence agnostic to the cost of driving a cycle up to a required speed of operation. In this regard, Mallory et al. Mallory et al. 2019 have shown that the ribosome and T7 polymerase prioritize speed over dissipation, and is therefore interesting to see how dissipation and mean production time vary between physiological systems and their corresponding RC limits. In particular, we calculate the difference in energy dissipation between the actual systems and their RC limits. Figure 6 shows the normalized dissipation rate difference, , against the mean production time as a parametric function of for ribosomes and the T7 polymerase. The dissipation rate was normalized by the operating energy cost to allow comparison of different reaction networks. Evidently, while the ribosomes display absolute differences lower than the polymerase, they operate more slowly by two orders of magnitude and with steep energy costs for shorter than physiological values. On the other hand, the T7 polymerase maintains a relatively flat profile over many decades, ensuring that the energy dissipation rate does not deviate strongly from the ideal RC values, which achieve minimal by construction.
In closing, by all metrics considered, operating near the the RC limit confers considerable performance advantages to the KPR systems examined. By this measure, it is not surprising the polymerase outperforms the ribosomes given that its binding discrimination factor is about a million times more restrictive than that of the ribosomes () and places it significantly closer to the underlying RC limit. Note that a low score does not imply by itself the RC limit; low values of are achieved for certain limiting values of , and as discussed previously, this does not confer the similar trade-off advantages of approaching the RC limit. For instance, the Acc mutant achieves lower score due to its enhanced , but must operate at slower production times than the WT due to steeply increasing energy demands as seen in Figure 6. As a result, operating near the RC limit not only achieves low score by definition, but also improves the overall global performance per production cycle in a reaction network given a fixed energy budget.
IV Conclusions
The ribosome and the DNA polymerase drive two essential production networks in the cell. The efficiency of these circuits is an important determinant of the organism fitness, and therefore they must be tuned to prioritize product-forming transitions over competing incorrect substrate binding and proofreading cycles. In this work, we have analyzed these circuits in the light of the Thermodynamic Uncertainty Relation (TUR), and found that the TUR measure for the product current is closer to the lower bound in the polymerase than in the E. coli ribosome system. In particular, we considered a reduced cycle (RC) limit that accounts for paths leading to product formation, and showed that operating near this regime affords minimized values of for corresponding rate constants. Notably, the polymerase operates very near the RC regime and thereby achieves nearly-optimal performance manifested by the proximity of its measure to the lower bound (Eq. 9 and Table 2). Further, operating near RC relaxes the trade-off constraint between accuracy and speed, while decoupling both these measures from . On the other hand, a similar analysis showed that E. coli ribosomes operate relatively farther away from the RC limit, resulting in stronger coupling across all performance measures and increased energy costs, manifested by larger values of . That said, the ribosome is not more than one order-of-magnitude away from the TUR bound. The significant difference in the performance of polymerase and ribosome stems from the accuracy of substrate discrimination, which is higher by about six orders of magnitude in the polymerase. This binding selectivity difference, which is not directly addressed here, is linked to the different biochemical mechanisms employed by the polymerase and the ribosome Wong et al. 1991; Gromadski et al. 2006; Savir and Tlusty 2013. As a result, the polymerase is more likely to operate in the regime of correct product cycles than the ribosome, close to the RC limit. The different regimes of performance may also reflect the much more deleterious impact of errors in replication, which are carried through genome heredity, relative to errors in translation that vanish when the protein is degraded. For future studies, it would be interesting to study how distinct reaction pathways in other protein systems, e.g., in signal transduction, adjust to prioritize correct response cycles and whether these imply similar RC limits that optimize the underlying TUR constraint.
Acknowledgements.
The authors thank Anatoly B. Kolomeisky, Oleg A. Igoshin and Changbong Hyeon for helpful discussions. This work was supported by the taxpayers of South Korea through the Institute for Basic Science, Project Code IBS-R020-D1.References
- Edelmann and Gallant (1977) P. Edelmann and J. Gallant, Cell 10, 131 (1977).
- Drummond and D. Wilke (2009) A. Drummond and C. O. D. Wilke, Nature Reviews Genetics 10, 715 (2009).
- Kramer and Farabaugh (2007) E. B. Kramer and P. J. Farabaugh, RNA 13, 87 (2007).
- Gout et al. (2017) J.-F. Gout, W. Li, C. Fritsch, A. Li, S. Haroon, L. Singh, D. Hua, H. Fazelinia, Z. Smith, S. Seeholzer, K. Thomas, M. Lynch, and M. Vermulst, Science Advances 3 (2017), 10.1126/sciadv.1701484.
- Blank et al. (1986) A. Blank, J. A. Gallant, R. R. Burgess, and L. A. Loeb, Biochemistry 25, 5920 (1986).
- Traverse and Ochman (2016) C. C. Traverse and H. Ochman, Proceedings of the National Academy of Sciences 113, 3311 (2016).
- Charles et al. (2015) J. A. S. Charles, S. E. Liberti, J. S. Williams, S. A. Lujan, and T. A. Kunkel, DNA Repair 31, 41 (2015).
- Schaaper (1993) R. M. Schaaper, Journal of Biological Chemistry 268, 23762 (1993).
- Drake et al. (1998) J. W. Drake, B. Charlesworth, D. Charlesworth, and J. F. Crow, Genetics 148, 1667 (1998).
- Hopfield (1974) J. J. Hopfield, Proceedings of the National Academy of Sciences 71, 4135 (1974).
- Ninio (1975) J. Ninio, Biochimie 57, 587 (1975).
- Kunkel and Bebenek (2000) T. A. Kunkel and K. Bebenek, Annual Review of Biochemistry 69, 497 (2000).
- Thompson and Stone (1977) R. C. Thompson and P. J. Stone, Proceedings of the National Academy of Sciences 74, 198 (1977).
- Gromadski and Rodnina (2004) K. B. Gromadski and M. V. Rodnina, Molecular Cell 13, 191 (2004).
- Hlavacek et al. (2001) W. S. Hlavacek, A. Redondo, H. Metzger, C. Wofsy, and B. Goldstein, Proceedings of the National Academy of Sciences 98, 7295 (2001).
- Goldstein et al. (2008) B. Goldstein, D. Coombs, J. R. Faeder, and W. S. Hlavacek, “Kinetic proofreading model,” in Multichain Immune Recognition Receptor Signaling: From Spatiotemporal Organization to Human Disease, edited by A. B. Sigalov (Springer New York, New York, NY, 2008) pp. 82–94.
- Sagi et al. (2006) D. Sagi, T. Tlusty, and J. Stavans, Nucleic Acids Research 34, 5021 (2006).
- Gnesotto et al. (2018) F. S. Gnesotto, F. Mura, J. Gladrow, and C. P. Broedersz, Reports on Progress in Physics 81, 066601 (2018).
- Brown and Sivak (2019) A. I. Brown and D. A. Sivak, Chemical Reviews (2019), 10.1021/acs.chemrev.9b00254.
- Jarzynski (2011) C. Jarzynski, Annual Review of Condensed Matter Physics 2, 329 (2011).
- Rao and Peliti (2015) R. Rao and L. Peliti, Journal of Statistical Mechanics: Theory and Experiment 2015, P06001 (2015).
- Sartori and Pigolotti (2015) P. Sartori and S. Pigolotti, Phys. Rev. X 5, 041039 (2015).
- Barato and Seifert (2015a) A. C. Barato and U. Seifert, Phys. Rev. Lett. 114, 158101 (2015a).
- Hyeon and Hwang (2017) C. Hyeon and W. Hwang, Phys. Rev. E 96, 012156 (2017).
- Gingrich et al. (2016) T. R. Gingrich, J. M. Horowitz, N. Perunov, and J. L. England, Phys. Rev. Lett. 116, 120601 (2016).
- Horowitz and Gingrich (2017) J. M. Horowitz and T. R. Gingrich, Phys. Rev. E 96, 020103 (2017).
- Hasegawa and Van Vu (2019) Y. Hasegawa and T. Van Vu, Phys. Rev. Lett. 123, 110602 (2019).
- Barato and Seifert (2015b) A. C. Barato and U. Seifert, The Journal of Physical Chemistry B 119, 6555 (2015b).
- Pietzonka et al. (2016a) P. Pietzonka, A. C. Barato, and U. Seifert, Journal of Statistical Mechanics: Theory and Experiment 2016, 124004 (2016a).
- Seifert (2018) U. Seifert, Physica A: Statistical Mechanics and its Applications 504, 176 (2018), lecture Notes of the 14th International Summer School on Fundamental Problems in Statistical Physics.
- Hwang and Hyeon (2018) W. Hwang and C. Hyeon, The Journal of Physical Chemistry Letters 9, 513 (2018).
- Tawfik (2014) D. S. Tawfik, Current Opinion in Chemical Biology 21, 73 (2014).
- Murugan et al. (2012) A. Murugan, D. A. Huse, and S. Leibler, Proceedings of the National Academy of Sciences 109, 12034 (2012).
- Murugan et al. (2014) A. Murugan, D. A. Huse, and S. Leibler, Phys. Rev. X 4, 021016 (2014).
- Ouldridge et al. (2017) T. E. Ouldridge, C. C. Govern, and P. R. ten Wolde, Phys. Rev. X 7, 021004 (2017).
- Wong et al. (2018) F. Wong, A. Amir, and J. Gunawardena, Phys. Rev. E 98, 012420 (2018).
- Tlusty et al. (2004) T. Tlusty, R. Bar-Ziv, and A. Libchaber, Physical Review Letters 93, 258103 (2004).
- Bar-Ziv et al. (2002) R. Bar-Ziv, T. Tlusty, and A. Libchaber, Proceedings of the National Academy of Sciences 99, 11589 (2002).
- Banerjee et al. (2017) K. Banerjee, A. B. Kolomeisky, and O. A. Igoshin, Proceedings of the National Academy of Sciences 114, 5183 (2017).
- Mallory et al. (2019) J. D. Mallory, A. B. Kolomeisky, and O. A. Igoshin, The Journal of Physical Chemistry B 123, 4718 (2019).
- Zaher and Green (2010) H. S. Zaher and R. Green, Molecular Cell 39, 110 (2010).
- Wong et al. (1991) I. Wong, S. S. Patel, and K. A. Johnson, Biochemistry 30, 526 (1991).
- Donlin et al. (1991) M. J. Donlin, S. S. Patel, and K. A. Johnson, Biochemistry 30, 538 (1991).
- Patel et al. (1991) S. S. Patel, I. Wong, and K. A. Johnson, Biochemistry 30, 511 (1991).
- Koza (1999) Z. Koza, Journal of Physics A: Mathematical and General 32, 7637 (1999).
- Pietzonka et al. (2016b) P. Pietzonka, A. C. Barato, and U. Seifert, Journal of Physics A: Mathematical and Theoretical 49, 34LT01 (2016b).
- Gromadski et al. (2006) K. B. Gromadski, T. Daviter, and M. V. Rodnina, Molecular Cell 21, 369 (2006).
- Savir and Tlusty (2013) Y. Savir and T. Tlusty, Cell 153, 471 (2013).