Decoupled algorithm for the multicomponent potential theory of adsorption of gas mixtures
Abstract
In this paper, we present a new implementation of the Multicomponent Potential Theory of Adsorption model. The proposed interpretation makes a clear distinction between parameters depending on the adsorbent from those depending on the adsorbate, which leads to a better understanding of the parameters signification. The interdependence between pure isotherms is eliminated, which means that each component can be individually finely adjusted. This new approach was tested against 14 datasets for a total of 510 experimental mixture adsorption data of CH4, CO2, N2, H2, O2, H2S, C2H6, C3H6 and C3H8 on activated carbons, MOF and zeolites. A slight improvement of 4.67% on excess adsorption predictions was found, leading to an overall average error of 6.97% for total excess adsorption and 15.30% for combined mixtures and components excess adsorption predictions.
Keywords: adsorption; mixture adsorption; multicomponent adsorption; potential theory of adsorption; MPTA; density functional theory; Dubinin
1 Introduction
In the standard definition of the Multicomponent Potential Theory of Adsorption model (MPTA), some fitting parameters are interdependent, which requires the simultaneous fitting of pure isotherms. This situation results from the choice of minimizing the number of adjustable parameters of the model. The proposed reinterpretation of the model eliminates this interdependence by introducing new adjustable parameters, specific to each gas component, which ultimately, simplify the adjustment and understanding of the model. Both approaches were tested against 14 different experimental datasets from the literature [1, 2, 3, 4, 5, 6, 7, 8, 9, 10, 11, 12, 13]. The datasets include 510 individual mixture adsorption measurements, in which 72 are ternary mixtures adsorption. The fluids considered are CH4, CO2, N2, H2, O2, H2S, C2H6, C3H6 and C3H8. The adsorbent materials are activated carbons (Filtrasorb-400, Norit-R1, AP-360, BPL), metal-organic frameworks (MOF-5, CuBTC), and zeolites (4A, 5A, 13X, ZSM-5, Mordenite). The experiments were performed both volumetrically and gravimetrically at temperatures ranging from 297K to 473K.
1.1 Pure gas MPTA model
When talking about adsorption, it is useful to define the bulk phase as the region far from the adsorbent where the fluid is unaffected by the adsorbent material. Conversely, the adsorbed phase will represent the region near the surface where the fluid is significantly affected by the presence of the adsorbent material.
The potential theory of adsorption (PTA) is a two-parameter thermodynamic model developed by Shapiro, and Stenby [14] based on the pore filling approach of Polanyi’s theory of adsorption [15]. The PTA model was generalized to MPTA for gas mixtures adsorption by Shapiro, Stenby and Monsalvo [14, 16]. The MPTA model supposes that the fluid–surface interaction is entirely described by a local potential field , generated by the surface ([17, 18]). A common choice for this purpose is the Dubinin–Radushkevich–Astakhov ([19, 20, 21]) potential, given by
where and are the characteristic energy of adsorption and the limiting micropore volume, respectively. is a parameter which is usually interpreted as a quantification of the heterogeneity of the adsorbent [22, 23]. Usually, for activated carbon, the parameter is set to , while and are determined by fitting the model to experimental data (see [24] for details). The ratio represents the fraction of the microporous volume associated with an energy .
The MPTA model is defined by [25, 14]
| (1.3) |
where and are respectively the chemical potentials and the fluid density in the bulk phase, while and are the locals chemical potential and fluid density in the adsorbed phase. The bulk phase properties are assumed to be constant while the adsorbed phase properties vary with position [14]. Using Eq. (1.3), the adsorbed phase’s local thermodynamic properties are uniquely determined from properties of the bulk phase and the values of the parameter , and through the potential . Correspondance between gas pressure and density is carried out through an equation of state. The Nist REFPROP is used here for density and chemical potential calculations [26, 24]. In the following, we will omit the temperature dependence since is assumed to be constant.
Eq. (1.3) is inverted to obtain from the chemical potentials. The (Gibbs) excess adsorption (which is what is experimentally measured) is then calculated from
| (1.4) |
Optimal values for the fittings parameters are obtained by minimizing the difference for pure gases isotherms. The fitting is performed by a Python implemented Levenberg-Marquardt algorithm [27].
1.2 Gas Mixtures
For gas mixtures with components, the simplest approach is to consider that each fluid component is affected by its own surface potential
where refers to a given component. The parameters and are generally assumed to be common to all mixture components [28]. Eq. (1.3) now becomes a non-linear coupled system of equations
| (1.7) |
in which is the molar fraction of a component of the mixture. Due to the selectivity of the adsorbent material, the local molar fraction will vary in the adsorbed phase, whereas the molar fraction of the bulk phase is constant. Here again, the mixture densities are obtained from pressure measurements, mixture molar fraction, and the REFPROP software.
Equations (1.7) are solved for and . The excess (Gibbs) adsorption of each component in the mixture is obtained from
| (1.8) |
Finally, the total adsorbed amount is the sum of the contributions of each component
| (1.9) |
2 Independent and parameters
Using unique values of and for all fluids components is generally justified by the fact that those parameters are mostly properties of the adsorbent material. Moreover, this allows the reduction of the fitting parameters to (or if is also fitted).
However, there are some disadvantages to this approach. Firstly, all the pure gases must be refit each time that a single component is modified. For example, if we consider a binary mixture of gas A and B, the model must be simultaneously fitted on pure isotherms for gas A and B to obtain , , and . Now, if a new mixture of gas A and C is considered, parameters , and cannot be reused. The model must be fit anew using the A and C isotherms. Since and change every time a component of the mixture is changed, the interpretation of those parameters as characteristic energy of adsorption of component and limiting micropore volume become less clear. Indeed, it is expected that at least the characteristic energy of adsorption is constant for the pure adsorption of a pair adsorbate–adsorbent. This is not the case in the conventional MPTA approach.
Secondly, physically speaking, any interaction is characterized by it strength and it range, as so for the fluid–surface potential . For the sake of the discussion, let us consider the simple graphite adsorbent structure where the surface is essentially constituted of isotropic 2D carbon planes. In that case, the microporous volume is just a specific surface area times a distance to the surface. From the nearly crystalline structure of the graphite, we can infer that this specific surface area is constant, leaving being essentially a variable of the distance to the surface. This implies that will also be the product of the same characteristic surface times a characteristic distance to the surface. Any characteristic distance to a surface surely represents a range of interaction, and then, functionally speaking, this means that represents the range of the fluid–surface interaction. This leaves representing the strength of the interaction.
For disorganized adsorbent structures, the situation is more complicated, but still can be interpreted as a measure of the distance to the surface time a specific surface. However, this time, the specific surface is given by some complicated geometrical average of the porous surface.
The upshot is that is linked to the range of the interaction, and then, it makes much more sense to consider different for different pure gases rather than the same for all gases.
Finally, in the perspective of complex mixtures with many components, it will be even more challenging to fit all these pure isotherms simultaneously rather than fitting each component individually.
From all those considerations, individual values of and can be introduced from minor modifications of the fluid–surface potential which now reads
Now, , and are parameters specific to pure gas . The modified potential (2) induce no modification to the system of equation (1.7).
For excess adsorption, the situation is more complicated. It was said earlier that the adsorbed phase is the region where the fluid is affected by the presence of the surface. This definition now needs to be clarified and extended to the indirect effects of other gases components. Indeed, let us consider the region . In that region, the surface potential since , which seems to indicated that the gas is unaffected by the presence of the adsorbent. However, the component will be affected by the presence of the adsorbent in that region since as . However, the fact that the component is affected by the adsorbent will modify its local molar fraction . Since , local molar fractions are not independent and then, will be affected indirectly by the adsorption of component .
The easiest way to see this is by looking at the molar fraction of component in the range , which would have been constant if component was not affected at all. Fig. 1 show this situation for a mixture of 72% CH4/28% CO2 at bulk pressure of 8.3 MPa and temperature of 318.2 K (experimental data were taken in [1]). In the region (the light grey area), we see that the molar fraction of CH4 vary with even if the surface potential vanish in that region. At , the CH4 starts to interact with the surface through non-vanishing , and we observe a change in the comportment of the molar fraction. The sharp variation of the molar fraction at is obviously not physical. It came from the DRA potential which is not smooth at .

It is also interesting to take a look at the fluid density in that adsorbed phase region. Fig. 2 shows the density profile of the mixture in the same conditions. This figure shows the contribution of each component to the total density, such that the total fluid density is simply the sum of the individual component density. Here again, the sharp variation of fluid density is not physical but is rather an artifact caused by the DRA potential.

pressure of 8.3 MPa) on Calgon F-400 activated carbon at 318.2K. The grey area represent the region were CH4 surface potential vanishes, but not the CO2 ones.
The key point of this discussion is to realize that regardless of the component, the adsorbed phase’s fluid properties differ from the ones of the bulk phase for . For , the integral vanishes and then, the excess (Gibbs) adsorption for each component is be given by
| (2.3) |
where is simply the maximum value in . The condition that if is required in the implementation since the integration now goes from 0 to for all component.
It might be slightly confusing that even with individual , a unique upper limit for the integral emerges. One can then think that this situation argues in favor of a single value of since the integral is ultimately computed over the same range for all the mixture components. However, it is essential to keep in mind that for every component with , the fluid–surface interaction stop at ; The remaining part of the integral (where ) only account for indirect perturbation of the component . In fact, we can see that this part of the integral have a negative contribution to the excess adsorption since the molar fraction of that component is less than in the bulk phase , and the density of component is essentially constant.
With the proposed reinterpretation, the model now needs to be fitted on parameters (, , and ) instead of parameters (, , and ). However, the new form of the fluid–surface potential (2) decouples the fitting parameters for each component. In fact, the needed parameters split into individual three parameters fit. Once optimal , and values have been found for a pure gas, there will be no need to refit the model on this gas. Those individual parameters encapsulate all the required information of a pure gas about the fluid–surface interaction, whatever the mixture considered. In other words, the proposed interpretation make a clear cut between the fluid–surface interactions, which are governed by the fitting parameters (, and ), and the fluid–fluid interactions, which are entirely governed by the EOS (the REFPROP in our case) as it should be. Moreover, it is quite easier to do individual three parameters fit than a single parameters fit.
Finally, with gas mixtures adsorption, it is quite useful to compare the affinity of the adsorbent’s components. This will be done by the use of the selectivity of a component over another one. The selectivity of component over component is defined as ([6])
| (2.4) |
3 Results
To understand the limitation of the model, it is crucial to use accurate experimental data. Whether a volumetric or gravimetric method is used, the variables that are experimentally measured are the total excess adsorption (considering the pressure drop or increase of mass) and the bulk phase molar fraction (generally using gas chromatography). The adsorbed phase molar fraction is then calculated from the initial and equilibrium states, and the components adsorption are calculated from
| (3.1) |
The point here is that both and are tainted by experimental uncertainties such that
| (3.2) |
Dividing both side by , we obtain the relative error propagation equation
| (3.3) |
Let us focus on the second term. When considering a mixture of different component behavior, it is not uncommon to come across experimental conditions where is very small compared to . Since is not necessarily small enough to compensate for this difference, it is possible to end up with unacceptably large relative uncertainty. To illustrate this, let us consider a case encounter in the dataset where mmol/g and . In that particular case, mmol/g, and then, the last term of (3.3) gives an unacceptable relative uncertainty of on . From now on, the experimental data with relative uncertainty greater than 25% will be omitted from the fits. For the experimental dataset with unknown experimental uncertainties, an experimental error of 1% on and 1% on the smallest will be assumed to evaluate relative uncertainties. Those values are representative of the usual experimental uncertainties and were established from the experimental dataset with given experimental errors.
Table 1 shows the considered datasets and gives the mean pure fit error of both standard MPTA and the new interpretation of the model, which will be labeled “new MPTA" even if this is more of a reinterpretation of the MPTA rather than a new model.
| Mean pure fit error | ||||
|---|---|---|---|---|
| Adsorbent | Adsorbate | T(K) | Std MPTA | New MPTA |
| AC Calgon F-400 [1] | CH4/N2/CO2 | 318.2 | 2.82% | 1.91% |
| AC Norit R1 [2] | CH4/N2/CO2 | 298 | 3.17% | 1.22% |
| AC AP3-60 [3] | N2/CO2/H2 | 298 | 2.63% | 2.83% |
| AC BPL [4] | CH4/C2H6 | 297, 301.4 | 5.03% | 1.46% |
| MOF-5 [5, 6] | CH4/N2/H2/CO2 | 297 | 8.91% | 3.60% |
| CuBTC [6] | CH4/N2/H2/CO2 | 297 | 2.96% | 2.45% |
| Zeolite-4A [7] | C3H8/C3H6 | 423/473 | 4.94% | 2.40% |
| Zeolite-5A [8] | O2/N2 | 296 | 2.82% | 1.31% |
| Zeolite-5A [9] | CH4/N2 | 303/323 | 6.14% | 3.90% |
| Zeolite-13X [10] | CH4/N2 | 303/323 | 7.04% | 3.36% |
| Zeolite-13X [11] | CO2/N2 | 298/318 | 3.07% | 0.95% |
| Zeolite-ZSM-5 [11] | CO2/N2 | 298/318 | 3.72% | 2.63% |
| Zeolite-NaX [12] | CO2/CO | 323/373 | 5.46% | 2.24% |
| Zeolite H-Mordenite [13] | CO2/H2S/C3H8 | 303 | 7.25% | 3.00% |
3.1 Activated Carbon Filtrasorb-400 (Sudibandriyo)
First, we consider the adsorption of CH4, CO2, N2 and their binary mixtures on activated carbon Filtrasorb-400 (Calgon Carbon Co.) which have a microporous volume of 0.4950 cm3/g, and a BET surface of 850 m2/g ([1]). The measurements were performed volumetrically at 318.2K with pressure up to 13.8 MPa. Adsorption of pure gases was carried out twice to guarantee reproducibility. Both runs were used to fit the MPTA model. Overall, the new model underestimates the mixture adsorption by 3.32%, while the pure isotherms are overestimated by 2%.
Table 2 gives the mean error between the prediction of both approaches, while Figure 3 shows some of the new model results.
| Mean error (%) | ||||||
| Std MPTA | New MPTA | |||||
| System | N | Select | N | Select | ||
| CH4/CO2 | CH4 component | 25.37 | — | 14.03 | — | |
| CO2 component | 6.50 | 52.59 | 7.88 | 27.47 | ||
| Mixture | 2.21 | — | 3.16 | — | ||
| CH4/N2 | CH4 component | 3.30 | 6.94 | 7.83 | 11.82 | |
| N2 component | 6.39 | — | 5.40 | — | ||
| Mixture | 3.36 | — | 4.13 | — | ||
| N2/CO2 | N2 component | 12.95 | — | 9.98 | — | |
| CO2 component | 6.05 | 23.70 | 8.63 | 21.29 | ||
| Mixture | 1.49 | — | 3.30 | — | ||
| Overall error: | 7.48 | 27.48 | 7.12 | 20.02 | ||
| Overall increased performance: | — | — | 4.8 | 27.1 | ||
| 113 experimental data points. | ||||||


3.2 Activated Carbon Norit R1 (Dreisbach)
Binary and ternary mixtures of CH4, N2, and CO2 are considered on activated carbon Norit R1 Extra which has a microporous volume of 0.3511 cm3/g, and a BET surface of 1407.3 m2/g ([2]). The measurements were performed gravimetrically at 298K over a pressure ranging from 93 KPa to 6.077 MPa. Overall, the new model underestimates the mixture’s adsorption by 7.68%, while the pure isotherms are underestimated by 0.82%.
Table 3 gives the mean error between the prediction of both approaches, while Figure 4 shows some selected results of the new model.
| Mean error (%) | ||||||
| Standard MPTA | New MPTA | |||||
| System | N | Select | N | Select | ||
| CH4/CO2 | CH4 component | 36.88 | — | 36.32 | — | |
| CO2 component | 9.07 | 40.97 | 7.71 | 39.83 | ||
| Mixture | 5.79 | — | 5.66 | — | ||
| CH4/N2 | CH4 component | 7.86 | 8.93 | 12.02 | 16.89 | |
| N2 component | 7.00 | — | 6.13 | — | ||
| Mixture | 4.93 | — | 5.36 | — | ||
| CO2/N2 | CO2 component | 4.26 | 27.76 | 4.40 | 24.72 | |
| N2 component | 20.45 | — | 18.30 | — | ||
| Mixture | 3.50 | — | 5.27 | — | ||
| CH4/CO2/N2 | CH4 component | 26.88 | —† | 26.42 | —† | |
| CO2 component | 16.74 | —† | 14.50 | —† | ||
| N2 component | 57.04 | — | 58.87 | — | ||
| Mixture | 10.67 | — | 11.31 | — | ||
| Overall error: | 19.09 | 25.39 | 19.18 | 27.79 | ||
| Overall increased performance: | — | — | -0.47 | -9.45 | ||
| 94 experimental data points. | ||||||
| † Error on selectivity over 100% due to large error on the least adsorbed component. | ||||||


3.3 Activated Carbon AP3-60 (Schell)
Binary mixtures of CO2, N2 and H2 are considered on activated carbon Envirocarb AP3-60 (Chemviron Carbon) [3], which have a BET surface of 1000 m2/g (Chemviron Carbon). The measurements were performed gravimetrically at 298K over a pressure ranging from 400 KPa to 11.86 MPa. Overall, the new model underestimates the mixture adsorption by 9.19%, while the pure isotherms are underestimated by 1.22%.
Table 4 gives the mean error between the prediction of both approaches.
| Mean error (%) | ||||||
| Std MPTA | New MPTA | |||||
| System | N | Select | N | Select | ||
| CO2/N2 | CO2 component | 4.47 | — | 2.40 | — | |
| N2 component | 33.45 | 62.57 | 27.91 | 52.62 | ||
| Mixture | 2.60 | — | 2.64 | — | ||
| CO2/H2 | CO2 component | 3.38 | — | 4.00 | — | |
| H2 component | 115.36 | —† | 108.44 | —† | ||
| Mixture | 13.30 | — | 12.47 | — | ||
| Overall error: | 34.10 | 62.57 | 31.68 | 52.62 | ||
| Overall increased performance: | — | — | 7.10 | 15.90 | ||
| 40 experimental data points. | ||||||
| † Error on selectivity over 100% due to large error on the least adsorbed component. | ||||||
3.4 Activated Carbon BPL (He)
Binary mixtures of CO2 and C2H6 are considered on activated carbon BPL (Calgon Carbon Co.) [4], which have a microporous volume of 0,630 cm3/g and a BET surface of 1200 m2/g ([29]). The measurements were performed volumetrically at 297K and 301.4K with pressure up to 2.5 MPa. Overall, the new model underestimates the mixture adsorption by 9.76%, while the pure isotherms are underestimated by 0.06%.
Table 5 gives the mean error between the prediction of both approaches.
| Mean error (%) | ||||||
| Std MPTA | New MPTA | |||||
| System | N | Select | N | Select | ||
| CH4/C2H6 297K | CH4 component | 13.57 | — | 12.88 | — | |
| C2H6 component | 12.98 | 20.92 | 15.16 | 20.16 | ||
| Mixture | 9.04 | — | 9.64 | — | ||
| CH4/C2H6 301.4K | CH4 component | 24.62 | — | 23.72 | — | |
| C2H6 component | 12.96 | 45.01 | 13.14 | 49.26 | ||
| Mixture | 6.50 | — | 6.56 | — | ||
| Overall error: | 13.43 | 34.30 | 13.62 | 36.33 | ||
| Overall increased performance: | — | — | -1.41 | -5.92 | ||
| 54 experimental data points. | ||||||
3.5 MOF-5 (Klouste)
Binary mixtures of CH4, N2 and CO2 and ternary mixture of H2, CH4, N2 and CO2 are considered on metal-organic framework MOF-5 (Basolite C300), which have a microporous volume of 1.31 cm3/g and a BET surface of 3054 m2/g ([5, 6]). The measurements were performed volumetrically at 297K with pressure up to 1.5 MPa. Overall, the new model underestimates the mixture adsorption by 9.86%, while the pure isotherms are underestimated by 1.60%.
Table 6 gives the mean error between the prediction of both approaches, while Figure 5 shows some selected results of the new model.
| Mean error (%) | ||||||
| Std MPTA | New MPTA | |||||
| System | N | Select | N | Select | ||
| CH4/CO2 | CH4 component | 23.59 | — | 17.86 | — | |
| CO2 component | 7.25 | 39.64 | 6.67 | 29.06 | ||
| Mixture | 5.56 | — | 4.10 | — | ||
| CH4/N2 | CH4 component | 3.96 | 12.76 | 3.87 | 3.96 | |
| N2 component | 10.04 | — | 6.09 | — | ||
| Mixture | 4.48 | — | 3.97 | — | ||
| CO2/N2 | CO2 component | 5.50 | 47.77 | 5.22 | 33.36 | |
| N2 component | 32.83 | — | 25.90 | — | ||
| Mixture | 7.75 | — | 7.26 | — | ||
| N2/CH4/CO2 | N2 component | 28.99 | — | 20.32 | — | |
| CH4 component | 22.21 | 10.78† | 15.79 | 10.54† | ||
| CO2 component | 16.36 | 38.71† | 15.83 | 29.81† | ||
| Mixture | 13.44 | — | 10.58 | — | ||
| H2/CH4/CO2 | H2 component | 7.28 | — | 17.09 | — | |
| CH4 component | 18.77 | 14.16† | 13.18 | 7.93† | ||
| CO2 component | 25.64 | 33.70† | 12.12 | 30.36† | ||
| Mixture | 21.20 | — | 9.07 | — | ||
| H2/N2/CO2 | H2 component | 19.29 | — | 26.53 | — | |
| N2 component | 16.72 | 15.13† | 5.88 | 29.54† | ||
| CO2 component | 19.64 | 37.71† | 12.05 | 39.66† | ||
| Mixture | 13.64 | — | 8.52 | — | ||
| Overall error: | 16.43 | 27.64 | 12.61 | 21.88 | ||
| Overall increased performance: | — | — | 23.25 | 20.84 | ||
| 40 experimental data points. | ||||||
| † Represent the adsorption selectivity of the component compare to the first component. | ||||||

3.6 CuBTC (Klouste)
Ternary mixtures of H2, N2 and CO2 are considered on metal-organic framework CuBTC (Basolite Z100H), which have a microporous volume of 0.66 cm3/g and a BET surface of 1556 m2/g ([6]). The measurements were performed volumetrically at 297K with pressure up to 1 MPa. Overall, the new model underestimates the mixture adsorption by 31.93%, while the pure isotherms are overestimated by 0.89%.
Table 7 gives the mean error between the prediction of both approaches.
| Mean error (%) | ||||||
| Std MPTA | New MPTA | |||||
| System | N | Select | N | Select | ||
| H2/N2/CO2 | H2 component | 42.49 | — | 35.14 | — | |
| N2 component | 22.08 | 38.92† | 28.66 | 11.80† | ||
| CO2 component | 3.93 | 83.67† | 4.18 | 63.18† | ||
| Mixture | 2.90 | — | 2.10 | — | ||
| Overall error: | 17.85 | 61.30 | 17.52 | 37.49 | ||
| Overall increased performance: | — | — | 1.85 | 38.84 | ||
| 3 experimental data points. | ||||||
| † Represent the adsorption selectivity of the component compare to the first component. | ||||||
3.7 Zeolite-4A (Grande)
Binary mixtures of C3H8 and C3H6 are considered on Zeolite-4A [7], which have a microporous volume of 0.2462 cm3/g and a BET surface of 559.13 m2/g ([30]). The measurements were performed volumetrically at 423K and 473K over a pressure ranging from 85 KPa to 145 KPa. Overall, the new model underestimates the mixture adsorption by 1.13%, while the pure isotherms are overestimated by 0.32%.
Table 8 gives the mean error between the prediction of both approaches.
| Mean error (%) | ||||||
| Std MPTA | New MPTA | |||||
| System | N | S | N | S | ||
| C3H8/C3H6 423K | C3H8 component | 18.65 | — | 18.46 | — | |
| C3H6 component | 4.03 | 32.26 | 3.80 | 30.59 | ||
| Mixture | 2.89 | — | 2.94 | — | ||
| C3H8/C3H6 473K | C3H8 component | 14.72 | — | 13.56 | — | |
| C3H6 component | 2.64 | 15.80 | 5.86 | 12.15 | ||
| Mixture | 3.76 | — | 3.40 | — | ||
| Overall error: | 7.84 | 24.66 | 8.03 | 22.08 | ||
| Overall increased performance: | — | — | -2.42 | 10.46 | ||
| 13 experimental data points. | ||||||
3.8 Zeolite-5A (Talu)
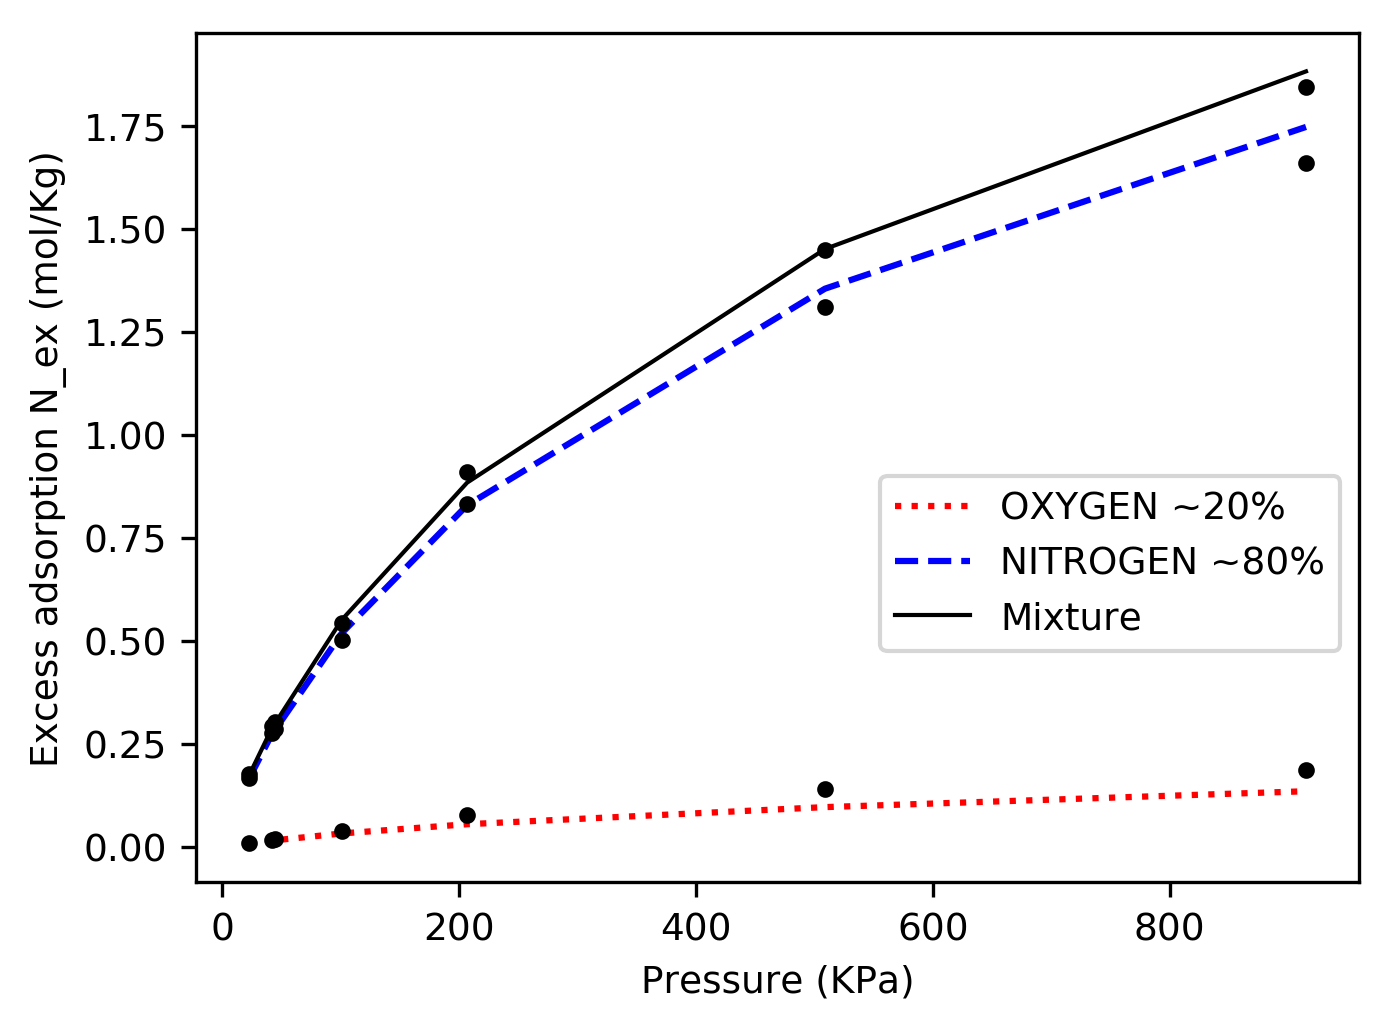
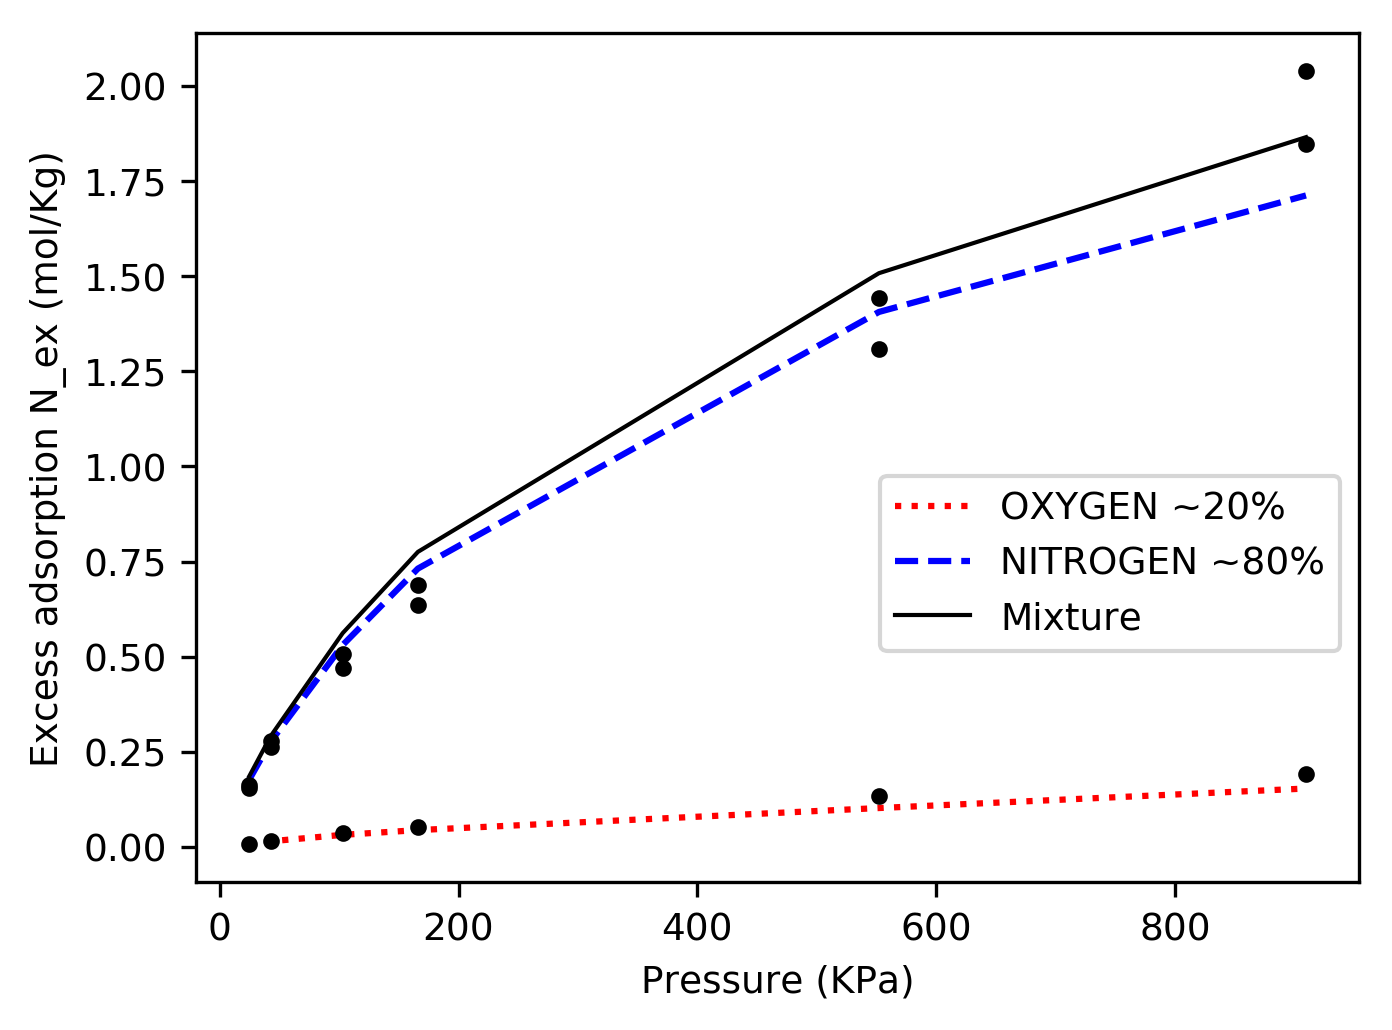
Binary mixtures of O2 and N2 are considered on a commercial Zeolite-5A (Tosoh Corporation) [8], which have a microporous volume of 0.198 cm3/g and a BET surface of 561.1 m2/g ([31]). The measurements were performed volumetrically at 296K over a pressure ranging from 23 KPa to 921 KPa. Overall, the new model underestimates the mixture adsorption by 4.68%, while the pure isotherms are underestimated by 1.07%.
Table 9 gives the mean error between the prediction of both approaches, while Figure 6 shows some selected results of the new model.
| Mean error (%) | ||||||
| Std MPTA | New MPTA | |||||
| System | N | S | N | S | ||
| O2/N2 open system | O2 component | 24.41 | — | 21.51 | — | |
| N2 component | 4.48 | 40.41 | 2.89 | 33.28 | ||
| Mixture | 2.39 | — | 1.62 | — | ||
| O2/N2 closed system | O2 component | 17.98 | — | 14.69 | — | |
| N2 component | 13.70 | 36.10 | 10.56 | 26.00 | ||
| Mixture | 11.98 | — | 9.27 | — | ||
| Overall error: | 11.61 | 39.18 | 9.48 | 31.20 | ||
| Overall increased performance: | — | — | 18.3 | 20.3 | ||
| 21 experimental data points. | ||||||
3.9 Zeolite-5A (Bakhtyari)
Binary mixtures of CH4 and N2 are considered on Zeolite-5A (Zeochem Co.), which have a BET surface of 457–600 m2/g ([9]). The measurements were performed volumetrically at 303K and 323K over a pressure ranging from 98 KPa to 916 KPa. Overall, the new model overestimates the mixture adsorption by 1.34%, while the pure isotherms are underestimated by 3.03%.
Table 10 gives the mean error between the prediction of both approaches.
| Mean error (%) | ||||||
| Std MPTA | New MPTA | |||||
| System | N | S | N | S | ||
| CH4/N2 303K | CH4 component | 6.00 | — | 9.32 | — | |
| N2 component | 6.57 | 6.22 | 5.21 | 13.61 | ||
| Mixture | 5.86 | — | 5.81 | — | ||
| CH4/N2 323K | CH4 component | 4.11 | — | 3.97 | — | |
| N2 component | 5.12 | 4.24 | 8.37 | 9.58 | ||
| Mixture | 3.99 | — | 3.77 | — | ||
| Overall error: | 5.61 | 5.61 | 6.35 | 12.37 | ||
| Overall increased performance: | — | — | -13.19 | -120.50 | ||
| 26 experimental data points. | ||||||
3.10 Zeolite-13X (Bakhtyari)
Binary mixtures of CH4 and N2 are considered on Zeolite-13X (Zeochem Co.) [10], which have a microporous volume of 0.21 cm3/g and a BET surface of 164.3 m2/g ([32]). The measurements were performed volumetrically at 303K and 323K over a pressure ranging from 105 KPa to 705 KPa. Overall, the new model overestimates the mixture adsorption by 5.95%, while the pure isotherms are underestimated by 2.62%.
Table 11 gives the mean error between the prediction of both approaches.
| Mean error (%) | ||||||
| Std MPTA | New MPTA | |||||
| System | N | S | N | S | ||
| CH4/N2 303K | CH4 component | 7.87 | — | 7.99 | — | |
| N2 component | 6.06 | 14.31 | 3.37 | 9.52 | ||
| Mixture | 6.20 | — | 6.20 | — | ||
| CH4/N2 323K | CH4 component | 13.11 | — | 8.68 | — | |
| N2 component | 5.30 | 17.39 | 5.64 | 10.32 | ||
| Mixture | 9.45 | — | 8.89 | — | ||
| Overall error: | 7.88 | 15.71 | 6.71 | 9.88 | ||
| Overall increased performance: | — | — | 14.85 | 37.11 | ||
| 33 experimental data points. | ||||||
3.11 Zeolite-13X (Hefti)
Binary mixtures of CO2 and N2 are considered on Zeolite-13X (Zeochem Co.) [11], which have a microporous volume of 0.21 cm3/g and a BET surface of 164.3 m2/g ([32]). The measurements were performed volumetrically at 298K and 318K over a pressure ranging from 115 KPa to 1020 KPa. Overall, the new model underestimates the mixture adsorption by 16.65%, while the pure isotherms are underestimated by 0.57%.
Table 12 gives the mean error between the prediction of both approaches.
| Mean error (%) | ||||||
| Std MPTA | New MPTA | |||||
| System | N | S | N | S | ||
| CO2/N2 298K | CO2 component | 5.93 | — | 4.56 | — | |
| N2 component | 58.20 | —† | 53.12 | —† | ||
| Mixture | 3.35 | — | 2.24 | — | ||
| CO2/N2 318K | CO2 component | 6.46 | — | 6.07 | — | |
| N2 component | 59.97 | —† | 49.07 | —† | ||
| Mixture | 4.15 | — | 4.16 | — | ||
| Overall error: | 22.96 | — | 19.88 | — | ||
| Overall increased performance: | — | — | 13.41 | — | ||
| 11 experimental data points. | ||||||
| † Error on selectivity over 100% due to large error on the least adsorbed component. | ||||||
3.12 Zeolite-ZSM-5 (Hefti)
Binary mixtures of CO2 and N2 are considered on Zeolite-ZSM-5 (Zeochem Co.) [11], which have a microporous volume of 0.155 cm3/g and a BET surface from 264 to 312.4 m2/g ([33]). The measurements were performed volumetrically at 298K and 318K over a pressure ranging from 120 KPa to 1010 KPa. Overall, the new model underestimates the mixture adsorption by 7.51%, while the pure isotherms are underestimated by 1.48%.
Table 13 gives the mean error between the prediction of both approaches.
| Mean error (%) | ||||||
| Std MPTA | New MPTA | |||||
| System | N | S | N | S | ||
| CO2/N2 298K | CO2 component | 2.08 | — | 2.36 | — | |
| N2 component | 44.80 | 106.17 | 26.40 | 43.91 | ||
| Mixture | 2.09 | — | 1.21 | — | ||
| CO2/N2 318K | CO2 component | 2.27 | — | 2.00 | — | |
| N2 component | 28.35 | 50.85 | 19.79 | 26.24 | ||
| Mixture | 3.24 | — | 2.23 | — | ||
| Overall error: | 13.48 | 74.90 | 8.87 | 33.92 | ||
| Overall increased performance: | — | — | 34.20 | 54.71 | ||
| 23 experimental data points. | ||||||
3.13 Zeolite-NaX (Belmabkhout)
Binary mixtures of CO2 and CO are considered on Zeolite-NaX, which have a microporous volume of 0.283 cm3/g and a BET surface of 685 m2/g ([12]). The measurements were performed volumetrically at 323K and 373K at a pressure of 100 KPa. Overall, the new model underestimates the mixture adsorption by 6.15%, while the pure isotherms are overestimated by 0.65%.
Table 14 gives the mean error between the prediction of both approaches.
| Mean error (%) | ||||||
| Std MPTA | New MPTA | |||||
| System | N | S | N | S | ||
| CO2/CO 323K | CO2 component | 22.33 | 43.22 | 24.51 | 36.82 | |
| CO component | 26.22 | — | 19.47 | — | ||
| Mixture | 24.62 | — | 21.52 | — | ||
| CO2/CO 373K | CO2 component | 19.13 | 33.52 | 19.66 | 33.63 | |
| CO component | 22.04 | — | 22.06 | — | ||
| Mixture | 16.39 | — | 16.80 | — | ||
| Overall error: | 21.59 | 36.75 | 20.28 | 34.69 | ||
| Overall increased performance: | — | — | 6.07 | 5.61 | ||
| 3 experimental data points. | ||||||
3.14 Mordenite (Talu)
Binary and ternary mixtures adsorption of CO2, H2S and C3H8 are studied on hydrogen mordenite (Norton Company) [13], which have a BET surface of 400 m2/g ([34]). The measurements were performed volumetrically at 303K over a pressure ranging from 1 KPa to 61 KPa. Overall, the new model underestimates the mixture adsorption by 23.88%, while the pure isotherms are overestimated by 0.59%.
Table 15 gives the mean error between the prediction of both approaches.
| Mean error (%) | ||||||
| Std MPTA | New MPTA | |||||
| System | N | Select | N | Select | ||
| CO2/H2S | CO2 component | 36.12 | — | 51.08 | — | |
| H2S component | 7.33 | 72.78 | 10.37 | 145.12 | ||
| Mixture | 6.32 | — | 2.20 | — | ||
| C3H8/CO2 | C3H8 component | 22.62 | 100.45 | 16.70 | 84.50 | |
| CO2 component | 49.83 | — | 47.31 | — | ||
| Mixture | 16.85 | — | 21.76 | — | ||
| C3H8/H2S | C3H8 component | 47.15 | — | 45.10 | — | |
| H2S component | 17.42 | —† | 15.93 | —† | ||
| Mixture | 20.42 | — | 20.12 | — | ||
| CO2/H2S/C3H8 | CO2 component | 50.59 | — | 63.64 | — | |
| H2S component | 92.01 | —† | 100.81 | —† | ||
| C3H8 component | 82.49 | —† | 83.15 | —† | ||
| Mixture | 29.42 | — | 31.45 | — | ||
| Overall error: | 37.94 | 86.62 | 40.55 | 114.81 | ||
| Overall increased performance: | — | — | -6.88 | -32.54 | ||
| 36 experimental data points. | ||||||
| † Error on selectivity over 100% due to large error on the least adsorbed component. | ||||||
4 Conclusion
A new approach to the Multicomponent Potential Theory of Adsorption was presented in which individual fitting parameters replaced the commons ones. Specifically, the new approach uses distinct values of the parameters (the limiting microporous volume) and (the heterogeneity parameter) for the model pure gases fits. In the standard MPTA model, those parameters are shared by all the pure gases, which generated the coupling of pure gases. In this new interpretation of the model, there are individual parameters for each pure gases considered. This interpretation implies more fitting parameters (3 parameters instead of +2) but is nevertheless easier to understand and adjust because the model decomposed into individual three parameters fit. The objective pursued is the ability to predict mixture adsorption without any experimental measurements by extrapolating parameters from one adsorbent to another. Under that scope, the independence of the components is a crucial step.
To ensure consistency of the experimental data to be compared with, the relative experimental uncertainty was calculated, and data with larger than 25% relative uncertainties were omitted from the fits. For datasets without given experimental uncertainty, a relative uncertainty of 1% on total excess adsorption and the smallest component molar fraction was assumed to evaluate relative uncertainties. Those uncertainties are representative of what is found in the literature. Finally, after testing over 500 experimental mixture data, the presented interpretation performed 4.67% better than the usual model, which gives a mean error of 6.97% for total mixture excess adsorption, and an overall combined mean error of 15.30% for component and mixture excess adsorption.
Acknowledgements
The authors would like to thanks the Natural Sciences and Engineering Research Council of Canada and the Savannah River National Laboratory for financial support.
References
- [1] M. Sudibandriyo, Z. Pan, J. E. Fitzgerald, R. L. Robinson, and K. A. Gasem, “Adsorption of methane, nitrogen, carbon dioxide, and their binary mixtures on dry activated carbon at 318.2 k and pressures up to 13.6 mpa,” Langmuir, vol. 19, no. 13, pp. 5323–5331, 2003.
- [2] F. Dreisbach, R. Staudt, and J. U. Keller, “High pressure adsorption data of methane, nitrogen, carbon dioxide and their binary and ternary mixtures on activated carbon,” Adsorption, vol. 5, no. 3, pp. 215–227, 1999.
- [3] J. Schell, N. Casas, R. Pini, and M. Mazzotti, “Pure and binary adsorption of co2, h2, and n2 on activated carbon,” Adsorption, vol. 18, pp. 49–65, Feb 2012.
- [4] Y. He, J.-H. Yun, and N. A. Seaton, “Adsorption equilibrium of binary methane/ethane mixtures in bpl activated carbon: isotherms and calorimetric heats of adsorption,” Langmuir, vol. 20, no. 16, pp. 6668–6678, 2004.
- [5] F. Kloutse, A. Hourri, S. Natarajan, P. Benard, and R. Chahine, “Experimental benchmark data of ch4, co2 and n2 binary and ternary mixtures adsorption on mof-5,” Separation and Purification Technology, vol. 197, pp. 228 – 236, 2018.
- [6] F. Kloutse, A. Hourri, S. Natarajan, P. Benard, and R. Chahine, “Hydrogen separation by adsorption: Experiments and modelling of h2-n2-co2 and h2-ch4-co2 mixtures adsorption on cubtc and mof-5,” Microporous and Mesoporous Materials, vol. 271, pp. 175–185, 2018.
- [7] C. A. Grande, C. Gigola, and A. E. Rodrigues, “Propane–propylene binary adsorption on zeolite 4a,” Adsorption, vol. 9, no. 4, pp. 321–329, 2003.
- [8] O. Talu, J. Li, R. Kumar, P. M. Mathias, J. D. Moyer Jr, and J. M. Schork, “Measurement and analysis of oxygen/nitrogen/5a-zeolite adsorption equilibria for air separation,” Gas separation & purification, vol. 10, no. 3, p. 149, 1996.
- [9] A. Bakhtyari and M. Mofarahi, “Pure and binary adsorption equilibria of methane and nitrogen on zeolite 5a,” Journal of Chemical & Engineering Data, vol. 59, no. 3, pp. 626–639, 2014.
- [10] M. Mofarahi and A. Bakhtyari, “Experimental investigation and thermodynamic modeling of ch4/n2 adsorption on zeolite 13x,” Journal of Chemical & Engineering Data, vol. 60, no. 3, pp. 683–696, 2015.
- [11] M. Hefti, D. Marx, L. Joss, and M. Mazzotti, “Adsorption equilibrium of binary mixtures of carbon dioxide and nitrogen on zeolites zsm-5 and 13x,” Microporous and Mesoporous Materials, vol. 215, pp. 215–228, 2015.
- [12] Y. Belmabkhout, G. Pirngruber, E. Jolimaitre, and A. Methivier, “A complete experimental approach for synthesis gas separation studies using static gravimetric and column breakthrough experiments,” Adsorption, vol. 13, no. 3-4, pp. 341–349, 2007.
- [13] O. Talu and I. Zwiebel, “Multicomponent adsorption equilibria of nonideal mixtures,” AIChE journal, vol. 32, no. 8, pp. 1263–1276, 1986.
- [14] A. A. Shapiro and E. H. Stenby, “Potential Theory of Multicomponent Adsorption,” Journal of Colloid and Interface Science, vol. 201, no. 2, pp. 146–157, 1998.
- [15] M. Polanyi, “The Potential Theory of Adsorption,” Science, vol. 141, no. 3585, pp. 1010–1013, 1963.
- [16] M. a. Monsalvo and A. a. Shapiro, “Modeling adsorption of binary and ternary mixtures on microporous media,” Fluid Phase Equilibria, vol. 254, no. 1-2, pp. 91–100, 2007.
- [17] M. a. Monsalvo and A. a. Shapiro, “Prediction of adsorption from liquid mixtures in microporous media by the potential theory,” Fluid Phase Equilibria, vol. 261, no. 1-2, pp. 292–299, 2007.
- [18] M. A. Monsalvo and A. A. Shapiro, “Modeling adsorption of liquid mixtures on porous materials,” Journal of colloid and interface science, vol. 333, no. 1, pp. 310–316, 2009.
- [19] M. M. Dubinin, “Fundamentals of the theory of adsorption in micropores of carbon adsorbents: characteristics of their adsorption properties and microporous structures,” Pure and Applied Chemistry, vol. 61, no. 11, pp. 1841–1843, 1989.
- [20] E. Dundar, R. Zacharia, R. Chahine, and P. Bénard, “Potential theory for prediction of high-pressure gas mixture adsorption on activated carbon and MOFs,” Separation and Purification Technology, vol. 135, pp. 229–242, 2014.
- [21] E. Dundar, R. Zacharia, R. Chahine, and P. Bénard, “Performance comparison of adsorption isotherm models for supercritical hydrogen sorption on MOFs,” Fluid Phase Equilibria, vol. 363, pp. 74–875, 2014.
- [22] F. Stoeckli, “Recent developments in dubinin’s theory,” Carbon, vol. 36, no. 4, pp. 363–368, 1998.
- [23] A. P. Terzyk, P. A. Gauden, and P. Kowalczyk, “What kind of pore size distribution is assumed in the dubinin–astakhov adsorption isotherm equation?,” Carbon, vol. 40, no. 15, pp. 2879–2886, 2002.
- [24] R. Gervais Lavoie, M. Ouellet, J. Hamelin, and P. Bénard, “Numerical implementation of the multicomponent potential theory of adsorption in python using the nist refprop database,” Communications in Computational Physics, vol. 23, no. 5, pp. 1602–1625, 2018.
- [25] A. Myers, “Thermodynamics of adsorption in porous materials,” AIChE Journal, vol. 48, no. 1, pp. 145–160, 2002.
- [26] E. Lemmon, M. Huber, and M. McLinden, “NIST Standard Reference Database 23: Reference Fluid Thermodynamic and Transport Properties-REFPROP, Version 9.1, National Institute of Standards and Technology, Standard Reference Data Program, Gaithersburg,” 2013.
- [27] M. Newville, T. Stensitzki, D. B. Allen, M. Rawlik, A. Ingargiola, and A. Nelson, “Lmfit: non-linear least-square minimization and curve-fitting for python,” Astrophysics Source Code Library, 2016.
- [28] A. A. Naseri, M. R. Dehghani, and B. Behzadi, “Modeling adsorption in binary associating solvents using the extended mpta model,” Adsorption, vol. 20, no. 4, pp. 555–563, 2014.
- [29] B. P. Russell and M. D. Levan, “Pore size distribution of bpl activated carbon determined by different methods,” Carbon, vol. 32, no. 5, pp. 845–855, 1994.
- [30] A. Sowunmi, C. Folayan, F. Anafi, O. Ajayi, N. Omisanya, D. Obada, and D. Dodoo-Arhin, “Dataset on the comparison of synthesized and commercial zeolites for potential solar adsorption refrigerating system,” 2018.
- [31] Y. Li, H.-M. Guan, T.-S. Chung, and S. Kulprathipanja, “Effects of novel silane modification of zeolite surface on polymer chain rigidification and partial pore blockage in polyethersulfone (pes)–zeolite a mixed matrix membranes,” Journal of Membrane Science, vol. 275, no. 1-2, pp. 17–28, 2006.
- [32] Z. Zhang, W. Zhang, X. Chen, Q. Xia, and Z. Li, “Adsorption of co2 on zeolite 13x and activated carbon with higher surface area,” Separation Science and Technology, vol. 45, no. 5, pp. 710–719, 2010.
- [33] S. Sang, F. Chang, Z. Liu, C. He, Y. He, and L. Xu, “Difference of zsm-5 zeolites synthesized with various templates,” Catalysis Today, vol. 93, pp. 729–734, 2004.
- [34] N. Sagert, R. Pouteau, M. Bailey, and F. Sargent, “Benzene radical cation formation on hydrogen mordenite. the role of adsorbed oxygen,” Canadian Journal of Chemistry, vol. 50, no. 13, pp. 2041–2046, 1972.