The most massive galaxies with large depleted cores: structural parameter relations and black hole masses
Abstract
Luminous spheroids ( mag) contain partially depleted cores with sizes () typically 0.02 – 0.5 kpc. However, galaxies with 0.5 kpc are rare and poorly understood. Here we perform detailed decompositions of the composite surface brightness profiles, extracted from archival Hubble Space Telescope and ground-based images, of 12 extremely luminous “large-core” galaxies that have 0.5 kpc and mag, fitting a core-Sérsic model to the galaxy spheroids. Using 28 “normal-core” (i.e., 0.5 kpc) galaxies and 1 “large-core” (i.e., 0.5 kpc) galaxy from the literature, we constructed a final sample of 41 core-Sérsic galaxies. We find that large-core spheroids (with stellar masses ) are not simple high-mass extensions of the less luminous normal-core spheroids having . While the two types follow the same strong relations between the spheroid luminosity and (), and the spheroid half-light radius (, for ellipticals plus BCGs), we discover a break in the core-Sérsic relation occurring at mag. Furthermore, we find a strong log-linear relation for the 11 galaxies in the sample with directly determined SMBH masses —3/11 galaxies are large-core galaxies—such that . However, for the large-core galaxies the SMBH masses estimated from the and core-Sérsic relations are undermassive, by up to a factor of 40, relative to expectations from their large values, confirming earlier results. Our findings suggest that large-core galaxies harbour overmassive SMBHs (), considerably ( and ) larger than expectations from the spheroid and , respectively. We suggest that the relation can be used to estimate SMBH masses in the most massive galaxies.
Subject headings
galaxies: elliptical and lenticular, cD — galaxies: fundamental parameter — galaxies: nuclei — galaxies: photometry— galaxies: structureI. Introduction
It is now believed that all massive galaxies contain a supermassive black hole (SMBH) at their centre (Magorrian et al. 1998; Richstone et al. 1998; Ferrarese & Ford 2005). The connection between SMBHs and the properties of their host galaxies has been a subject of ongoing interest (see Kormendy & Ho 2013; Graham 2016 for recent reviews). SMBH masses () scale with a wide range of host galaxy properties such as the stellar velocity dispersion (; Ferrarese & Merritt 2000; Gebhardt et al. 2000) and bulge luminosity (; Kormendy & Richstone 1995; Magorrian et al. 1998; Marconi & Hunt 2003). In addition, observations reveal partially depleted cores—a flattening in the inner stellar light distributions of galaxies—that are explained as an imprint left by binary SMBHs on the central structures of their host galaxies.
Luminous spheroids ( mag), for the most part, possess depleted cores. In the hierarchical structure formation model, the brightest and most massive galaxies are built through generations of galaxy merger events (e.g., Toomre & Toomre 1972; White & Rees 1978; Schweizer 1982; Barnes 1988; Kauffmann et al. 1993; De Lucia & Blaizot 2007; Laporte et al. 2013). SMBH binaries invariably form in such galaxy mergers (e.g., Komossa et al. 2003; Rodriguez et al. 2006; Bianchi et al. 2008; Burke-Spolaor 2011; Barrows et al. 2012; Comerford et al. 2015; Goulding et al. 2019). N-body simulations suggest that depleted cores are generated via three-body interactions between inner stars from the galaxy core regions and orbitally decaying SMBH binaries which form in major, dry” (gas-poor) mergers of galaxies (e.g., Begelman et al. 1980; Ebisuzaki et al. 1991; Milosavljević & Merritt 2001; Merritt 2006; Hopkins et al. 2009). Due to only radial orbits being capable of bringing inner stars in close proximity to the SMBH binary, the binary scouring process leaves a relative excess of tangential orbits in the galaxy cores (Quinlan & Hernquist 1997; Milosavljević & Merritt 2001; Gebhardt et al. 2003; Thomas et al. 2014; Thomas et al. 2016; Rantala et al. 2018). Also, in Dullo & Graham 2015 we found a tendency for the depleted core regions of luminous galaxies to be round. In this paper we focus on the brightest galaxies which are expected to host the most massive SMBHs, making them excellent structural probes of extreme cases of core depletion caused by the cumulative actions of massive binary SMBHs.
Earlier studies of depleted cores using ground-based observations lacked the spatial resolution to reveal cores with small angular sizes in enough detail (e.g., King & Minkowski 1966; King 1978; Young et al. 1978; Binney & Mamon 1982; Lauer 1985). The availability of high-resolution Hubble Space Telescope (HST) imaging has subsequently allowed us to resolve such small cores and properly characterise depleted cores of “core-Sérsic” galaxies (e.g., Crane et al. 1993; Kormendy et al. 1994; Jaffe et al. 1994; Ferrarese et al. 1994; van den Bosch et al. 1994; Lauer et al. 1995; Byun et al. 1996; Gebhardt et al. 1996; Faber et al. 1997; Ravindranath et al. 2001; Rest et al. 2001; Laine et al. 2003; Graham et al. 2003; Ferrarese et al. 2006; Lauer et al. 2007a; Lauer et al. 2007b; Richings et al. 2011; Dullo & Graham 2012; Dullo & Graham 2013; Dullo & Graham 2014; Dullo et al. 2017; Rusli et al. 2013). However, as done in a few of these studies (e.g., Graham et al. 2003; Ferrarese et al. 2006; Dullo & Graham 2012; Dullo & Graham 2013; Dullo & Graham 2014; Rusli et al. 2013) reliably determining if a flat inner core in a galaxy actually reflects a deficit of stars relative to the inward extrapolation of the spheroid’s outer profile relies on careful modelling of the galaxy light profile using the core-Sérsic model. Applying the core-Sérsic model Dullo & Graham 2012 showed that 18 per cent of “cores” according to the Nuker model (Lauer et al. 1995; Lauer et al. 2007a) were actually misidentified Sérsic spheroids with low Sérsic indices and no depleted cores (see also Graham et al. 2003; Trujillo et al. 2004; Dullo & Graham 2014). Cores measured using the Nuker model break radii11 1 Graham et al. 2003 revealed that the Nuker model parameters are unstable and deviate from the true values as larger radial extents are probed by the light profile fitting. are also typically 23 times larger than the core-Sérsic model break radii, , (e.g., Trujillo et al. 2004; Ferrarese et al. 2006; Richings et al. 2011; Dullo & Graham 2012; Dullo & Graham 2013; Dullo & Graham 2014). Lauer et al. 2007b advocated the use of the “cusp radius”, i.e., the radius where the negative logarithmic slope of the fitted Nuker model equals 1/2 (, Carollo et al. 1997), as a measure of the core size. While the “cusp radius” somewhat agrees with the core-Sérsic break radius (Dullo & Graham 2012), its application fails to discriminate whether galaxies contain a partially depleted core or not, since all galaxy light profiles have a cusp radius.
In the past few decades, a few papers (e.g., Faber et al. 1997; Lauer et al. 2007b; Dullo & Graham 2014; Rusli et al. 2013; Thomas et al. 2016) have shown strong scaling relations involving the structural parameters of core-Sérsic spheroids. Unfortunately, these scaling relations were established using core-Sérsic spheroids having “normal” size cores (i.e., pc) and SMBH masses . The behavior of such scaling relations remains unknown for the most luminous core-Sérsic galaxies with “large” size cores (i.e., 0.5 kpc). In addition, SMBHs with masses of order are hosted by high-luminosity quasars at high redshift (Wu et al. 2015, e.g.,) and recent observations have found them in a few extremely massive, present-day galaxies (McConnell et al. 2011; Thomas et al. 2016; Mehrgan et al. 2019). These are important to constrain the SMBH scaling relations at high masses (). Given the luminosity function of galaxies (Efstathiou et al. 1988; Kochanek et al. 2001; Benson et al. 2003; Baldry et al. 2012), it implies that “large-core” galaxies are rare, although they are becoming increasingly common as more galaxies with high luminosity are modelled (e.g., NGC 6166, Lauer et al. 2007b; 4C +74.13, McNamara et al. 2009; A2261-BCG, Postman et al. 2012; Bonfini & Graham 2016; NGC 4486 and NGC 4889, Rusli et al. 2013; NGC 1600, Thomas et al. 2016; A2029-BCG, Dullo et al. 2017; A1689-BCG, Alamo-Martínez & Blakeslee 2017). However and as noted above, caution should be exercised when interpreting large depleted cores, particularly those identified by the Nuker model (e.g., Lauer et al. 2007b; López-Cruz et al. 2014). For example, López-Cruz et al. 2014 claimed that the BCG Holm 15A has the largest core size measured in any galaxy to date ( kpc) based on their Nuker model analysis. In contrast, Bonfini et al. 2015; Madrid & Donzelli 2016 did not identify a central stellar deficit relative to the spheroid’s outer Sérsic profile in their modeling of the galaxy’s CFHT and Gemini data, respectively, while Mehrgan et al. 2019 fit the 2D core-Sérsic+Sérsic+GaussianRing3D model to their Wendelstein image of the galaxy and reported a core size kpc.
Accurate extension of the galaxy structural scaling relations to the most massive galaxies carries valuable clues about the supposed joint evolution of SMBHs and their host spheroids. Of particular relevance is the observed correlation between the mass of the SMBH () and the size of the depleted core (). Absence of a bend/offset in the relation for the most massive spheroids would imply the core size is a good predictor of SMBH masses at the high mass end, more reliable than (e.g., Thomas et al. 2016). Lauer et al. 2007b noted that SMBH masses for the most luminous galaxies are overmassive relative to the inference from the high mass end of the relation, but they are in better agreement with those from relation (see also Volonteri & Ciotti 2013). The relation predicts for the most massive galaxies (i.e., km s-1, Lauer et al. 2007b; Bernardi et al. 2007) cannot exceed , whereas predicted from the relation can surpass (Lauer et al. 2007b). The rationale for this discrepancy is that the most massive spheroids are expected to undergo a larger number of dry major mergers that increase their stellar mass, black hole mass and size, while keeping their velocity dispersion relatively unaffected (e.g., Nipoti et al. 2003; Ciotti et al. 2007; Oser et al. 2012; Hilz et al. 2013). This is also evident from the broken relation of elliptical galaxies (Faber & Jackson 1976) which displays a shallower slope at bright magnitudes mag (, e.g., Malumuth & Kirshner 1981; Lauer et al. 2007b; Kormendy & Bender 2013), whereas at fainter magnitudes (e.g., Davies et al. 1983; Held et al. 1992; Matković & Guzmán 2005). This change in the slope of the relation matches the core-Sérsic versus Sérsic structural divide (e.g., Sahu et al. 2019).
Here, we perform careful, multi-component (halo/intermediate-scale component/spheroid/nucleus) decompositions of the new light profiles of 12 “large-core” galaxies (i.e., 9 BCGs, 2 second brightest cluster galaxies and 1 brightest group galaxy) using a core-Sérsic model and a Sérsic model. Together with the large-core BCG IC 1101 (Dullo et al. 2017), these 13 galaxies constitute the largest sample of “large-core” galaxies studied to date. We aim to revisit the structural scaling relations of our full sample of 41 core-Sérsic galaxies (13 “large-core” galaxies plus 28 “normal-core” galaxies, Dullo & Graham 2014) over a comprehensive dynamic range in core size ( kpc), spheroid luminosity ( mag 25.40 mag), spheroid stellar mass () and SMBH mass ().
The paper is organised as follows. Data and photometry for our new sample of 12 large-core galaxies are presented in Section II. We then discuss the analytical models employed and multi-component decompositions of these 12 large-core galaxies in Section III. Accurate structural relations for our full sample of 41 core-Sérsic galaxies are presented in Section IV. We go on to discuss the stellar mass deficits, galaxy environment and formation of normal- and large-core galaxies in Section V. Section VI summarizes our main conclusions. There are two appendices at the end of this paper (Appendices A and B). Appendix A shows the multi-component decompositions of the new major-axis surface brightness profiles of the 12 large-core galaxies. In Appendix B we show the spatial distribution of large-core galaxies and their nearest neighbors.
Throughout this paper, we assume a cosmology with = 70 km Mpc-1, = 0.7, and = 0.3 and quote magnitudes in the Vega system, unless noted otherwise.

| Cluster or Group | BCG or BGG | Type | D | ||
|---|---|---|---|---|---|
| (Mpc) | (km s-1) | ||||
| (1) | (2) | (3) | (4) | (5) | |
| NGC 1600 | NGC 1600 | E3 | 66.0 | 331 | |
| Virgo | NGC 4486† | cD pec | 23.0 | 323 | |
| Coma/Abell 1656 | NGC 4874† | cD0 | 106.4 | 271 | |
| Coma/Abell 1656 | NGC 4889 | cD4 | 96.6 | 347[2a] | |
| Abell 2199 | NGC 6166 | cD2 pec | 130.4 | 300[4a] | |
| MS0735.6+7421 | 4C +74.13 | cD | 925.3 | 239[1a] | |
| Abell 0119 | UGC 579 | E | 185.7 | 287 | |
| Abell 2029 | IC 1101 | E | 363.0 | 378 | |
| Abell 2147 | UGC 10143 | cD | 153.4 | 276 | |
| Abell 2261 | A2261-BCG | cD | 958.8 | 387[3a] | |
| Abell 3558 | ESO 444-G46 | cD4 | 204.9 | 248 | |
| Abell 3562 | ESO 444-G72 | 213.3 | 236 | ||
| Abell 3571 | ESO 383-G76 | cD5 | 169.0 | 322 |
Notes.—Col. (1): cluster or group name. All the galaxies in our sample except for the dominant group galaxy NGC 1600 reside in clusters. Col. (2): the superscript ‘’ denotes the two second brightest cluster elliptical galaxies in the sample which inhabit the centers of their clusters (Fig. 1). An alternative designation for A2261-BCG is 2MASX J17222717+3207571. Col. (3): classification came from NED22 2 http://ned.ipac.caltech.edu. Col. (4): distances (D) came from NED (3K CMB), assuming km s-1 Mpc-1. Col. (5): central velocity dispersions () are taken from HyperLeda33 3 (http://leda.univ-lyon1.fr) (Paturel et al. 2003) unless the source is indicated. Sources: [1a] McNamara et al. 2009; [2a] McConnell et al. 2011; [3a] Postman et al. 2012; and [4a] Bender et al. 2015.
II. Data and photometry
II.1. Sample Selection
We searched the literature for galaxies which were suspected to have a core-Sérsic break radius kpc and with archival high-resolution Hubble Space Telescope (HST) imaging. This resulted in a selected sample of 13 galaxies (see Table 1). The case of the BCG IC 1101 is published in Dullo et al. 2017 and the remaining 12 galaxies consist of 9 galaxies with kpc drawn from the Lauer et al. 2007a, 4C +74.13 (McNamara et al. 2009, kpc), the BCG of Abell A2261 (Postman et al. 2012, kpc) and the giant cD galaxy NGC 4486 (Richings et al. 2011, kpc; Rusli et al. 2013, kpc). Basic data for the full sample of 13 galaxies are listed in Table 1.
Fitting the ‘sharp-transition’ () core-Sérsic model to the inner 10 HST ACS/HRC light profiles of 23 massive galaxies, Hyde et al. 2008 measured kpc for 5/23 galaxies with high velocity dispersion ( 350 km s-1). These five galaxies are not included here, suspecting that the sharp-transition core-Sérsic model used by Hyde et al. 2008 may have caused the break radii of the galaxies to be overestimated, as was the case for the BCG SDSS J091944.2+562201.1. Hyde et al. 2008 reported a large break radius of kpc for this galaxy which was later found to have a much smaller break radius ( kpc) after fitting a smoother transition (i.e., ) core-Sérsic model to the galaxy’s two-dimensional light distribution (Bonfini & Graham 2016). After we complete the analysis in this paper, Alamo-Martínez & Blakeslee 2017 reported a large break radius of 3.8 kpc for the brightest cluster galaxy of Abell 1689. We did not include this galaxy in the paper.
II.2. Classification
All the galaxies in our sample except for three (NGC 1600, NGC 4486 and NGC 4874) are classified as BCGs (Lauer et al. 2007b; Dullo et al. 2017), see Table 1. The elliptical galaxy NGC 1600 is the brightest member of the poor NGC 1600 group. The giant elliptical NGC 4486, which resides at the heart of the Virgo cluster, is the second brightest galaxy in the cluster, only 0.2 mag fainter than the cluster’s brightest elliptical galaxy NGC 4472 (McConnell et al. 2011). Akin to NGC 4486, the giant elliptical NGC 4874 is the second brightest galaxy sitting at the center of the Coma cluster.
II.3. Archival galaxy images and surface brightness profiles
We used high-resolution HST imaging of the galaxies obtained mainly in the Wide Field Planetary Camera 2 (WFPC2) F814W, Advanced Camera for Surveys (ACS) WFC F814W/F850LP and Near Infrared Camera and Multi-Object Spectrometer (NICMOS) NIC2 F160W filters in order to minimise the obscuring effects of dust. HST WFPC2 F606W images were used for 2/12 galaxies with no obvious dust absorption (NGC 4874 and NGC 4889). These HST images were all retrieved from the Hubble Legacy Archive (HLA44 4 https://hla.stsci.edu) and processed through the standard HLA data reduction pipeline. Table 2 lists the HST programs, instruments and filters for the sample of 12 galaxies studied in this paper. The HST F814W, F850LP and F160W filters are analog to the Johnson-Cousins -band, -band and Johnson-Cousins -band filters, respectively. The full WFPC2 detector is a mosaic of three wide field cameras plus a smaller high-resolution planetary camera, yielding a 160 160 L-shaped field-of-view (FOV). The mosaic of the two ACS WFC CCD cameras covers a 202 202 rhomboidal area. The NIC2 images have a relatively smaller field of view of 19.2 19.2. The spatial scales of the final processed images are 0.05, 0.05 and 0.1 for the ACS WFC, NICMOS NIC2 and combined WFPC2 images, respectively (Table 2). Fig. 1 shows the HST images for the 12 sample galaxies.
BCGs55 5 For BCGs, the faint stellar envelopes are due to the intracluster light (ICL). and the most luminous elliptical galaxies tend to have extended, low surface brightness stellar envelopes, halos, (Morgan & Lesh 1965; Oemler 1974; Schombert 1986). Therefore, the extraction of accurate surface brightness profiles for such galaxies requires spatially extended images. The high-resolution HST ACS WFC images were sufficiently extended in radius to robustly determine the shapes of the outer parts of the light profiles for the two farthest (D 925 Mpc) galaxies in our sample (4C +74.13 and A2261-BCG), Fig. 1. For one sample galaxy (A3558-BCG), we extracted a composite surface brightness profile from the ACS/F814W images obtained as a part of the HST observing program 10429 under visits 17 and 21 (PI: J. Blakeslee), probing a large range in radius ().
| Galaxy | HST Program | HST Filter | HST image scale | Data at large radii | Field of View |
|---|---|---|---|---|---|
| (arcsec pixel-1) | (arcmin) | ||||
| (1) | (2) | (3) | (4) | (5) | (6) |
| NGC 1600 | 7886 | NICMOS/F160W | 005 | CGS -band | |
| NGC 4486 | 10543 | ACS/F814W | 005 | SDSS -band | |
| NGC 4874 | 6104 | WFPC2/F606W | 010 | SDSS -band | |
| NGC 4889 | 5997 | WFPC2/F606W | 010 | SDSS -band | |
| NGC 6166 | 9293 | ACS/F814W | 005 | SDSS -band | |
| 4C +74.13 | 10495 | ACS/F850LP | 005 | — | — |
| A0119-BCG | 8683 | WFPC2/F814W | 010 | SDSS -band | |
| A2147-BCG | 8683 | WFPC2/F814W | 010 | SDSS -band | |
| A2261-BCG | 12066 | ACS/F850LP | 005 | — | — |
| A3558-BCG | 10429 | ACS/F814W | 005 | HST ACS/F814W | |
| A3562-BCG | 8683 | WFPC2/F814W | 010 | 2MASS J-band | |
| A3571-BCG | 10429 | ACS/F814W | 005 | 2MASS J-band |
Notes.— Space- and ground-based imaging used for our sample of 12 extremely massive galaxies with kpc (i.e., ‘large-core galaxies’). Col. (1): galaxy name. Col. (2): HST programs. Program ID: GO-5997 (PI: J. Lucey); GO-6104 (PI: W. Harris); GO-7886 (PI: A. Quillen); GO-8683 (PI: R. van der Marel); GO-9293 (PI: H. Ford); GO-10429 (visits 17 and 21, PI: J. Blakeslee); GO-10495 (PI: B. McNamara); GO-10543 (PI: E. Baltz); and GO-12066 (PI: M. Postman). Cols. (3) and (4): HST filters and image scales. Cols. (5) and (6): data at large radii and the associated field of view. For NGC 1600, we combine the inner HST F160W/NICMOS NIC2 light profile () with the ground-based, Carnegie-Irvine Galaxy Survey (CGS) -band data at obtained using the du Pont 2.5 m telescope (Li et al. 2011). For A3558-BCG, we used ACS/F814W images obtained as a part of the HST observing program 10429 under visits 17 and 21 (PI: J. Blakeslee).
For the remaining 9/12 sample galaxies (NGC 1600, NGC 4486, NGC 4874, NGC 4889, NGC 6166, A0119-BCG, A2147-BCG, A3562-BCG and A3571-BCG), the high-resolution HST NICMOS, WFPC2 and ACS images were limited in radius to accurately describe the outer part of the galaxies’ light profiles and to perform reliable sky background subtraction (see Fig. 1). These galaxies’ HST light profiles at small radii (i.e., typically ) were matched with low-resolution, ground-based data at larger radii () determined from extended images from the SDSS66 6 https://www.sdss.org and 2MASS archives77 7 https://irsa.ipac.caltech.edu/Missions/2mass.html (see Table 2). An exception is NGC 1600, where we combine the high-resolution HST profile at small radii () with ground-based surface brightness profile at large radii () that was extracted by Li et al. 2011 from extended -band images obtained with the du Pont 2.5 m telescope. When possible, we used HST and ground-based images taken with similar filters. This was not the case for NGC 1600, A3562-BCG and A3571-BCG, where we matched light profiles extracted from images obtained using different filters (Table 2, see also Lauer et al. 2007b; Thomas et al. 2016). We find an excellent overlap between the HST light profiles of the galaxies and the corresponding ground-based data over the radial range, except for NGC 1600 where the overlap between the HST and ground-based data is over .
The full details of our data reduction steps and the surface brightness profile extraction techniques are given in Dullo et al. 2017; Dullo et al. 2018. The extraction of accurate surface brightness profiles depends on the careful masking of the bright foreground stars, low-luminosity neighbouring and background galaxies, and chip defects in the image. Initial masks were generated for the galaxies by running SEXTRACTOR (Bertin & Arnouts 1996), which were then complemented with manual masks. We follow the steps in Dullo et al. 2019 to subtract the model images of the target galaxies from the science images and to improve our initial masks. The composite surface brightness () and ellipticity () profiles of the full sample galaxies, extracted using the iraf task ELLIPSE (Jedrzejewski 1987), are available in Appendix A. Given that we shift the ground-based profiles to the match HST data, the composite surface brightness profiles are given in their respective HST filters (Fig. 1 and Appendix A).
We quote all magnitudes in the VEGA magnitude system.
III. Light profile modeling of BCGs and central dominant galaxies
As noted above, BCGs and the most luminous elliptical galaxies tend to exhibit faint stellar envelopes at large radii. This is evident by a light excess in their outer light distribution with respect to the de Vaucouleurs 1948 model, which is fit to the spheroidal88 8 The term “spheroid” is used here to refer to the underlying host galaxy in case of elliptical galaxies and the bulge for disc galaxies. components of the galaxies (e.g., Oemler 1974; Carter 1977; Dressler 1981; Lugger 1984; Schombert 1986; Gonzalez et al. 2003; Gonzalez et al. 2005; Zibetti et al. 2005).
The Sérsic 1963; Sérsic 1968 model describes the stellar light distributions of faint and intermediate-luminosity ( 20.5 mag) spheroids (see Dullo & Graham 2012; Dullo et al. 2016; Dullo et al. 2019). This model is written as
| (1) |
where is the intensity at the half-light (effective) radius (). The quantity for (Caon et al. 1993), is expressed as a function of the Sérsic index , and ensures that encloses half of the total luminosity. For and 1, the Sérsic model is a Gaussian function and an exponential function, respectively.
The surface brightness profiles of luminous ( mag) spheroids are well described by the core-Sérsic model, which is a combination of an inner power-law core and an outer Sérsic profile with a transition region (Graham et al. 2003; Trujillo et al. 2004). This model, discussed in detail in Dullo & Graham 2012, is given by
| (2) |
with
| (3) |
where is intensity at the core break radius , is the slope of the inner power-law region, and regulates the sharpness of the transition between the inner power-law core and the outer Sérsic profile. The parameters and are defined as in the Sérsic model.

III.1. Multi-component decomposition of large-core galaxies
In Dullo et al. 2017, the 1D and 2D decompositions of the high-resolution HST F702W and F450W data of the BCG IC 1101 revealed a Sérsic intermediate-scale component, an outer exponential halo and an inner Gaussian component that are additional to the core-Sérsic spheroid light distribution. This galaxy has the largest core size measured in any galaxy to date ( kpc). Following Dullo et al. 2017, we fit, here, the major-axis surface brightness profiles of the remaining 12 “large-core” (i.e., kpc) core-Sérsic galaxies (Table 1) using a point-spread function (PSF)-convolved core-Sérsic model. Fig. A1 shows the fit residual profiles and the corresponding root-mean-square (rms) residual values (). A single core-Sérsic model was adequate only for two of the 12 sample galaxies (NGC 4889 and A3558-BCG). Additional nuclear light components (i.e., AGN or nuclear star clusters) were identified in three sample galaxies (NGC 4486, NGC 6166 and A2147-BCG) and were modelled using a Gaussian or a Sérsic model. Of the 12 sample galaxies, nine have an outer stellar halo light which was well described by an exponential function. We find that the light profiles for two sample galaxies (NGC 4874 and A3571-BCG) are well described by a core-Sérsic spheroid, a Sérsic intermediate-scale component and an outer exponential halo model. In Section V.3, we show that the colors for these two objects gradually turn bluer towards larger radii, consistent with our multi-component light profile decompositions. In addition, Veale et al. 2017 showed that the velocity dispersion of NGC 4874 increases outward from km s-1 near the center to 350 km s-1 at , akin to that of the large-core galaxy IC 1101 having an intermediate-scale component. We also note that Seigar et al. 2007 modelled the -band ground-based data of NGC 4874 with poor seeing conditions (), excluding the inner data points, using a Sérsic spheroid plus a de Vaucouleurs stellar halo model. Due to the intermediate-scale component of the galaxy which was missed in the Seigar et al. 2007 modelling, their fit resulted in an incorrect, high Sérsic index () for the outer exponential halo.
The best-fitting parameters are determined by iteratively minimizing the rms residuals using the Levenberg-Marquardt optimisation algorithm (Dullo et al. 2017). For each iteration, the profiles of individual model components were convolved with the Gaussian point-spread function (PSF) and then summed to create the final model profile. Our PSF implementation is as in Dullo et al. 2017. The full widths at half-maximum (FWHMs) of the PSFs have been measured from bright stars in the HST images of the galaxies. Trujillo et al. 2001 noted that Moffat functions are numerically better suited for modelling the PSFs in HST images than Gaussian functions when the inner galaxy light profiles are steep. Fitting both Gaussian and Moffat PSF-convolved models to the HST light profiles of the BCG IC 1101 with a flat (i.e., an inner slope ) depleted core, Dullo et al. 2017 however showed that the best-fitting structural parameters remain unchanged irrespective of the choice of PSF. This should also be the case for the bulk (10/12) of our sample galaxies with flat cores (i.e., ). While the remaining two galaxies NGC 4486 and 4C +74.13 have , our Gaussian PSF-convolved models give excellent fits to the galaxies’ HST profiles (Appendix A). However, we admit the possibility that the inner Sérsic model component of NGC 4486 may be a poor fit to the nuclear source in the galaxy.
III.2. Spheroid magnitudes and stellar masses
The total integrated spheroid fluxes for the sample galaxies were computed using the best-fitting major-axis, core-Sérsic structural parameters and the ellipticities of the spheroids (Table 3 and Fig A2). We corrected these magnitudes for foreground Galactic extinction using reddening values taken from NED (Schlafly & Finkbeiner 2011). The magnitudes were also corrected for (1+)4 surface brightness dimming. To compare directly with previously published magnitudes (Lauer et al. 2007b; McNamara et al. 2009; Postman et al. 2012; Dullo & Graham 2014; Dullo et al. 2017), our magnitudes are converted into the -band vega magnitudes (see Table 3). To achieve this, first we extracted light profiles of five sample galaxies from archival HST images obtained in the -band filter or filters closer to the -band—NGC 4486, ACS/F606W (GO-10543, PI: E. Baltz); NGC 6166, WFPC2/F555W (GO-7265, PI: D. Geisler); A2261-BCG, ACS/F606W (GO-12066, PI: M. Postman); A3571-BCG, ACS/F475W (GO-10429, PI: J. Blakeslee); A3558-BCG, ACS/F475W (GO-12238, PI: W. Harris). Next, the total integrated magnitudes in the corresponding filters, calculated in the same manner as noted above, were converted into the -band magnitudes, when necessary using Fukugita et al. 1995, see Table 3. For the two most distant galaxies in our sample (MS0735-BCG and A2261-BCG), evolution- and K-corrections were performed utilizing the values reported in the literature (McNamara et al. 2009; Postman et al. 2012). Furthermore, the galaxy distances in Lauer et al. 2007a; McNamara et al. 2009; Postman et al. 2012 are somewhat different from those adopted here (see Table 1). Therefore, we adjusted the magnitudes from the literature to our distances.
We convert the spheroid luminosities () into stellar masses () using stellar mass-to-light () ratios which are obtained from Worthey 1994 assuming an old (12 Gyr) stellar population (see Table 5).

III.3. Comparison to previous fits
Here, we compare the values of our core-Sérsic and with those from the literature for the 12 galaxies (Table 3) and discuss notable discrepancies (see Fig. 2). It should be noted that this work has, for the first time, modeled the light profiles for full sample of 12 galaxies using a core-Sérsic model.
In general, the core-Sérsic break radii are in fair agreement with the cusp radii, but there are five discrepant data points (Fig. 2a). Our core-Sérsic break radii are (%) larger than the cusp radii reported for four galaxies in common with Lauer et al. 2007a, NGC 4874, NGC 4889, NGC 6166 and A2147-BCG, and for 4C +74.13 (McNamara et al. 2009). For comparison, the 1 uncertainty range of adopted in this paper is %. We believe the discrepancies in the break radii arise from differences in the (1) fitting models employed, (2) fitted radial extent of the galaxy light profiles and (3) treatment of distinct galaxy structural components. Our break radii are obtained from careful, multi-component (halo/intermediate-scale component/spheroid/nucleus) decompositions of spatially extended (i.e., typically ) light profiles. In contrast, Lauer et al. 2007a; McNamara et al. 2009 determined the cusp radii fitting the Nuker model to their 10 galaxy light profiles, without accounting for any additional light components.
As noted in the Introduction, the Nuker break radii poorly match the core-Sérsic break radii (see Fig. 2a). Of the ten galaxies in common with Lauer et al. 2007a, six (NGC 1600, NGC 6166, A2147-BCG, A3558-BCG, A3562-BCG and A3571-BCG) have Nuker break radii that differ from our core-Sérsic by more than %. Also, the Nuker break radii for 4C+74.13 (McNamara et al. 2009) and A2261-BCG (Postman et al. 2012) are roughly % larger than our values. We note that the Nuker99 9 The Sérsic model can approximate a power law profile for large values of . This means that the surface brightness distributions of some brightest cluster galaxies (BCGs) with large may be well described by a core-Sérsic model and also by a Nuker model (e.g., see Graham et al. 2003). break radii tend to be bigger (smaller) than our core-Sérsic break radii for spheroids with a Sersic index ().
We have also included a comparison of our break radii with those from similar studies in the literature which performed core-Sérsic model fits (Fig. 2a, NGC 4486, Richings et al. 2011; NGC 4486 and NGC 4889, Rusli et al. 2013; NGC 1600, Thomas et al. 2016). The agreement between our core-Sérsic break radii and those from the literature is remarkably good, except for the break radius of NGC 4486 (Rusli et al. 2013) which is 40% larger than ours. It appears that the Rusli et al. 2013 and for NGC 4486 are biased high due to the outer halo light of the galaxy that was not separately modeled. While Kormendy et al. 2009 identify excess halo light at large radii () with respect to their Sérsic model fit to the main body of the NGC 4486, Rusli et al. 2013 fit the core-Sérsic model to the entire radial extent () of the galaxy light profile from Kormendy et al. 2009. We find that our light profile for the galaxy is better described using a core-Sérsic model for spheroid plus a Gaussian function for the AGN (Fig. A1); this fit yields and .
Fig. 2b shows our magnitudes (Table 3) disagree with those from past works (Lauer et al. 2007b; McNamara et al. 2009; Postman et al. 2012), by typically more than 0.30 mag. Our spheroid luminosities are brighter than those from Lauer et al. 2007a for seven of the 10 galaxies that we have in common (NGC 1600, NGC 4486, NGC 4889, NGC 6166, A0119-BCG, A2147-BCG and A3558-BCG). This discrepancy arises primarily because all these seven galaxies have spheroids with (Table 3). For ‘regular’ elliptical galaxies, Lauer et al. 2007b used total or galaxy magnitudes from the Third Reference Catalogue of Bright Galaxies RC3 (de Vaucouleurs et al. 1991), which are determined by fitting the galaxy light profiles using the de Vaucouleurs 1948 function (i.e., = 4 Sérsic model). For BCGs, Lauer et al. 2007b estimated the spheroid luminosities fitting the model to the inner kpc light profiles and they argued that the halo light contribution to the BCGs’ light profiles over the fitted radial extents was insignificant. However, we find three BCGs in common with Lauer et al. 2007b, A2147-BCG, A3562-BCG and A3571-BCG, where the outer halo light contributes inside kpc (Appendix A). This in part has caused the Lauer et al. 2007b spheroid magnitudes for A3562-BCG and A3571-BCG to be brighter than ours. Not surprisingly, the Lauer et al. 2007b spheroid magnitudes for the two galaxies in the sample with an intermediate light component (NGC 4874 and A3571-BCG) are brighter than ours (see Tables 3 and 4).
| Galaxy | Type | HST Filter | |||||||||||||
| (mag arcsec-2) | (arcsec) | (kpc) | (arcsec) | (kpc) | (mag) | (mag) | (mag) | ||||||||
| (1) | (2) | (3) | (4) | (5) | (6) | (7) | (8) | (9) | (10) | (11) | (12) | (13) | (14) | (15) | (16) |
| NGC 1600 | E | F160W/NICMOS | 15.14 | 2.08 | 0.65 | 0.04 | 2 | 6.3 | 72.6 | 22.8 | 0.270 | -26.53 | -26.61 | 2.95 | -23.66 |
| NGC 4486 | E† | F814W/ACS | 16.41 | 5.80 | 0.64 | 0.24 | 5 | 6.2 | 185.9 | 20.6 | 0.021 | -24.86 | -24.92 | 1.33 | -23.59 |
| NGC 4874 | E† | F606W/WFPC2 | 19.05 | 3.25 | 1.63 | 0.13 | 2 | 4.0 | 4.9 | 2.5 | 0.099 | -22.06 | -22.18 | 0.33 | -21.85 |
| NGC 4889 | BCG | F606W/WFPC2 | 17.68 | 1.89 | 0.86 | 0.04 | 2 | 13.3 | 563.9 | 256.7 | 0.065 | -25.54 | -25.66 | 0.33 | -25.33 |
| NGC 6166 | BCG | F814W/ACS | 18.26 | 3.46 | 2.11 | 0.05 | 2 | 9.0 | 136.5 | 83.1 | 0.135 | -25.80 | -25.95 | 1.33 | -24.62 |
| 4C +74.13 | BCG | F850LP/ACS | 18.83 | 0.64 | 2.24 | 0.28 | 2 | 3.7 | 6.0 | 20.9 | 0.100 | -25.00 | -25.76 | 1.64 | -24.12 |
| A0119-BCG | BCG | F814W/WFPC2 | 17.34 | 0.78 | 0.67 | 0.10 | 5 | 6.8 | 112.5 | 96.1 | 0.074 | -25.58 | -25.82 | 1.31 | -24.51 |
| A2147-BCG | BCG | F814W/WFPC2 | 18.09 | 1.79 | 1.28 | 0.14 | 2 | 6.4 | 44.6 | 31.8 | 0.180 | -24.73 | -24.92 | 1.31 | -23.61 |
| A2261-BCG | BCG | F850LP/ACS | 18.69 | 0.75 | 2.71 | 0.00 | 5 | 2.1 | 4.9 | 17.6 | 0.036 | -25.33 | -26.34 | 1.80 | -24.54 |
| A3558-BCG | BCG | F814W/ACS | 18.08 | 1.39 | 1.30 | 0.03 | 2 | 5.4 | 131.9 | 123.7 | 0.029 | -26.45 | -26.73 | 1.33 | -25.40 |
| A3562-BCG | BCG | F814W/WFPC2 | 17.66 | 0.66 | 0.64 | 0.06 | 2 | 3.6 | 18.9 | 18.4 | 0.099 | -24.44 | -24.73 | 1.31 | -23.42 |
| A3571-BCG | BCG | F814W/ACS | 18.56 | 1.70 | 1.33 | 0.01 | 2 | 10.2 | 68.9 | 53.8 | 0.062 | -24.47 | -24.72 | 1.37 | -23.35 |
Notes.— Structural parameters from the core-Sérsic model fits to the major-axis surface brightness profiles of the spheroids of our large-core galaxies. Col. (1) galaxy name. The superscript ‘’ indicates the two second brightest cluster elliptical galaxies in the sample. Col. (2) morphological type. Col. (3) HST filters and instruments. Cols. (411) best-fitting core-Sérsic model parameters. Col. (12) galaxy ellipticity at the break radius . Col. (13) spheroid absolute magnitudes derived using our fit parameters (cols. 411). Spheroid magnitudes corrected for Galactic dust extinction using NED (Schlafly & Finkbeiner 2011), and surface brightness dimming are given in col. (14). For 4C +74.13 and A2261-BCG, we also carried out evolution- and -corrections using the values taken from McNamara et al. 2009 and Postman et al. 2012, respectively. Col. (15) =(HST filter)-. Col. (16) corrected, -band spheroid absolute magnitude. We estimate that the uncertainties on the core-Sérsic parameters , , and are 2.5%, 10%, 20% and 25%, respectively. The uncertainty on is 0.02 mag arcsec-2. These errors on the fit parameters were estimated following the techniques in Dullo et al. 2019.
| Galaxy | HST Filter | / | / | / | / | / | |||
|---|---|---|---|---|---|---|---|---|---|
| (mag arcsec-2) | (arcsec) | (mag) | (mag) | (mag) | (mag) | ||||
| (1) | (2) | (3) | (4) | (5) | (6) | (7) | (8) | (9) | (10) |
| NGC 1600 | F160W/NICMOS | 20.14/— | 29.1/— | — | 0.30/— | — | 11.21/ | -22.97/ | -20.02/— |
| NGC 4486 | F814W/ACS | —/— | —/— | — | —/— | 15.9 | —/— | —/— | —/— |
| NGC 4874 | F606W/WFPC2 | 23.56/23.2 | 175.3/46.5 | 0.80 | 0.2/0.00 | — | 10.59/12.48 | -24.67/-22.78 | -24.34/-22.45 |
| NGC 4889 | F606W/WFPC2 | —/— | —/— | — | —/— | — | —/— | —/— | —/— |
| NGC 6166 | F814W/ACS | 23.22/13.44 | 110.2/0.02 | 0.66 | 0.40/0.00 | — | 11.57/19.60 | -24.16/-16.12 | -22.83/-14.79 |
| 4C 74.13 | F850LP/ACS | 23.53/— | 43.3/— | — | 0.50/— | — | 14.11/— | -26.49/— | -24.85/— |
| A0119-BCG | F814W/WFPC2 | 23.24/— | 82.4/— | — | 0.32/— | — | 12.08/— | -24.50/— | -23.19/— |
| A2147-BCG | F814W/WFPC2 | 22.75/— | 85.1/— | — | 0.50/— | 20.2 | 11.86/ | -24.27/— | -22.96/— |
| A2261-BCG | F850LP/ACS | 22.30/— | 20.7/— | — | 0.20/— | — | 13.97/— | -26.95/— | -25.15/— |
| A3558-BCG | F814W/ACS | —/— | —/— | — | —/— | — | —/— | —/— | —/— |
| A3562-BCG | F814W/WFPC2 | 22.22/— | 68.9/— | — | 0.50/— | — | 11.79/— | -25.16/— | -23.85/— |
| A3571-BCG | F814W/ACS | 21.17/21.05 | 373.0/25.3 | 0.54 | 0.60/— | — | 7.31/12.23 | -29.08/-24.16 | -27.71/-22.79 |
Notes.—Structural parameters for additional light components. Col. (1) galaxy name. Col. (2) HST filters and instruments. Cols. (3-5) best-fitting parameters of the exponential halo/Sérsic model component. Cols. (6) ellipticity of the halo/Sérsic model component. Col. (7) apparent magnitude of the nucleus. Col. (8) apparent halo/Sérsic magnitude derived using our best-fitting exponential/Sérsic model parameters (cols. ). Col. (9) absolute halo/Sérsic model component magnitude corrected for Galactic dust extinction and surface brightness dimming. For 4C +74.13 and A2261-BCG, we also carried out evolution- and -corrections using the values taken from McNamara et al. 2009 and Postman et al. 2012, respectively. Col. (10) corrected, -band halo/Sérsic model component absolute magnitude.
| Galaxy | HST Filter | log () | log () | log () | log () | log () | log () | log () | ||
|---|---|---|---|---|---|---|---|---|---|---|
| (spheroid ) | (halo/Sérsic comp) | (-based) | (L-based) | (-based) | (-based/L-based/-based) | |||||
| (1) | (2) | (3) | (4) | (5) | (6) | (7) | (8) | (9) | (10) | (11) |
| NGC 1600 | F160W [N] | 1.60 | 12.18 | 10.73 | 10.49 | 10.67 | 10.23[d1] | 10.23[d1] | 10.23[d1] | 2.8/2.8/2.8 |
| NGC 4486 | F814W [A] | 3.20 | 12.12 | — | 9.96 | 10.46 | 9.76[d2] | [d2] | [d2] | 5.1/5.1/5.1 |
| NGC 4874 | F606W [W] | 3.80 | 11.32 | 12.31/11.56 | 10.23 | 10.81 | 8.91 | 8.98 | 10.54 | 79.8/67.6/1.9 |
| NGC 4889 | F606W [W] | 3.80 | 12.71 | — | 10.39 | 10.97 | 10.30 [d3] | 10.3[d3] | 10.3[d3] | 4.7/4.7/4.7 |
| NGC 6166 | F814W [A] | 3.20 | 12.53 | 11.81/8.60 | 10.71 | 11.21 | 9.14 | 10.47 | 10.68 | 117.3/5.5/3.4 |
| MS0735-BCG | F850LP [A] | 3.00 | 12.38 | 12.67 | 10.33 | 10.81 | 8.61 | 10.20 | 10.71 | 157.0/4.1/1.3 |
| A0119-BCG | F814W [W] | 3.20 | 12.49 | 11.97 | 9.66 | 10.17 | 9.04 | 10.41 | 10.08 | 13.5/0.6/1.2 |
| A2147-BCG | F814W [W] | 3.20 | 12.13 | 11.87 | 10.23 | 10.74 | 8.95 | 9.93 | 10.42 | 61.2/6.4/2.1 |
| A2261-BCG | F850LP [A] | 3.00 | 12.61 | 12.86 | 10.17 | 10.65 | 9.73 | 10.43 | 10.81 | 8.2/1.7/0.7 |
| A3558-BCG | F814W [A] | 3.20 | 12.84 | — | 10.13 | 10.63 | 8.70 | 10.89 | 10.43 | 85.7/0.6/1.7 |
| A3562-BCG | F814W [W] | 3.20 | 12.06 | 12.23 | 9.62 | 10.12 | 8.59 | 9.83 | 10.05 | 34.6/2.0/1.2 |
| A3571-BCG | F814W [A] | 3.20 | 12.04 | 13.78/11.81 | 10.25 | 10.76 | 9.31 | 9.79 | 10.44 | 28.0/9.3/2.1 |
Notes.—Col. (1) galaxy name. Col. (2) HST filters and instruments (NICMOCS, N; ACS, A and WFPC2, W). Col. (3) stellar mass-to-light () ratios are obtained from Worthey 1994 assuming a Gyr old stellar population. Cols. (4) and (5) stellar mass of the spheroid, halo and any additional Sérsic components. Col. (6) central stellar luminosity deficit in units of solar luminosity. Col. (7) central stellar mass deficit determined using cols. (3) and (6). Cols. (8), (9) and (10) SMBH masses predicted using the Graham & Scott 2013 “non-barred ” relation, their -band core-Sérsic relation and the “(direct SMBH)-based ” relation, see the text for details. For three galaxies, we use direct SMBH mass measurements obtained from three different sources and adjusted them to our distances: d1=Thomas et al. 2016; d2=Gebhardt et al. 2011; d3= McConnell et al. 2011. We assume a 10% uncertainty on to estimate the error on the predicted SMBH mass. Col. (11) ratios between mass deficit (col. 7) and black hole masses (cols. 8, 9 and 10), .
| Relation | OLS bisector fit | ||
| This work (12 galaxies) + Dullo et al. 2017 + Dullo & Graham 2014 | |||
| 0.18 dex | |||
| 0.47 dex | |||
| (11 direct masses) | 0.24 dex | ||
| ( derived for 30 galaxies | 0.61 dex | ||
| plus 11 direct masses) | |||
| ( derived for 30 galaxies | 0.44 dex | ||
| plus 11 direct masses) | |||
| 0.09 dex | |||
| 0.70 | |||
| 1.25 | |||
| Dullo & Graham 2014 | |||
| 0.18 dex | |||
| 0.30 dex | |||
| ( derived for 23 galaxies | 0.27 dex | ||
| plus 8 direct masses) | |||
| ( derived for 23 galaxies | 0.27 dex | ||
| plus 8 direct masses) | |||
| Relation | OLS bisector fit | r | |
| (for 9 large-core galaxies excluding | 0.54 | ||
| the large-core, group galaxy1010 10 If we include the only sample large-core, group galaxy NGC 1600 (with a low value Mpc-2, see Figs. 10 and A2), then for the 10 large-core galaxies the OLS bisector finds a relation between and with a slope of 2.40 1.03, an intercept of 0.68 0.17 and r 0.57. and the three | |||
| distant, D Mpc, sample large-core galaxies) | |||
| (for 10 large-core galaxies excluding | 0.32 | ||
| the three distant, D Mpc, sample | |||
| large-core galaxies) | |||
Notes.—Scatter in the vertical direction (). Pearson correlation coefficient (r).


IV. Scaling relations for core-Sérsic galaxies
Luminous early-type galaxies are known to exhibit tight scaling relations involving their central and global structural parameters (e.g., Faber et al. 1997; Dullo & Graham 2012; Rusli et al. 2013; Dullo & Graham 2014; Thomas et al. 2016). Rusli et al. 2013 investigated the correlation between the core-Sérsic break radius () and the velocity dispersion, spheroid absolute magnitude and SMBH mass for a sample of 23 core-Sérsic elliptical galaxies with kpc. In Dullo & Graham 2014, we explored a number of scaling relations involving and the break surface brightness () for a sample of 28 core-Sérsic early-type spheroids with kpc and mag mag. In this paper we combine these 28 core-Sérsic spheroids with kpc and (henceforth ‘normal-core spheroids’, Dullo & Graham 2014) and the 13 extremely massive spheroids () with kpc and mag (henceforth ‘massive large-core spheroids’, Tables 1 and 3) to explore whether or not extremely massive, large-core spheroids adhere to the structural scaling relations established by the relatively less massive, normal-core spheroids. Our 41(=28+13) galaxies represent the hitherto largest sample of core-Sérsic galaxies with detailed multi-component decompositions of the high-resolution, extended light profiles.


IV.1. Structural correlations with the core’s size: large-core versus normal-core spheroids
Fig. 3 shows a compilation of major-axis core-Sérsic model profiles for the 41 core-Sérsic spheroids (see also Appendix A). Also shown in this figure is a strong correlation between and with Pearson correlation coefficient r (see also Faber et al. 1997; Lauer et al. 2007b). We find that our massive large-core spheroids follow the tight sequence defined by the relatively less massive normal-core spheroids (Table 6).
In Fig. 4 we expand on Fig. 6a from Dullo & Graham 2014 and plot the relation between the core-Sérsic break radius () and -band spheroid absolute magnitude (). The dashed and solid lines are ordinary least squares (OLS) bisector regression fits (Feigelson & Babu 1992) to the () data set for the full sample of 41 core-Sérsic spheroids and the 28 normal-core spheroids, respectively. Because our full galaxy sample spans a wider range in than that of Dullo & Graham 2014, the new, well constrained relation for the full sample () has a slope steeper than the near-linear relation for the normal-core galaxies alone (, Dullo & Graham 2014). It is worth noting that the larger cores of extremely massive galaxies are consistent with these galaxies’ extremely bright spheroid magnitudes ( mag), although the inclusion of the 13 large-core galaxies has increased the vertical rms scatter around the relation in the log direction () by 57%, dex and dex (see Table 6). For reference, the slopes of the relations published by Faber et al. 1997; Laine et al. 2003; de Ruiter et al. 2005; Lauer et al. 2007b; Rusli et al. 2013 are 1.15, 0.72, 1.05 0.10, 1.32 0.11, and 1.28 0.18.
Finally, in Figs. 5, 6(a) and 6(b) we investigate whether there is an offset or break in the relation due to normal-core versus large-core spheroids. Of the full sample, 11/44 (3 large-core and 8 normal-core) galaxies have SMBH mass determined dynamically from stellar or gas kinematic measurements (e.g. Ferrarese & Ford 2005; see Table 5 and Dullo & Graham 2014). We refer to such SMBH masses as ‘direct’ SMBH masses. The OLS bisector finds a remarkably tight relation for these 11 galaxies (, r and 0.24 dex, see Fig. 5). Although we only have 11 galaxies with direct SMBH masses, the relation found here is in excellent agreement with the core-Sérsic relation reported by Thomas et al. 2016 for 20 core-Sérsic galaxies with direct SMBH mass measurements: log (pc) = (0.85 0.10) log () + (2.17 0.45). This strongly suggests that the relation (Table 6) is well constrained.
However, combining these 11 direct SMBH masses with predicted SMBHs for the remaining 30 galaxies without direct SMBH mass measurements, we find that large-core spheroids are offset systematically from the relation defined by the galaxy sample with measured (dotted lines) and from the sequence traced by the normal-core spheroids alone (solid lines, Figs. 6(a), 6(b) and Table 6). The slopes of the relations for the normal-core spheroids are different from those for the full sample (see Table 6). In Fig. 6(a), we used the Graham & Scott 2013 non-barred relation to predict the black hole masses for the remaining 30 galaxies without direct SMBH masses, while in Fig. 6(b) the predicted SMBH masses were based on the near-linear Graham & Scott 2013 -band core-Sérsic relation transformed here into the -band using (Fukugita et al. 1995). The offset nature of large-core spheroids at the high-mass end of the relations (Figs. 6a and 6b) suggest that either extremely massive galaxies have unusually large break radii or the and core-Sérsic relations underestimate SMBH masses in extremely massive galaxies, or both cases are true. However, given the tight , and relations (Figs. 3, 4 and 5), the observed offsets are likely due to underestimated SMBH masses (e.g., McConnell et al. 2011; McConnell et al. 2012; Volonteri & Ciotti 2013; Thomas et al. 2016; Mezcua et al. 2018). Indeed, the direct SMBH measurements in three large-core galaxies (NGC 1600, Thomas et al. 2016, NGC 4889, McConnell & Ma 2013 and Holm 15A, Mehrgan et al. 2019) reveal that, relative to the best-fitting relation, these galaxies are offset by dex towards large .
Also, combining the relation (Fig. 4) with the (Fig. 5) results in a steeper relation (, see Table 6) than the Graham & Scott 2013 -band core-Sérsic relation (), although the slopes of these two relations are consistent within the uncertainty. Extrapolating the relation (Fig. 5) to high masses, we find that the relation is a better predictor of than the relation for BCGs and central dominant galaxies, confirming the finding by other authors (Bernardi et al. 2007; Lauer et al. 2007b; McConnell et al. 2011; McConnell et al. 2012; Volonteri & Ciotti 2013; Mezcua et al. 2018; Phipps et al. 2019).
IV.2. Global structural relations for core-Sérsic galaxies
In a continued endeavor to determine if the scaling relations for normal-core spheroids continue to the large-core spheroids, here we investigate global structural relations involving , the effective (half-light) radius () and the Sérsic index () for our full sample of 41 core-Sérsic spheroids.
IV.2.1
In Fig. 7, we show the relation (Faber & Jackson 1976) relation for core-Sérsic spheroids. The OLS bisector yields for the 41 core-Sérsic spheroids, compared to the well-known (Faber & Jackson 1976) relation (). It has been shown that bright core-Sérsic galaxies follow a shallow relation (e.g., Malumuth & Kirshner 1981; Lauer et al. 2007b; Kormendy & Bender 2013; Sahu et al. 2019), whereas Sérsic galaxies with low luminosities ( mag) define a steeper relation (e.g., Held et al. 1992; Matković & Guzmán 2005), see Fig. 7. We have identified here a previously unreported substructure in the relation for core-Sérsic spheroids. This relation seems to have a break at mag1111 11 Assuming an old stellar population of , mag yields a stellar mass of for mag.(Fig. 7). At magnitudes brighter than this transition value, the relation flattens and exhibits larger scatter which may suggest a breakdown. The slope of our relation for the full sample () is shallower than that found for the normal-core spheroids alone (). In Fig. 7, we also show Sérsic and core-Sérsic galaxies from Lauer et al. 2007b to better demonstrate the breaks in the relation but these data points (Lauer et al. 2007b) are not included in the least-squares fits. The relation for Sérsic, normal-core and large-core core-Sérsic galaxies will be investigated in a forthcoming paper.
Our finding is consistent with the notion that major, dry mergers add the stellar mass, black hole mass and sizes in equal proportion while increasing the velocity dispersion only slightly (see also Section IV.2.2). In general, the velocity dispersion for local galaxies does not exceed km s-1 (Sheth et al. 2003; Lauer et al. 2007b; Bernardi et al. 2007). As such, the luminosity of large-core galaxies, which are thought to have undergone multiple successive dry mergers, would be unusually bright for the galaxies’ , compared to the normal-core galaxies. We agree with Bernardi et al. 2007 who found that BCGs follow a shallower relation than most (other) early-type galaxies (see also Oegerle & Hoessel 1991; Boylan-Kolchin et al. 2006). In contrast, Lauer et al. 2007b and Kormendy & Bender 2013 advocated for a single power-law relation for BCGs and other bright ellipticals with mag. However, the break in the relation near can easily be seen in Fig. 7 and Kormendy & Bender 2013. In fact Kormendy & Bender 2013 wrote that their core and coreless galaxies overlap over the luminosity range mag mag. As such their shallow core-Sérsic relation () is mainly driven by galaxies with mag.
IV.2.2 and
In Figs. 8(a) and 8(b), we investigate the behaviour of as a function of the effective radius () and Sérsic index (), Table 6. As noted by Dullo & Graham 2014, for a given the spheroids of core-Sérsic lenticular galaxies tend to be compact ( kpc), see also Dullo & Graham 2013; Graham 2013; Graham et al. 2015; de la Rosa et al. 2016. Excluding the 5 lenticular galaxies in our sample, we find that large-core and normal-core spheroids follow the same tight correlation between and . A symmetrical OLS fit to the 36(=415) core spheroids gives a near-linear relation with r ; our slope is slightly steeper than the relation for BCGs in Bernardi et al. 2007 .
We find a much weaker correlation between and for our 41 core-Sérsic spheroids. A symmetrical OLS fit finds with r (Table 6). Interestingly, however, the relation that we derive combining our , and relations for the full sample () has a slope which is consistent with those of the relations in Graham & Driver 2007 and Davis et al. 2019.
V. Discussion

V.1. Central stellar mass deficit
The central stellar mass deficits in core-Sérsic spheroids () are useful to explain if the large cores of BCGs and central dominant galaxies reflect the actions of overmassive SMBHs or intense core scouring via large amount of galactic merging or a combination of both. As mentioned in the introduction, the favoured mechanism for the creation of central stellar mass deficits is the three-body encounters of the core stars with the inspiraling binary SMBHs that form from dry major mergers (Begelman et al. 1980; Ebisuzaki et al. 1991; Faber et al. 1997; Milosavljević & Merritt 2001; Milosavljević et al. 2002). Using of -body simulations, Merritt 2006 first revealed that the accumulated stellar mass deficit that is generated by binary SMBHs after numbers of successive dry major mergers scales as , where is the total sum of the masses of the binary SMBHs.
In order to derive the central stellar mass deficits for the large-core galaxies, we follow the same prescription in Dullo & Graham 2014; Dullo et al. 2017; Dullo et al. 2018. The central stellar luminosity deficit () is computed as the difference in luminosity between inwardly-extrapolated outer Sérsic profile of the complete core-Sérsic model fit to the spheroid (Eq. 1) and the core-Sérsic model itself (Eq. 2). For each galaxy this luminosity deficit is converted into using the stellar mass-to-light ratios () given in Table 5. We measure stellar mass deficits for the large-core galaxies that are , larger than those for normal-core galaxies except for NGC 5419. The brightest cluster galaxy, NGC 5419, of the poor cluster Abell S753 is a normal-core galaxy with pc and (Dullo & Graham 2014).
Fig. 9 shows the mass deficits as a function of directly measured or predicted SMBH masses. For the 11 core-Sérsic galaxies in the sample with directly measured we find , consistent with spheroid formation via a reasonably large number of dry major merger events (110, Merritt 2006). This figure is consistent with ratio we find for the normal-core galaxies without direct ; using SMBH masses predicted based on the relation (Dullo & Graham 2014) gives . Our findings also agree with previous work which derived for normal-core galaxies using similar methods (e.g., Graham 2004; Ferrarese et al. 2006; Rusli et al. 2013; Dullo & Graham 2013; Dullo & Graham 2014; Dullo et al. 2018) and with Hopkins & Hernquist 2010 who calculated via a model-independent analysis of the light profiles, rather than determining the difference in luminosity between a Sérsic fit and a core-Sérsic fit as done here, finding . Our results can also be compared with studies which estimated the merger rates for massive galaxies from observations of close galaxy pairs, finding that massive galaxies have undergone 0.5 to 4 major mergers since (Bell et al. 2006; Conselice 2007; Liu et al. 2009; Edwards & Patton 2012; Bluck et al. 2012; Lidman et al. 2013; Man et al. 2016; Mundy et al. 2017; Duncan et al. 2019, e.g.,).
Of particular importance here is that the large-core galaxies without direct have predicted SMBH masses ( and ) that are undermassive for their stellar mass deficits (Fig. 9 and Table 5). This echos the offset nature of the predicted SMBH masses of large-core spheroids shown in Fig. 6. We find and . These figures correspond to unrealistically high number of major dry mergers () for the bulk (%) of the large-core spheroids. We argue that the excessive merger rates have arisen because the and relations significantly underestimate the SMBH masses for large-core galaxies (see Section IV.1). On the other hand, the relation for the core-Sérsic spheroids (Fig. 5) is such that the predicted SMBH masses for the large-core spheroids based on are typically a factor of 1.74.5 (and 1043), i.e., (and ), larger than expectations from the spheroid (and ), Table 5. If we use these based SMBH masses then the derived number of major, dry mergers for large-core galaxies would be (Table 5), in good agreement with observations and theoretical expectations in a hierarchical Universe.
It is worthwhile noting that enhanced core scouring can occur due to a gravitational radiation-recoiled SMBH1212 12 Interested readers are referred to Section 5.4 of Dullo & Graham 2014 and Section 6.1 of Dullo & Graham 2013 for further discussions on alternative mechanisms for the formation of enhanced depleted cores. (e.g., Redmount & Rees 1989; Boylan-Kolchin et al. 2004; Merritt et al. 2004; Gualandris & Merritt 2008). While substantial SMBH recoiling events would lower the inferred merger rates by a few, this process does not account for the unrealistically high values of quoted above. We also note the binary SMBH core scouring scenario assumes that the SMBH binaries coalesce in most merged galaxies via the emission of gravitational wave. The alternative scenario is multiple SMBH systems form (Liu et al. 2019, e.g.,), generating large stellar mass deficits due to the gravitational sling-shot ejection of the SMBHs (Kulkarni & Loeb 2012). This process would lead to a smaller SMBH mass, at odds with the tight correlation for core-Sérsic spheroids (Fig. 4). Furthermore, in Section V.2, we also show the excessive merger rates cannot be explained by the galaxy environment.
V.2. Impact of environment on the break radius and galaxy merger rate
Given the rarity of large-core galaxies, it is of interest to explore the impact of the environment on their break radii and major merger histories. All the large-core galaxies in our sample except for three (NGC 1600, NGC 4486 and NGC 4874) are classified as BCGs (Section II.2). NGC 1600 is the brightest member of the poor NGC 1600 group, whereas NGC 4486 and NGC 4874 are the second brightest cluster galaxies sitting at the centre of their host clusters.
Following Cappellari et al. 2011, we make use of two parameters ( and ) to obtain an estimate of the galaxy environment. The surface density is defined as /(), where is the radius, centred on a large-core galaxy, that encloses the 10 nearest neighbours with mag and the relative recession velocity of the galaxies 300 km s-1. Similarly, =/(), where is the radius centred on a large-core galaxy enclosing the 5 nearest neighbours with mag and 300 km s-1. The nearest neighbour identification, recession velocities () are based on NED, while the -band absolute galaxy magnitudes are from Hyperleda. We excluded the large-core galaxy 4C +74.13 with no robust data for its nearest neighbours in NED. The caveat here is that galaxies with mag may be too faint for detection at the distances of 4C +74.13 (D 925 Mpc), A2261-BCG (D 959 Mpc) and IC 1101 (D 363 Mpc), see Figs. 10, 11 and Appendix B. Therefore, we caution that A2261-BCG and IC 1101 can be biased toward having brighter nearest neighbours and low , compared to the other large-core galaxies with D 213 Mpc (see Appendix B).
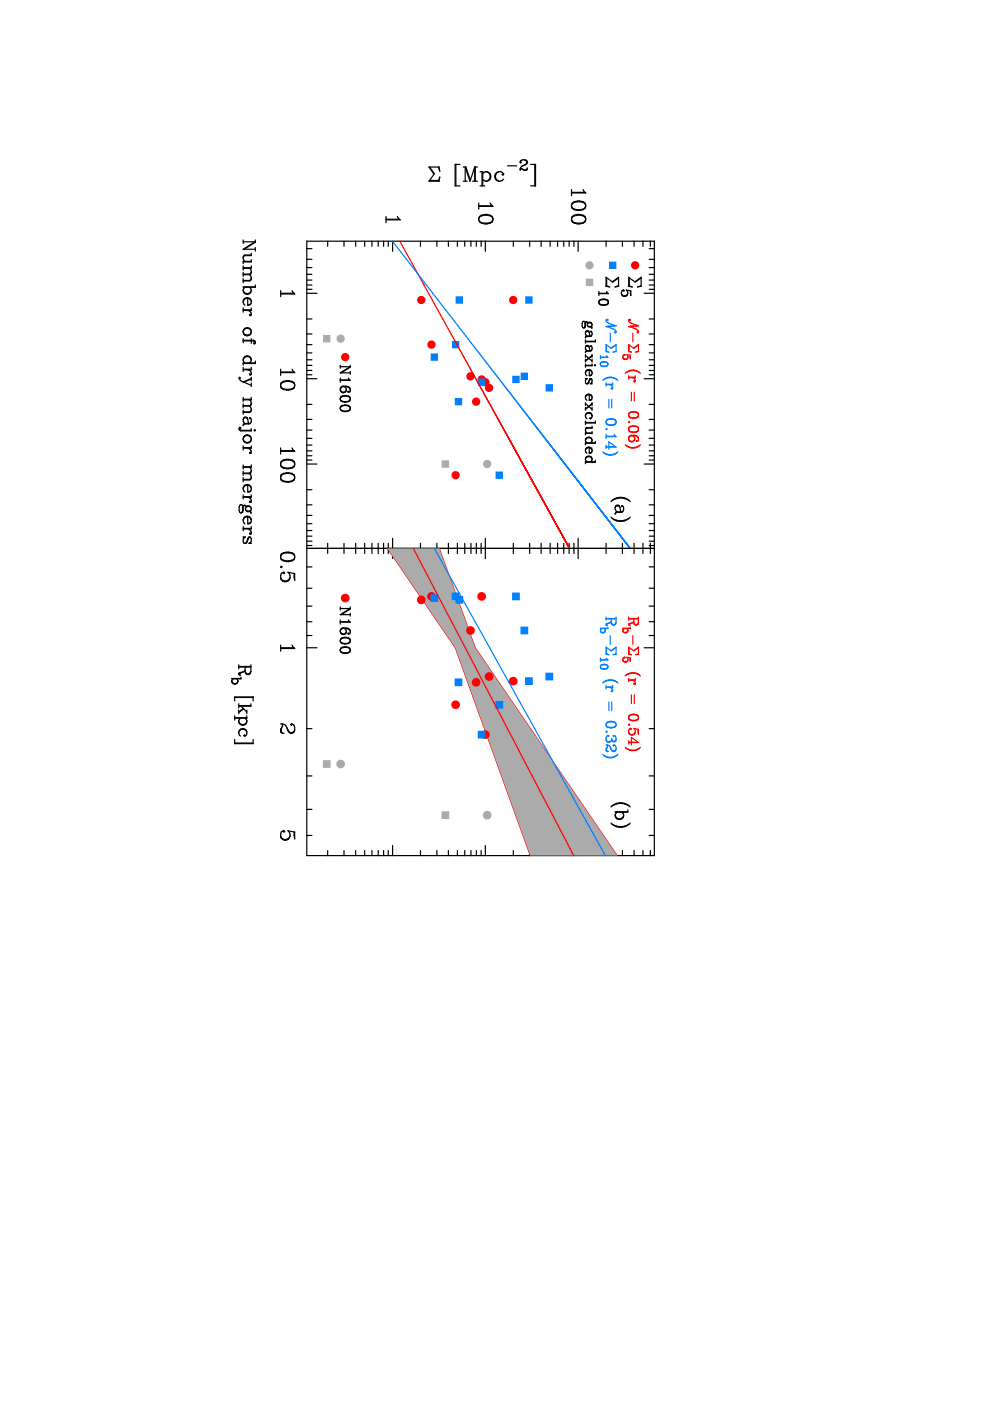
Fig. 10 shows the trends between environmental measures ( and ) and (a) number of major dry mergers and (b) break radius for the 12 large-core galaxies in our sample (see also Appendix B). The values of were derived using -based SMBH masses () or direct when available (see Table 5). Excluding A2261-BCG and IC 1101, we find significant correlations between and and , in the sense that large-core galaxies in high-density regions tend to exhibit larger than those in relatively low-density environments (Table 6). These correlations also reveal that more massive SMBHs are hosted by large-core galaxies that reside in denser environments. The Pearson correlation coefficients for the and relations are r and r , respectively.
We do not witness a correlation between the number of dry major mergers and the environment estimates and (r ). Accordingly, the excessive amount of major mergers that we obtained for a couple of large-core galaxies (, Section V.1 and Fig. 9) cannot be readily explained by their local projected environmental densities. Instead, the -based SMBH masses—which we used to calculate the merger rates ( , Merritt 2006) for the bulk (7/10) of the galaxies in Fig. 10—may explain the high values as well as the poor correlation, since appear to be undermassive for the break radii () and mass deficits () of large-core galaxies (Figs. 6 and 9).

In Fig. 11, we show histograms of absolute -band galaxy magnitudes () of the 10 nearest neighbours with mag for six large-core galaxies (NGC 4486, NGC 6166, A0119-BCG, A2147-BCG, A3558-BCG and IC 1101). These six large-core galaxies are selected to have representative break radii for the large-core galaxy population. We cannot presently reach a firm conclusion, but there is a hint that large-core galaxies with larger break radii and high have brighter companions (see also Appendix B). This reinforces the idea that the most massive galaxies experience a higher proportion of mergers between massive spheroidal systems.

V.3. Formation of core-Sérsic galaxies: “large-core” versus “normal-core” galaxies
We postulate that both “large-core” and “normal-core” core-Sérsic spheroids are built through a reasonably large number of successive dry major mergers () involving SMBHs (e.g., Faber et al. 1997; Kormendy 1999; Laine et al. 2003; Trujillo et al. 2004; Bell et al. 2006; Ferrarese et al. 2006; Lauer et al. 2007b; Kormendy et al. 2009; Liu et al. 2009; Bernardi et al. 2011; Rusli et al. 2013; Dullo & Graham 2013; Dullo & Graham 2014; Dullo & Graham 2015; Dullo et al. 2017; Dullo et al. 2018). In the previous sections we have shown that “large-core” spheroids of BCGs and central dominant galaxies with kpc, mag, are extremely massive (i.e., ). The same , , and relations defined by the “normal-core” core-Sérsic spheroids with kpc, mag mag, and stellar masses hold up at higher masses for the large-core spheroids. This is also the case for the relation when using directly measured SMBH masses.
The bulk (77%) of our large-core galaxies are BCGs, which is unsurprising as BCGs are predicted to experience a more intense merging and accretion events than galaxies with relatively low luminosities. Our findings hint that large-core spheroids are more likely to undergo a higher proportion of dry major mergers than the normal-core spheroids. Although we only have three large-core spheroids with measured , we find for these spheroids, whereas the bulk (6/8) of our normal-core spheroids with measured have , see Fig. 9. This is in line with the analytic and semi-analytic study by Volonteri & Ciotti 2013, however see Savorgnan & Graham 2015. Krajnović et al. 2018 also found that about half of the most massive galaxies () exhibit prolate-like rotation, consistent with these galaxies being products of dry major mergers. The depleted cores and stellar mass deficits in large-core spheroids likely reflect the cumulative effect of multiple dry mergers and the ensuing excavation of inner stars from the core by coalescing, overmassive black hole binaries with a final mass (Sections IV.1 and V.1), typically a factor of 1.74.5 (and 1043) larger than the SMBH masses estimated using the spheroids’ (and ). In passing we note that Mezcua et al. 2018 wrote that 40% of their sample of 72 BCGs at redshift of must have to lie on the fundamental plane of black hole accretion. The analytic arguments by King & Nealon 2019 predict present-day galaxies with overmassive black holes that lie above the relation may be descendants of the compact blue nuggets formed at , suggesting an evolutionary link between the high-redshift blue nuggets and large-core galaxies.
The higher prevalence of dry mergers associated with large-core spheroids can explain the break that we identified for the first time in the core-Sérsic relation occurring at mag, not to be confused with the change in the slope of the relation due to core-Sérsic versus Sérsic galaxies. The prediction that major, dry mergers add the stellar mass, black hole mass and sizes in equal proportion while increasing the velocity dispersion only slightly (e.g., Nipoti et al. 2003; Ciotti et al. 2007; Oser et al. 2012; Hilz et al. 2013) would imply that the relation may not hold across the full mass range of core-Sérsic spheroids. We find a flattening of the slope of the relation and larger scatter at the extremely massive end, where the velocity dispersions of the large-core spheroids increase only slightly with , compared to the relatively steep relation for normal-core galaxies (Fig. 7).
Turning to the intermediate- and large-scale components, as noted in Section III.1, of the 13 large-core galaxies in our sample 10 have low surface brightness outer stellar halos with exponential-like distribution of stars and with physical scales of kpc (Appendix A1 and Dullo et al. 2017, see also Seigar et al. 2007; Pierini et al. 2008; Alamo-Martínez & Blakeslee 2017). The spheroid-to-halo effective radius ratios for the large-core galaxies are (Tables 3 and 4). Three out of these 10 large-core galaxies (NGC 4874, A3571 and IC 1101) also exhibit intermediate-scale components. The color maps for these three galaxies become gradually bluer towards larger radii (see Fig.12 and Dullo et al. 2017). The color maps of NGC 4874 and A3571 (Fig. 12) were created adopting the same prescription described in Dullo et al. 2017. Coupled with our decompositions, these color maps suggest different origins for the inner, red spheroid with a high concentration of old stars and the intermediate- and large-scale components with relatively bluer colors. We find that, when present, the fractional contributions of the outer halos and intermediate-scale components are typically 1560% and 20% of the total (i.e., spheroid + intermediate-component + halo) flux, respectively (similar results have been previously reported by e.g., Gonzalez et al. 2005; Seigar et al. 2007; Oser et al. 2010; Jiménez-Teja & Dupke 2016).
It appears plausible that the natural assembly pathways for the intermediate-scale and outer halo components of large-core galaxies are significant accretion of less massive neighbours and the accumulation of stars stripped during galaxy-galaxy encounters occurring at (e.g., Seigar et al. 2007; Zolotov et al. 2009; Naab et al. 2009; Oser et al. 2010; Donzelli et al. 2011; Hilz et al. 2012; Hilz et al. 2013; Johansson et al. 2012; Burke et al. 2015; Cooper et al. 2015; Rodriguez-Gomez et al. 2016; Dullo et al. 2017; Dullo et al. 2018; Montes & Trujillo 2018; Pillepich et al. 2018). A small contribution to the intermediate-components and halo lights could come from core stars which are gravitationally ejected by the SMBH binaries and accumulate at large radii outside the core or escape from the spheroid at high velocities (Hills 1988; O’Leary & Loeb 2008; Brown et al. 2012, e.g.,). The masses of these ejected stars (i.e., the stellar mass deficits) in large-core galaxies are typically 1020% (and 13% ) of the stellar masses of their intermediate- (and outer halo) components (Table 5). Moreover, the observed trend of outwardly rising ellipticity for the large-core galaxies, except for the only group galaxy in our sample, NGC 1600 (Appendix A) suggests that the halo (and perhaps also the intermediate-scale component) stars at large radii trace the global cluster potential rather than the host spheroid potential (di Tullio 1979; Porter et al. 1991; Postman & Lauer 1995; Dubinski 1998; Gonzalez et al. 2005; Khosroshahi et al. 2006; West et al. 2017, e.g.,).
VI. Conclusions
Motivated by the need to re-investigate the formation and structural scaling relations of massive galaxies over a wide dynamic range in spheroid luminosity and stellar mass, we have extracted composite (HST WFPC2, ACS and NICMOS plus ground-based) major-axis surface brightness and ellipticity profiles for 12 extremely massive core-Sérsic galaxies (9 BCGs, 2 second brightest cluster galaxies and 1 brightest group galaxy) with core sizes kpc. We perform careful, multi-component (halo/intermediate-scale component/spheroid/nucleus) decompositions of these composite light profiles which typically cover a large radial range arcsec. In so doing, we modelled the spheroid with a core-Sérsic profile and, when present, we fit an exponential function to the outer halo, a Sérsic model to the intermediate-scale component and a Gaussian or a Sérsic profile to the nucleus. This is the first time this has been done for the full sample of 12 galaxies. The decompositions yield an excellent fit to the light profiles of the galaxies with a median rms scatter of 0.031 mag arcsec-2.
We additionally included the galaxy with largest depleted core
detected to date IC 1101 ( kpc) from
Dullo et al. 2017 and 28 core-Sérsic early-type galaxies
with kpc from Dullo & Graham 2014. This
resulted in the largest sample of 41 core-Sérsic galaxies studied to
date consists of 13 “large-core” galaxies having kpc and the
remaining 28 “normal-core” galaxies with kpc. Our
principal conclusions are as follows:
(1) We find that large-core spheroids have -band absolute magnitude
mag, sizes kpc and
stellar masses that are typically , whereas
for the relatively less luminous normal-core spheroids ( mag
23.60 mag), kpc and
. Of the 13 large-core
galaxies, seven have kpc. The depleted cores and
stellar mass deficits in large-core spheroids are likely due to the
cumulative effect of multiple dry mergers and the ensuing core
scouring by coalescing, overmassive SMBH binaries with a final mass
. For such galaxies, an additional
mechanism that can contribute to the large cores/stellar
mass deficits is oscillatory core passages by a (gravitational
radiation)-kicked SMBH.
(2) The detailed multi-component decompositions of the large-core
galaxies reveal the bulk () of them exhibit low surface
brightness outer stellar halos with exponential-like stellar
distribution and physical scales of kpc.
(3) We present updated structural parameter relations for our 41
massive galaxies with a large range in galaxy luminosity
(Section IV). We find that large-core spheroids follow the
same , , and
relations defined by the relatively less massive,
normal-core spheroids. The strong correlations between ,
and the break surface brightness () and the spheroid
luminosity () for core-Sérsic galaxies are such that
and
. We also find a tight,
linear relation between the spheroid’s luminosity and size for massive
(core-Sérsic) ellipticals and BCGs such
that .
(4) We find a strong log-linear relation for 11
sample galaxies with directly determined SMBH masses
(): 3 of these 11
galaxies are large-core galaxies.
(5) For normal-core galaxies, the break radius correlates
equally well with the directly determined SMBH mass
() and the SMBH masses predicted using the
and the core-Sérsic relations
( and ,
Graham & Scott 2013). In contrast, our large host galaxy
luminosity range has revealed significant offsets in the
and
diagrams at the highest galaxy
masses (i.e., ). The offset is more
pronounced in the former relation. The SMBH masses of large-core
galaxies estimated from the relation are roughly an
order of magnitude larger than those from the
relation. We determined that these offsets arise because the SMBH
masses in the most massive galaxies (i.e.,
) are high relative to what is expected
from their velocity dispersions or bulge luminosities. For such
galaxies, we recommend the relation
should be used for determining
the SMBH masses.
(6) We have measured central stellar mass deficits in large-core
galaxies (), which when compared to
, and
yield ratios of
, and , respectively. While the
former ratio translates to a reasonably large merger rate (i.e.,
), the latter two correspond to unrealistically
large number of major dry mergers () for the
bulk (%) of the large-core spheroids. These findings strengthen
the conclusions above: the central SMBH mass in large-core galaxies is
considerably larger than the expectations from the spheroid
and . On the other hand, the predicted SMBH masses for the large-core
spheroids based on are of order
(Table 5), and typically a
factor of 1.74.5 (and 1043), i.e.,
(and ), larger than the SMBH masses
estimated using the spheroids’ (and ). Using these -based
SMBH masses for the large-core galaxies brings down the merger rate to
, in good agreement
with observations and theoretical expectations.
(7) We find significant correlations between and galaxy
environment estimates and , i.e.,
r and r , respectively.
Large-core galaxies in high-density regions tend to
exhibit larger than those in relatively low-density
environments. Our findings also reveal that more massive SMBHs are
hosted by large-core galaxies that reside in denser environments. In
contrast, the galaxy merger rate exhibits no significant dependence
the environment estimates, we therefore rule out the excessive amount
of major mergers that we obtained for a couple of large-core galaxies
()
being due to higher local projected environmental densities.
(8) Our results hint that large-core spheroids are more likely to
experience a higher proportion of dry major mergers than the
normal-core spheroids (see e.g., Volonteri & Ciotti 2013).
Although our sample only contains three large-core spheroids with
measured , we find for these
spheroids, compared to for the bulk
(6/8) of our normal-core spheroids with measured .
(9) We discover a break in the core-Sérsic relation occurring at mag, not to be confused with the change in the slope of the relation due to core-Sérsic versus Sérsic galaxies. We attribute this to be the result of large-core spheroids undergoing more dry major mergers than the relatively less massive, normal-core spheroids.
Our findings carry significant implications for studies which attempt to predict SMBH masses in the most massive galaxies using their spheroid luminosity () or . Future high-resolution dynamical SMBH mass measurements by modelling stellar or ionized gas kinematics in galaxies with mag and are imperative to further study the processes that shaped the growth of the most massive galaxies and their SMBHs.
VII. ACKNOWLEDGMENTS
I thank the referee for their timely report and constructive suggestions that improved the original manuscript. I am grateful to Berta Margalef-Bentabol, Cristina Cabello and Mario Chamorro-Cazorla for their comments on this work. I acknowledge support from a Spanish postdoctoral fellowship ‘Ayudas 1265 para la atracción del talento investigador. Modalidad 2: jóvenes investigadores.’ funded by Comunidad de Madrid under grant number 2016-T2/TIC-2039. I acknowledge financial support from the Spanish Ministry of Science, Innovation and Universities (MCIUN) under grant numbers AYA2016-75808-R and RTI2018-096188-B-I00. This research made use of APLpy, an open-source plotting package for Python (Robitaille & Bressert 2012) and the NASA/IPAC Extragalactic Database (NED), which is operated by the Jet Propulsion Laboratory, California Institute of Technology, under contract with the National Aeronautics and Space Administration. Based on observations made with the NASA/ESA Hubble Space Telescope, and obtained from the Hubble Legacy Archive, which is a collaboration between the Space Telescope Science Institute (STScI/NASA), the Space Telescope European Coordinating Facility (ST-ECF/ESA) and the Canadian Astronomy Data Centre (CADC/NRC/CSA). This publication makes use of data products from the Two Micron All Sky Survey, which is a joint project of the University of Massachusetts and the Infrared Processing and Analysis Center/California Institute of Technology, funded by the National Aeronautics and Space Administration and the National Science Foundation.
References
- Alamo-Martínez & Blakeslee (2017) Alamo-Martínez, K. A., & Blakeslee, J. P. 2017, ApJ, 849, 6
- Baldry et al. (2012) Baldry, I. K., Driver, S. P., Loveday, J., et al. 2012, MNRAS, 421, 621
- Barnes (1988) Barnes, J. E. 1988, ApJ, 331, 699
- Barrows et al. (2012) Barrows, R. S., Stern, D., Madsen, K., et al. 2012, ApJ, 744, 7
- Begelman et al. (1980) Begelman, M. C., Blandford, R. D., & Rees, M. J. 1980, Nature, 287, 307
- Bell et al. (2006) Bell, E. F., Phleps, S., Somerville, R. S., et al. 2006, ApJ, 652, 270
- Bender et al. (2015) Bender, R., Kormendy, J., Cornell, M. E., & Fisher, D. B. 2015, ApJ, 807, 56
- Benson et al. (2003) Benson, A. J., Bower, R. G., Frenk, C. S., et al. 2003, ApJ, 599, 38
- Bernardi et al. (2007) Bernardi, M., Hyde, J. B., Sheth, R. K., Miller, C. J., & Nichol, R. C. 2007, AJ, 133, 1741
- Bernardi et al. (2011) Bernardi, M., Roche, N., Shankar, F., & Sheth, R. K. 2011, MNRAS, 412, L6
- Bertin & Arnouts (1996) Bertin, E., & Arnouts, S. 1996, A&AS, 117, 393
- Bianchi et al. (2008) Bianchi, S., Chiaberge, M., Piconcelli, E., Guainazzi, M., & Matt, G. 2008, MNRAS, 386, 105
- Binney & Mamon (1982) Binney, J., & Mamon, G. A. 1982, MNRAS, 200, 361
- Bluck et al. (2012) Bluck, A. F. L., Conselice, C. J., Buitrago, F., et al. 2012, ApJ, 747, 34
- Bonfini et al. (2015) Bonfini, P., Dullo, B. T., & Graham, A. W. 2015, ApJ, 807, 136
- Bonfini & Graham (2016) Bonfini, P., & Graham, A. W. 2016, ApJ, 829, 81
- Boylan-Kolchin et al. (2004) Boylan-Kolchin, M., Ma, C.-P., & Quataert, E. 2004, ApJ, 613, L37
- Boylan-Kolchin et al. (2006) —. 2006, MNRAS, 369, 1081
- Brown et al. (2012) Brown, W. R., Cohen, J. G., Geller, M. J., & Kenyon, S. J. 2012, ApJ, 754, L2
- Burke et al. (2015) Burke, C., Hilton, M., & Collins, C. 2015, MNRAS, 449, 2353
- Burke-Spolaor (2011) Burke-Spolaor, S. 2011, MNRAS, 410, 2113
- Byun et al. (1996) Byun, Y.-I., Grillmair, C. J., Faber, S. M., et al. 1996, AJ, 111, 1889
- Caon et al. (1993) Caon, N., Capaccioli, M., & D’Onofrio, M. 1993, MNRAS, 265, 1013
- Cappellari et al. (2011) Cappellari, M., Emsellem, E., Krajnović, D., et al. 2011, MNRAS, 416, 1680
- Carollo et al. (1997) Carollo, C. M., Franx, M., Illingworth, G. D., & Forbes, D. A. 1997, ApJ, 481, 710
- Carter (1977) Carter, D. 1977, MNRAS, 178, 137
- Ciotti et al. (2007) Ciotti, L., Lanzoni, B., & Volonteri, M. 2007, ApJ, 658, 65
- Comerford et al. (2015) Comerford, J. M., Pooley, D., Barrows, R. S., et al. 2015, ApJ, 806, 219
- Conselice (2007) Conselice, C. J. 2007, in IAU Symposium, Vol. 235, Galaxy Evolution across the Hubble Time, ed. F. Combes & J. Palouš, 381–384
- Cooper et al. (2015) Cooper, A. P., Gao, L., Guo, Q., et al. 2015, MNRAS, 451, 2703
- Crane et al. (1993) Crane, P., Stiavelli, M., King, I. R., et al. 1993, AJ, 106, 1371
- Davies et al. (1983) Davies, R. L., Efstathiou, G., Fall, S. M., Illingworth, G., & Schechter, P. L. 1983, ApJ, 266, 41
- Davis et al. (2019) Davis, B. L., Graham, A. W., & Cameron, E. 2019, ApJ, 873, 85
- de la Rosa et al. (2016) de la Rosa, I. G., La Barbera, F., Ferreras, I., et al. 2016, MNRAS, 457, 1916
- De Lucia & Blaizot (2007) De Lucia, G., & Blaizot, J. 2007, MNRAS, 375, 2
- de Ruiter et al. (2005) de Ruiter, H. R., Parma, P., Capetti, A., et al. 2005, A&A, 439, 487
- de Vaucouleurs (1948) de Vaucouleurs, G. 1948, Annales d’Astrophysique, 11, 247
- de Vaucouleurs et al. (1991) de Vaucouleurs, G., de Vaucouleurs, A., Corwin, Jr., H. G., et al. 1991, Third Reference Catalogue of Bright Galaxies. Volume I: Explanations and references. Volume II: Data for galaxies between 0h and 12h. Volume III: Data for galaxies between 12h and 24h.
- di Tullio (1979) di Tullio, G. A. 1979, A&AS, 37, 591
- Donzelli et al. (2011) Donzelli, C. J., Muriel, H., & Madrid, J. P. 2011, ApJS, 195, 15
- Dressler (1981) Dressler, A. 1981, ApJ, 243, 26
- Dubinski (1998) Dubinski, J. 1998, ApJ, 502, 141
- Dullo & Graham (2012) Dullo, B. T., & Graham, A. W. 2012, ApJ, 755, 163
- Dullo & Graham (2013) —. 2013, ApJ, 768, 36
- Dullo & Graham (2014) —. 2014, MNRAS, 444, 2700
- Dullo & Graham (2015) —. 2015, ApJ, 798, 55
- Dullo et al. (2017) Dullo, B. T., Graham, A. W., & Knapen, J. H. 2017, MNRAS, 471, 2321
- Dullo et al. (2016) Dullo, B. T., Martínez-Lombilla, C., & Knapen, J. H. 2016, MNRAS, 462, 3800
- Dullo et al. (2018) Dullo, B. T., Knapen, J. H., Williams, D. R. A., et al. 2018, MNRAS, 475, 4670
- Dullo et al. (2019) Dullo, B. T., Chamorro-Cazorla, M., Gil de Paz, A., et al. 2019, ApJ, 871, 9
- Duncan et al. (2019) Duncan, K., Conselice, C. J., Mundy, C., et al. 2019, arXiv e-prints, arXiv:1903.12188
- Ebisuzaki et al. (1991) Ebisuzaki, T., Makino, J., & Okumura, S. K. 1991, Nature, 354, 212
- Edwards & Patton (2012) Edwards, L. O. V., & Patton, D. R. 2012, MNRAS, 425, 287
- Efstathiou et al. (1988) Efstathiou, G., Ellis, R. S., & Peterson, B. A. 1988, MNRAS, 232, 431
- Faber & Jackson (1976) Faber, S. M., & Jackson, R. E. 1976, ApJ, 204, 668
- Faber et al. (1997) Faber, S. M., Tremaine, S., Ajhar, E. A., et al. 1997, AJ, 114, 1771
- Feigelson & Babu (1992) Feigelson, E. D., & Babu, G. J. 1992, ApJ, 397, 55
- Ferrarese & Ford (2005) Ferrarese, L., & Ford, H. 2005, Space Sci. Rev., 116, 523
- Ferrarese & Merritt (2000) Ferrarese, L., & Merritt, D. 2000, ApJ, 539, L9
- Ferrarese et al. (1994) Ferrarese, L., van den Bosch, F. C., Ford, H. C., Jaffe, W., & O’Connell, R. W. 1994, AJ, 108, 1598
- Ferrarese et al. (2006) Ferrarese, L., Côté, P., Jordán, A., et al. 2006, ApJS, 164, 334
- Fukugita et al. (1995) Fukugita, M., Shimasaku, K., & Ichikawa, T. 1995, PASP, 107, 945
- Gebhardt et al. (2011) Gebhardt, K., Adams, J., Richstone, D., et al. 2011, ApJ, 729, 119
- Gebhardt et al. (1996) Gebhardt, K., Richstone, D., Ajhar, E. A., et al. 1996, AJ, 112, 105
- Gebhardt et al. (2000) Gebhardt, K., Bender, R., Bower, G., et al. 2000, ApJ, 539, L13
- Gebhardt et al. (2003) Gebhardt, K., Richstone, D., Tremaine, S., et al. 2003, ApJ, 583, 92
- Gonzalez et al. (2003) Gonzalez, A. H., Zabludoff, A. I., & Zaritsky, D. 2003, Ap&SS, 285, 67
- Gonzalez et al. (2005) —. 2005, ApJ, 618, 195
- Goulding et al. (2019) Goulding, A. D., Pardo, K., Greene, J. E., et al. 2019, arXiv e-prints, arXiv:1907.03757
- Graham (2004) Graham, A. W. 2004, ApJ, 613, L33
- Graham (2013) —. 2013, Elliptical and Disk Galaxy Structure and Modern Scaling Laws, ed. T. D. Oswalt & W. C. Keel, 91
- Graham (2016) Graham, A. W. 2016, in Astrophysics and Space Science Library, Vol. 418, Galactic Bulges, ed. E. Laurikainen, R. Peletier, & D. Gadotti, 263
- Graham & Driver (2007) Graham, A. W., & Driver, S. P. 2007, ApJ, 655, 77
- Graham et al. (2015) Graham, A. W., Dullo, B. T., & Savorgnan, G. A. D. 2015, ApJ, 804, 32
- Graham et al. (2003) Graham, A. W., Erwin, P., Trujillo, I., & Asensio Ramos, A. 2003, AJ, 125, 2951
- Graham & Scott (2013) Graham, A. W., & Scott, N. 2013, ApJ, 764, 151
- Gualandris & Merritt (2008) Gualandris, A., & Merritt, D. 2008, ApJ, 678, 780
- Held et al. (1992) Held, E. V., de Zeeuw, T., Mould, J., & Picard, A. 1992, AJ, 103, 851
- Hills (1988) Hills, J. G. 1988, Nature, 331, 687
- Hilz et al. (2013) Hilz, M., Naab, T., & Ostriker, J. P. 2013, MNRAS, 429, 2924
- Hilz et al. (2012) Hilz, M., Naab, T., Ostriker, J. P., et al. 2012, MNRAS, 425, 3119
- Hlavacek-Larrondo et al. (2012) Hlavacek-Larrondo, J., Fabian, A. C., Edge, A. C., & Hogan, M. T. 2012, MNRAS, 424, 224
- Hopkins & Hernquist (2010) Hopkins, P. F., & Hernquist, L. 2010, MNRAS, 407, 447
- Hopkins et al. (2009) Hopkins, P. F., Lauer, T. R., Cox, T. J., Hernquist, L., & Kormendy, J. 2009, ApJS, 181, 486
- Hyde et al. (2008) Hyde, J. B., Bernardi, M., Sheth, R. K., & Nichol, R. C. 2008, MNRAS, 391, 1559
- Jaffe et al. (1994) Jaffe, W., Ford, H. C., O’Connell, R. W., van den Bosch, F. C., & Ferrarese, L. 1994, AJ, 108, 1567
- Jedrzejewski (1987) Jedrzejewski, R. I. 1987, MNRAS, 226, 747
- Jiménez-Teja & Dupke (2016) Jiménez-Teja, Y., & Dupke, R. 2016, ApJ, 820, 49
- Johansson et al. (2012) Johansson, P. H., Naab, T., & Ostriker, J. P. 2012, ApJ, 754, 115
- Kauffmann et al. (1993) Kauffmann, G., White, S. D. M., & Guiderdoni, B. 1993, MNRAS, 264, 201
- Khosroshahi et al. (2006) Khosroshahi, H. G., Ponman, T. J., & Jones, L. R. 2006, MNRAS, 372, L68
- King & Nealon (2019) King, A., & Nealon, R. 2019, MNRAS, 487, 4827
- King (1978) King, I. R. 1978, ApJ, 222, 1
- King & Minkowski (1966) King, I. R., & Minkowski, R. 1966, ApJ, 143, 1002
- Kochanek et al. (2001) Kochanek, C. S., Pahre, M. A., Falco, E. E., et al. 2001, ApJ, 560, 566
- Komossa et al. (2003) Komossa, S., Burwitz, V., Hasinger, G., et al. 2003, ApJ, 582, L15
- Kormendy (1999) Kormendy, J. 1999, in Astronomical Society of the Pacific Conference Series, Vol. 182, Galaxy Dynamics - A Rutgers Symposium, ed. D. R. Merritt, M. Valluri, & J. A. Sellwood
- Kormendy & Bender (2013) Kormendy, J., & Bender, R. 2013, ApJ, 769, L5
- Kormendy et al. (1994) Kormendy, J., Dressler, A., Byun, Y. I., et al. 1994, in European Southern Observatory Conference and Workshop Proceedings, Vol. 49, European Southern Observatory Conference and Workshop Proceedings, ed. G. Meylan & P. Prugniel, 147
- Kormendy et al. (2009) Kormendy, J., Fisher, D. B., Cornell, M. E., & Bender, R. 2009, ApJS, 182, 216
- Kormendy & Ho (2013) Kormendy, J., & Ho, L. C. 2013, ARA&A, 51, 511
- Kormendy & Richstone (1995) Kormendy, J., & Richstone, D. 1995, ARA&A, 33, 581
- Krajnović et al. (2018) Krajnović, D., Emsellem, E., den Brok, M., et al. 2018, MNRAS, 477, 5327
- Kulkarni & Loeb (2012) Kulkarni, G., & Loeb, A. 2012, MNRAS, 422, 1306
- Laine et al. (2003) Laine, S., van der Marel, R. P., Lauer, T. R., et al. 2003, AJ, 125, 478
- Laporte et al. (2013) Laporte, C. F. P., White, S. D. M., Naab, T., & Gao, L. 2013, MNRAS, 435, 901
- Lauer (1985) Lauer, T. R. 1985, ApJS, 57, 473
- Lauer et al. (1995) Lauer, T. R., Ajhar, E. A., Byun, Y.-I., et al. 1995, AJ, 110, 2622
- Lauer et al. (2007a) Lauer, T. R., Gebhardt, K., Faber, S. M., et al. 2007a, ApJ, 664, 226
- Lauer et al. (2007b) Lauer, T. R., Faber, S. M., Richstone, D., et al. 2007b, ApJ, 662, 808
- Li et al. (2011) Li, Z.-Y., Ho, L. C., Barth, A. J., & Peng, C. Y. 2011, ApJS, 197, 22
- Lidman et al. (2013) Lidman, C., Iacobuta, G., Bauer, A. E., et al. 2013, MNRAS, 433, 825
- Liu et al. (2009) Liu, F. S., Mao, S., Deng, Z. G., Xia, X. Y., & Wen, Z. L. 2009, MNRAS, 396, 2003
- Liu et al. (2019) Liu, X., Hou, M., Li, Z., et al. 2019, arXiv e-prints, arXiv:1907.10639
- López-Cruz et al. (2014) López-Cruz, O., Añorve, C., Birkinshaw, M., et al. 2014, ApJ, 795, L31
- Lugger (1984) Lugger, P. M. 1984, ApJ, 286, 106
- Madrid & Donzelli (2016) Madrid, J. P., & Donzelli, C. J. 2016, ApJ, 819, 50
- Magorrian et al. (1998) Magorrian, J., Tremaine, S., Richstone, D., et al. 1998, AJ, 115, 2285
- Malumuth & Kirshner (1981) Malumuth, E. M., & Kirshner, R. P. 1981, ApJ, 251, 508
- Man et al. (2016) Man, A. W. S., Zirm, A. W., & Toft, S. 2016, ApJ, 830, 89
- Marconi & Hunt (2003) Marconi, A., & Hunt, L. K. 2003, ApJ, 589, L21
- Matković & Guzmán (2005) Matković, A., & Guzmán, R. 2005, MNRAS, 362, 289
- McConnell & Ma (2013) McConnell, N. J., & Ma, C.-P. 2013, ApJ, 764, 184
- McConnell et al. (2011) McConnell, N. J., Ma, C.-P., Gebhardt, K., et al. 2011, Nature, 480, 215
- McConnell et al. (2012) McConnell, N. J., Ma, C.-P., Murphy, J. D., et al. 2012, ApJ, 756, 179
- McNamara et al. (2009) McNamara, B. R., Kazemzadeh, F., Rafferty, D. A., et al. 2009, ApJ, 698, 594
- Mehrgan et al. (2019) Mehrgan, K., Thomas, J., Saglia, R., et al. 2019, arXiv e-prints, arXiv:1907.10608
- Merritt (2006) Merritt, D. 2006, ApJ, 648, 976
- Merritt et al. (2004) Merritt, D., Milosavljević, M., Favata, M., Hughes, S. A., & Holz, D. E. 2004, ApJ, 607, L9
- Mezcua et al. (2018) Mezcua, M., Hlavacek-Larrondo, J., Lucey, J. R., et al. 2018, MNRAS, 474, 1342
- Milosavljević & Merritt (2001) Milosavljević, M., & Merritt, D. 2001, ApJ, 563, 34
- Milosavljević et al. (2002) Milosavljević, M., Merritt, D., Rest, A., & van den Bosch, F. C. 2002, MNRAS, 331, L51
- Montes & Trujillo (2018) Montes, M., & Trujillo, I. 2018, MNRAS, 474, 917
- Morgan & Lesh (1965) Morgan, W. W., & Lesh, J. R. 1965, ApJ, 142, 1364
- Mundy et al. (2017) Mundy, C. J., Conselice, C. J., Duncan, K. J., et al. 2017, MNRAS, 470, 3507
- Naab et al. (2009) Naab, T., Johansson, P. H., & Ostriker, J. P. 2009, ApJ, 699, L178
- Nipoti et al. (2003) Nipoti, C., Londrillo, P., & Ciotti, L. 2003, MNRAS, 342, 501
- Oegerle & Hoessel (1991) Oegerle, W. R., & Hoessel, J. G. 1991, ApJ, 375, 15
- Oemler (1974) Oemler, Jr., A. 1974, ApJ, 194, 1
- O’Leary & Loeb (2008) O’Leary, R. M., & Loeb, A. 2008, MNRAS, 383, 86
- Oser et al. (2012) Oser, L., Naab, T., Ostriker, J. P., & Johansson, P. H. 2012, ApJ, 744, 63
- Oser et al. (2010) Oser, L., Ostriker, J. P., Naab, T., Johansson, P. H., & Burkert, A. 2010, ApJ, 725, 2312
- Paturel et al. (2003) Paturel, G., Petit, C., Prugniel, P., et al. 2003, A&A, 412, 45
- Phipps et al. (2019) Phipps, F., Bogdan, A., Lovisari, L., et al. 2019, arXiv e-prints, arXiv:1903.09965
- Pierini et al. (2008) Pierini, D., Zibetti, S., Braglia, F., et al. 2008, A&A, 483, 727
- Pillepich et al. (2018) Pillepich, A., Nelson, D., Hernquist, L., et al. 2018, MNRAS, 475, 648
- Porter et al. (1991) Porter, A. C., Schneider, D. P., & Hoessel, J. G. 1991, AJ, 101, 1561
- Postman & Lauer (1995) Postman, M., & Lauer, T. R. 1995, ApJ, 440, 28
- Postman et al. (2012) Postman, M., Lauer, T. R., Donahue, M., et al. 2012, ApJ, 756, 159
- Quinlan & Hernquist (1997) Quinlan, G. D., & Hernquist, L. 1997, MNRAS, 2, 533
- Rantala et al. (2018) Rantala, A., Johansson, P. H., Naab, T., Thomas, J., & Frigo, M. 2018, ApJ, 864, 113
- Ravindranath et al. (2001) Ravindranath, S., Ho, L. C., Peng, C. Y., Filippenko, A. V., & Sargent, W. L. W. 2001, AJ, 122, 653
- Redmount & Rees (1989) Redmount, I. H., & Rees, M. J. 1989, Comments on Astrophysics, 14, 165
- Rest et al. (2001) Rest, A., van den Bosch, F. C., Jaffe, W., et al. 2001, AJ, 121, 2431
- Richings et al. (2011) Richings, A. J., Uttley, P., & Körding, E. 2011, MNRAS, 415, 2158
- Richstone et al. (1998) Richstone, D., Ajhar, E. A., Bender, R., et al. 1998, Nature, 395, A14
- Robitaille & Bressert (2012) Robitaille, T., & Bressert, E. 2012, APLpy: Astronomical Plotting Library in Python, Astrophysics Source Code Library, ascl:1208.017
- Rodriguez et al. (2006) Rodriguez, C., Taylor, G. B., Zavala, R. T., et al. 2006, ApJ, 646, 49
- Rodriguez-Gomez et al. (2016) Rodriguez-Gomez, V., Pillepich, A., Sales, L. V., et al. 2016, MNRAS, 458, 2371
- Rusli et al. (2013) Rusli, S. P., Erwin, P., Saglia, R. P., et al. 2013, AJ, 146, 160
- Sahu et al. (2019) Sahu, N., Graham, A. W., & Davis, B. L. 2019, arXiv e-prints, arXiv:1908.06838
- Savorgnan & Graham (2015) Savorgnan, G. A. D., & Graham, A. W. 2015, MNRAS, 446, 2330
- Schlafly & Finkbeiner (2011) Schlafly, E. F., & Finkbeiner, D. P. 2011, ApJ, 737, 103
- Schombert (1986) Schombert, J. M. 1986, ApJS, 60, 603
- Schweizer (1982) Schweizer, F. 1982, ApJ, 252, 455
- Seigar et al. (2007) Seigar, M. S., Graham, A. W., & Jerjen, H. 2007, MNRAS, 378, 1575
- Sérsic (1963) Sérsic, J. L. 1963, Boletin de la Asociacion Argentina de Astronomia La Plata Argentina, 6, 41
- Sérsic (1968) —. 1968, Atlas de Galaxias Australes
- Sheth et al. (2003) Sheth, R. K., Bernardi, M., Schechter, P. L., et al. 2003, ApJ, 594, 225
- Thomas et al. (2016) Thomas, J., Ma, C.-P., McConnell, N. J., et al. 2016, Nature, 532, 340
- Thomas et al. (2014) Thomas, J., Saglia, R. P., Bender, R., Erwin, P., & Fabricius, M. 2014, ApJ, 782, 39
- Toomre & Toomre (1972) Toomre, A., & Toomre, J. 1972, ApJ, 178, 623
- Trujillo et al. (2001) Trujillo, I., Aguerri, J. A. L., Cepa, J., & Gutiérrez, C. M. 2001, MNRAS, 328, 977
- Trujillo et al. (2004) Trujillo, I., Erwin, P., Asensio Ramos, A., & Graham, A. W. 2004, AJ, 127, 1917
- van den Bosch et al. (1994) van den Bosch, F. C., Ferrarese, L., Jaffe, W., Ford, H. C., & O’Connell, R. W. 1994, AJ, 108, 1579
- Veale et al. (2017) Veale, M., Ma, C.-P., Thomas, J., et al. 2017, MNRAS, 464, 356
- Volonteri & Ciotti (2013) Volonteri, M., & Ciotti, L. 2013, ApJ, 768, 29
- West et al. (2017) West, M. J., de Propris, R., Bremer, M. N., & Phillipps, S. 2017, Nature Astronomy, 1, 0157
- White & Rees (1978) White, S. D. M., & Rees, M. J. 1978, MNRAS, 183, 341
- Worthey (1994) Worthey, G. 1994, ApJS, 95, 107
- Wu et al. (2015) Wu, X.-B., Wang, F., Fan, X., et al. 2015, Nature, 518, 512
- Young et al. (1978) Young, P. J., Westphal, J. A., Kristian, J., Wilson, C. P., & Landauer, F. P. 1978, ApJ, 221, 721
- Zibetti et al. (2005) Zibetti, S., White, S. D. M., Schneider, D. P., & Brinkmann, J. 2005, MNRAS, 358, 949
- Zolotov et al. (2009) Zolotov, A., Willman, B., Brooks, A. M., et al. 2009, ApJ, 702, 1058
VIII. Appendix
Appendix A Appendix A
In Fig. A1, we show the multi-component decomposition of the major-axis surface brightness profiles of the large-core galaxies (Table 1).


Appendix B Appendix B
Spatial distribution of our large-core galaxies and their nearest neighbours (Fig. A2).