Magneto-optical probe of the fully gapped Dirac band in ZrSiS
Abstract
We present a far-infrared magneto-optical study of the gapped nodal-line semimetal ZrSiS in magnetic fields up to 7 T. The observed field-dependent features, which represent intra- (cyclotron resonance) and interband transitions, develop as in increasing field and can be consistently explained within a simple 2D Dirac band model with a gap of 26 meV and an averaged Fermi velocity of m/s. This indicates a rather narrow distribution of these parameters along the in-plane portions of the nodal line in the Brillouin zone. A field-induced feature with an energy position that does not depend on is also detected in the spectra. Possible origins of this feature are discussed.
Three-dimensional nodal-line semimetals (NLSMs) Burkov et al. 2011 are currently a subject of intensive experimental investigations Fang et al. 2016; Bian et al. 2016; Yu et al. 2015; Chen et al. 2015; Xie et al. 2015. In these systems, 2D electronic bands possessing linear dispersion cross each other along continuous lines in reciprocal space, hence enabling 2D Dirac electrons to exist in the 3D bulk. Among these materials, ZrSiS is probably the best studied system Schoop et al. 2016; Chen et al. 2017a; Neupane et al. 2016; Ali et al. 2016; Pezzini et al. 2017; Matusiak et al. 2017; Hu et al. 2017; Schilling et al. 2017. This material possesses two types of nodal lines: one of them is situated far away ( eV) from the Fermi level EF, while the second one, most interesting, is much closer to EF and is fully gapped due to spin-orbit coupling. This gap is calculated to be very small, of the order of 10 meV Schoop et al. 2016. Angle-resolved photoemission spectroscopy (ARPES) provides values between 15 and 50 meV Chen et al. 2017a, while our earlier optical studies estimate the maximum of the gap to be around 30 meV Schilling et al. 2017. Although the low-energy nodal line in ZrSiS is slightly gapped, the linearity of the electronic bands forming this line extends up to 0.5 eV, and other non-linear bands do not cross EF. This makes ZrSiS one of the best systems to study the properties of Dirac electrons in NLSMs.
Magneto-optical spectroscopy is a powerful tool to investigate electronic properties of nodal semimetals and narrow-band-gap materials Orlita et al. 2011; Orlita et al. 2012; Chen et al. 2017b; Chen et al. 2014a; Shao et al. 2019. For example, this method enables experimental verification of the electronic band structure by tracing the optical transitions between the magnetic-field-induced Landau levels (LLs). This approach is particularly relevant at low energies, where other experimental techniques often lack accuracy and resolution. Here, we report on far-infrared magneto-optical investigations of ZrSiS. We found that Dirac quasiparticles fully dominate the ac (magneto)transport in ZrSiS: both inter- and intra-band optical transitions demonstrate a square-root dependence on magnetic field, typical for such bands. All measured magneto-optical spectra can be well described by a simple model of gapped Dirac bands with a single (i.e. -independent) gap of 25 meV.
The sample studied was grown by the method described elsewhere Schoop et al. 2016, and was the same single crystal previously used for the zero-field optical measurements of Ref. Schilling et al. 2017. The optical reflectivity spectra were collected from (001) surfaces (the in-plane response) utilizing a home-build magneto-optical setup connected to a commercial Fourier-transform infrared spectrometer. The spectra were recorded for photon energies between and meV in magnetic fields up to 7 T at 10 K. The Voigt geometry was chosen as the measurement configuration to allow the Kramers-Kronig analysis for linearly polarized light Palik and Furdyna 1970 (in the commonly utilized Faraday geometry, such analysis would only be meaningful for circular polarizations, which cannot be used for broadband optical measurements). The spectra have been obtained with two linear polarizations, and (here, is the electric component of the probing radiation and is the external magnetic field). Hereafter we describe our results obtained for , while in the polarization no field-induced changes were detected. A simultaneous change of the -field direction and the light polarization (keeping the angle between them fixed) in respect to the crystallographic direction within the (001) plane did not affect the spectra due to the tetragonal crystal symmetry within this plane. In order to obtain the optical conductivity, the measured reflectivity spectra were merged with the zero-field reflectivity at higher energies (up to eV, Schilling et al. 2017) and the Kramers-Kronig analysis was performed using x-ray atomic scattering functions Tanner 2015 and Drude-Lorentz fits as extrapolations at high and low frequencies, respectively.

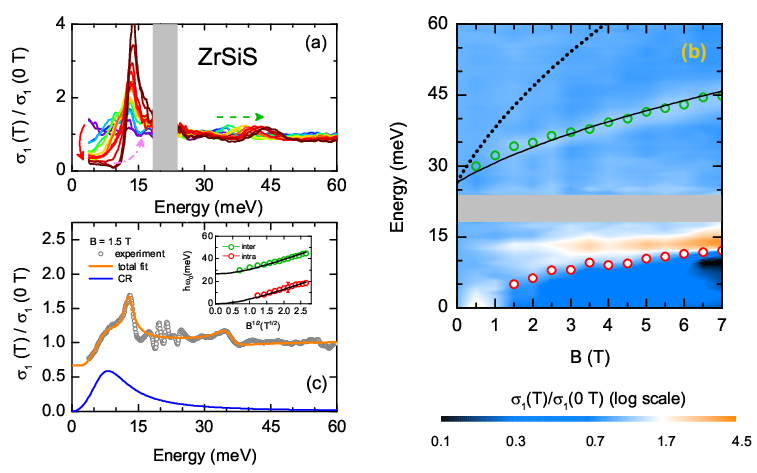
The measured reflectivity is given in Fig. 1. To demonstrate the -field-induced changes more clearly, we plot the relative reflectivity, . The corresponding spectra of the real part of optical conductivity, normalized by its zero-field value, , are given in Fig. 3(a). The spectra between and meV are largely affected by noise in our setup and therefore eliminated from the discussion. Above meV no field-induced features appear; we chose the energy scale on the plots accordingly.

The optical spectra demonstrate three field-induced features: (i) a suppression of reflectivity and optical conductivity at the lowest frequencies (marked with the red arrows in both figures); (ii) a feature that grows in intensity with increasing , but remains its frequency position constant at around 15 meV [the gray triangle in Fig. 1 and the strongest peak in Fig. 3(a)]; and finally, (iii) a feature around 30-45 meV seen at all the fields and marked with the green circles in Fig. 1 and the green arrow in Fig 3(a) demonstrating the frequency shift of the feature as increases. In Fig. 3(b), a false-color plot of the relative optical conductivity as a function of energy and magnetic field is shown. The three field-induced features are seen in this plot as changes of color. The features (i) and (iii) are further emphasized by the open symbols obtained as discussed below.
Before going to the discussion, let us recall that for gapped Dirac bands the LL spectrum reads as Chen et al. 2014a; Chen et al. 2014b:
| (1) |
where is the LL index, is the (average) Fermi velocity, and is the gap between conduction and valence bands. The LLs in the conduction and valence bands correspond to the and signs in Eq. (1), respectively. The spectrum of Eq. (1) is shown in the upper panel of Fig. 4. For the allowed inter-LL transitions, can be changed by . Hence, the transition energy can be written, e.g., as:
| (2) |
with the plus sign corresponding to interband and the minus sign to intraband transitions. These transitions are schematically depicted in the bottom part of Fig. 4. Two situations are considered: with EF in the gap (left panel) and in the conduction band (right panel). Both situations are relevant for ZrSiS: it is well known that the Fermi level crosses electronic bands along some portions of the nodal line, while it is within the gap elsewhere Schoop et al. 2016. In the following, we argue that this simple model can account for all field-dependent features observed by us in the magneto-optical spectra of ZrSiS.
It is worth noting here that optical-conductivity measurements are not -sensitive and probe the entire Brillouin zone. In the present study, we mostly probe the in-plane parts of the nodal line, because the external magnetic field is applied parallel to the (001) plane and hence the closed cyclotron orbits are formed for the carriers from the bands forming the in-plane portions of the nodal line, see Fig. 2. (Small contributions from the out-of-plane parts can also be present due to their corrugations.)
We start from the lowest energy feature (i). To make it more visible, we added the red open circles to Fig. 3(b). Their positions are determined as the unity-crossing points of , cf. Fig. 3(a). The feature (i) starts to appear at 1.5 T and seems to extrapolate to zero as . By looking on the field evolution of this feature in Fig. 3(a), it can clearly be related to depletion of the Drude response: the loss of Drude spectral weight at low energies is expected to be transferred to a cyclotron-resonance (CR) mode Orlita et al. 2012, as indicated by the dash-dotted pink arrow in Fig. 3(a). In our measurements the cyclotron resonance is superimposed on the field-independent feature (ii). In order to extract the CR parameters, we performed a Drude-Lorentz fit Dressel and Grüner 2002 that takes into account the CR itself, the leftover Drude component, the field-independent resonance, and the high-energy mode corresponding to feature (iii), the latter is taken into account only for completeness. In Fig. 3(c), we present an example of such a fit for 1.5 T. This way we can extract the field dependence of the cyclotron resonance. In the inset of the Fig. 3(c) we plot the obtained energies of the cyclotron resonance as a function of field. The linear behavior on the -scale proves the relativistic nature (linear bands) of the carriers responsible for this resonance and can be nicely fitted by Eq. (2) using and the minus sign corresponding to the intraband transition (the red arrow in Fig. 4)
Now, we turn to the feature (iii). At low , it extrapolates to the gap detected in our zero-field measurements Schilling et al. 2017 and it can be assigned to the transitions between LLs in the valence and conduction bands. In Fig. 3(b), we plot the peak positions of as open green symbols. Remarkably, we can fit the symbols with Eq. (2) using the same and as we used to fit the CR mode. Only the sign between the addends should be changed (minus to plus). Thus, the observed mode (iii) corresponds to the interband transitions involving the LLs, i.e., the transitions from to or from to (green arrows in Fig. 4).
The fits to the B-dependent modes (i) and (iii) shown in Fig. 3(b,c) as black solid lines are all performed using the single values of meV and m/s. This strongly indicates that the distribution of these parameters along (the in-plane portions of) the nodal line in the Brillouin zone is rather narrow, as optical probes may only provide momentum-averaged quantities. Had and possessed strong -dispersions, the field-induced magneto-optical features would be extremely broad, if detectable. As already noticed, the gap identified is well within the margins provided by calculations Schoop et al. 2016, ARPES Chen et al. 2017a, and optics Schilling et al. 2017. The same is true for the obtained Fermi velocity, cf. Refs. Ali et al. 2016; Lodge et al. 2017.
In Fig. 3(b), we also show the position expected for the inter-LL transitions from to and from to (dotted line, see also dotted arrows in Fig. 4). These, as well as other transitions between the LLs with larger , are not detectable in our spectra. This situation is quite common: the line broadening increases with energy Orlita et al. 2011; Nedoliuk et al. 2019 making the line detection difficult.

Finally let us turn to the field-independent feature (ii), which is seen around 15 meV. The position of this mode does not show any appreciable frequency shift, but the mode strength increases with magnetic field. A simple explanation of this mode would be an in-gap impurity resonance. However, the studied ZrSiS sample is very clean: the mean free path extracted from our optical measurements on this very sample is of the order of 1 m at low temperatures Schilling et al. 2017. Thus, this explanation seems not to be very likely. Alternatively, surface states Topp et al. 2017 might be relevant for the formation of this mode. A more appealing option is of bulk and intrinsic origin. We note that a low-energy mode with a very similar behavior in magnetic field (constant energy position and strength increasing with ) was observed, but remained unexplained, in another gapped NLSM, NbAs2 Shao et al. 2019. It would be tempting to assign both modes to the B-independent resonance, recently theoretically proposed to be a hallmark of the NLSM state Duan et al. 2019. However, the model used in this reference (a single nodal loop formed by crossing cones) is far too simple and not directly applicable to ZrSiS or NbAs2: both compounds possess complex and extended nodal lines. Thus, we call for more theoretical studies in this direction.
Summarizing, our in-plane far-infrared magneto-optical study of ZrSiS reveals three features developing in applied magnetic field. The energy position of two of them scales as a square root of . A simple model of a single gapped Dirac band provides adequate explanation for the field evolution of these features, the low-energy feature being associated with intra-band (cyclotron resonance) absorption, while the high-energy one appearing due to interband LL transitions. The free parameters of this model are defined as meV and m/s, which can be considered as averaged values over the entire in-plane part of the nodal line. Both values are well consistent with the ones obtained by other methods and reported in literature. The fact that such a simple model accounts for the complete magneto-optical spectrum indicates that and do not vary appreciably along (the in-plane portion of) the nodal line. This also evidences that other bands do not contribute to the corresponding ac transport. Possible origins of the third observed mode are discussed and more theory output is called for.
Acknowledgements.
The authors acknowledge fruitful discussions with Chao Zhang (Wollongong), Milan Orlita (Grenoble), and Sascha Polatkan (Stuttgart) and the technical support by Gabriele Untereiner (Stuttgart). The work was supported by the Deutsche Forschungsgesellschaft (DFG) via DR228/51-1 and the Max Planck Society. E.U. acknowledges the support by the ESF and by the Ministry of Science, Research, and Arts of Baden-Württemberg. Work at Princeton was supported by NSF through the Princeton Center for Complex Materials, a Materials Research Science and Engineering Center (grant No. DMR-1420541).References
- Burkov et al. (2011) A. A. Burkov, M. D. Hook, and L. Balents, Phys. Rev. B 84, 235126 (2011).
- Fang et al. (2016) C. Fang, H. Weng, X. Dai, and Z. Fang, Chin. Phys. B 25, 117106 (2016).
- Bian et al. (2016) G. Bian, T.-R. Chang, R. Sankar, S.-Y. Xu, H. Zheng, T. Neupert, C.-K. Chiu, S.-M. Huang, G. Chang, I. Belopolski, D. S. Sanchez, M. Neupane, N. Alidoust, C. Liu, B. Wang, C.-C. Lee, H.-T. Jeng, C. Zhang, Z. Yuan, S. Jia, A. Bansil, F. Chou, H. Lin, and M. Z. Hasan, Nat. Comm. 7, 10556 (2016).
- Yu et al. (2015) R. Yu, H. Weng, Z. Fang, X. Dai, and X. Hu, Phys. Rev. Lett. 115, 036807 (2015).
- Chen et al. (2015) Y. Chen, Y.-M. Lu, and H.-Y. Kee, Nat. Comm. 6, 6593 (2015).
- Xie et al. (2015) L. S. Xie, L. M. Schoop, E. M. Seibel, Q. D. Gibson, W. Xie, and R. J. Cava, APL Mater. 3, 083602 (2015).
- Schoop et al. (2016) L. M. Schoop, M. N. Ali, C. Straßer, A. Topp, A. Varykhalov, D. Marchenko, V. Duppel, S. S. P. Parkin, B. V. Lotsch, and C. R. Ast, Nat. Comm. 7, 11696 (2016).
- Chen et al. (2017a) C. Chen, X. Xu, J. Jiang, S.-C. Wu, Y. P. Qi, L. X. Yang, M. X. Wang, Y. Sun, N. B. M. Schröter, H. F. Yang, L. M. Schoop, Y. Y. Lv, J. Zhou, Y. B. Chen, S. H. Yao, M. H. Lu, Y. F. Chen, C. Felser, B. H. Yan, Z. K. Liu, and Y. L. Chen, Phys. Rev. B 95, 125126 (2017a).
- Neupane et al. (2016) M. Neupane, I. Belopolski, M. M. Hosen, D. S. Sanchez, R. Sankar, M. Szlawska, S.-Y. Xu, K. Dimitri, N. Dhakal, P. Maldonado, P. M. Oppeneer, D. Kaczorowski, F. Chou, M. Z. Hasan, and T. Durakiewicz, Phys. Rev. B 93, 201104 (2016).
- Ali et al. (2016) M. N. Ali, L. M. Schoop, C. Garg, J. M. Lippmann, E. Lara, B. Lotsch, and S. S. P. Parkin, Sci. Adv. 2 (2016).
- Pezzini et al. (2017) S. Pezzini, M. R. van Delft, L. M. Schoop, B. V. Lotsch, A. Carrington, M. I. Katsnelson, N. Hussey, and S. Wiedmann, Nat. Phys. 14, 178 (2017).
- Matusiak et al. (2017) M. Matusiak, J. R. Cooper, and D. Kaczorowski, Nat. Comm. 8, 15219 (2017).
- Hu et al. (2017) J. Hu, Z. Tang, J. Liu, Y. Zhu, J. Wei, and Z. Mao, Phys. Rev. B 96, 045127 (2017).
- Schilling et al. (2017) M. B. Schilling, L. M. Schoop, B. V. Lotsch, M. Dressel, and A. V. Pronin, Phys. Rev. Lett. 119, 187401 (2017).
- Orlita et al. (2011) M. Orlita, C. Faugeras, R. Grill, A. Wysmolek, W. Strupinski, C. Berger, W. A. de Heer, G. Martinez, and M. Potemski, Phys. Rev. Lett. 107, 216603 (2011).
- Orlita et al. (2012) M. Orlita, I. Crassee, C. Faugeras, A. B. Kuzmenko, F. Fromm, M. Ostler, T. Seyller, M. G., P. M., and P. M., New. J. Phys. 14, 095008 (2012).
- Chen et al. (2017b) Z.-G. Chen, R. Y. Chen, R. D. Zhong, J. Schneeloch, C. Zhang, Y. Huang, F. Qu, R. Yu, Q. Li, G. D. Gu, and N. L. Wang, Proc. Natl. Acad. Sci. 114, 816 (2017b).
- Chen et al. (2014a) Z.-G. Chen, Z. Shi, W. Yang, X. Lu, Y. Lai, H. Yan, F. Wang, G. Zhang, and Z. Li, Nat. Comm. 5, 4461 (2014a).
- Shao et al. (2019) Y. Shao, Z. Sun, Y. Wang, C. Xu, R. Sankar, A. J. Breindel, C. Cao, M. M. Fogler, A. J. Millis, F. Chou, Z. Li, T. Timusk, M. B. Maple, and D. N. Basov, Proc. Natl. Acad. Sci. 116, 1168 (2019).
- Palik and Furdyna (1970) E. D. Palik and J. K. Furdyna, Rep. Prog. Phys. 33, 1193 (1970).
- Tanner (2015) D. B. Tanner, Phys. Rev. B 91, 035123 (2015).
- Chen et al. (2014b) X. Chen, J. R. Wallbank, A. A. Patel, M. Mucha-Kruczyński, E. McCann, and V. I. Fal’ko, Phys. Rev. B 89, 075401 (2014b).
- Dressel and Grüner (2002) M. Dressel and G. Grüner, Electrodynamics of Solids (Cambridge University Press, Cambridge, 2002).
- Lodge et al. (2017) M. S. Lodge, G. Chang, C.-Y. Huang, B. Singh, J. Hellerstedt, M. T. Edmonds, D. Kaczorowski, M. M. Hosen, M. Neupane, H. Lin, M. S. Fuhrer, B. Weber, and M. Ishigami, Nano Lett. 17, 7213 (2017).
- Nedoliuk et al. (2019) I. O. Nedoliuk, S. Hu, A. K. Geim, and A. B. Kuzmenko, Nat. Nanotechnol. 14, 756 (2019).
- Topp et al. (2017) A. Topp, R. Queiroz, A. Grüneis, L. Müchler, A. W. Rost, A. Varykhalov, D. Marchenko, M. Krivenkov, F. Rodolakis, J. L. McChesney, B. V. Lotsch, L. M. Schoop, and C. R. Ast, Phys. Rev. X 7, 041073 (2017).
- Duan et al. (2019) W. Duan, C. Yang, Z. Ma, Y. Zhu, and C. Zhang, Phys. Rev. B 99, 045124 (2019).