Percolation thresholds for discorectangles: numerical estimation for a range of aspect ratios
Abstract
Using Monte Carlo simulation, we have studied the percolation of discorectangles. Also known as stadiums or two-dimensional spherocylinders, a discorectangle is a rectangle with semicircles at a pair of opposite sides. Scaling analysis was performed to obtain the percolation thresholds in the thermodynamic limits. We found: (i) for the two marginal aspect ratios (disc) and (stick) the percolation thresholds coincide with known values within the statistical error; (ii) for intermediate values of the percolation threshold lies between the percolation thresholds for ellipses and rectangles and approaches the latter as the aspect ratio increases.
I Introduction
Percolation, i.e., the emergence of a connected subset (a cluster) that spans opposite boundaries in a disordered medium, has attracted the attention of the scientific community for several decades Stauffer and Aharony 1994; Sahimi 1994; Bollobás and Riordan 2006; Grimmett 1999; Kesten 1982. The occurrence of a percolation cluster drastically changes the physical properties of the medium, e.g., an insulator–conductor phase transition can be observed when the disordered medium is a mixture of conductive and insulating substances. Special attention has been paid to percolation in disordered systems produced by the random deposition of elongated particles onto a substrate Li and Zhang 2009; Mertens and Moore 2012; Li and Östling 2013; Li and Östling 2016. Elongated species such as nanotubes, nanowires, and nanorods are of particular interest for nanotechnology, e.g., the production of transparent electrodes Hecht et al. 2011; Nam and Lee 2016; Ackermann et al. 2016; O’Callaghan et al. 2016; McCoul et al. 2016; Zhang et al. 2017; Hicks et al. 2018.
To characterize a deposit, the number density, i.e., the number of objects, , per unit area, , is commonly used
| (1) |
Another useful quantity is the filling fraction,
| (2) |
where is the area of one particle. The total fraction of the plane covered by the overlapping (penetrable) particles is
| (3) |
(see, e.g., Mertens and Moore 2012).
To mimic the shape of elongated particles and, at the same time, simplify the simulations, different simple geometrical figures are used, e.g., sticks, rectangles, ellipses, superellipses, and discorectangles. A discorectangle is a rectangle with semicircles at a pair of opposite sides (figure 1). Its aspect ratio is
| (4) |
A discorectangle (or “stadium”) is a two-dimensional analog of a spherocylinder (a “stadium of revolution” or “capsule”), i.e., a three-dimensional geometric shape consisting of a cylinder with hemispherical ends.

Percolation thresholds of two-dimensional continuum systems of rectangles Li and Östling 2013 and ellipses Li and Östling 2016 for a wide range of aspect ratios from to have been reported. Both ellipses and rectangles transform into sticks when . When , a rectangle is simply a square, while an ellipse is a disc. Currently, the best known value of the percolation threshold of zero-width sticks of equal length that are randomly oriented and placed onto a plane, is Mertens and Moore 2012. By convention, the value of for sticks is taken as equal to , where is the length of the stick. The best known value of the percolation threshold of discs, i.e., ellipses with , is , respectively Mertens and Moore 2012. A calculation has been presented for the excluded area between penetrable rectangles in 2D as a function of the aspect ratio and orientational order parameter Chatterjee 2015. The percolation threshold was found to rise with increases in the degree of particle alignment. For isotropically distributed systems, the percolation thresholds for different values of the aspect ratio are in close agreement with findings from Monte Carlo simulations Li and Östling 2013. Recently, percolation thresholds of superellipses have been reported Lin and Chen 2019. In a Cartesian coordinate system, the equation of a superellipse is
| (5) |
where and are the semimajor lengths in the direction of the and axes and is the shape parameter. corresponds to an ellipse while corresponds to a rectangle. Percolation thresholds as the total fractions of the plane covered by the particles, , have been presented for 14 shapes, for each of 6 aspect ratios Lin and Chen 2019.
Although the percolation of spherocylinders has been studied Xu et al. 2016, to the best of our knowledge, the percolation thresholds for their two-dimensional analogs, i.e., discorectangles, have not yet been presented in the literature. The goal of the present work was to obtain the dependencies of the percolation thresholds of randomly placed and oriented discorectangles on their aspect ratios. The rest of the paper is constructed as follows. In Section II, the technical details of the simulations and calculations are described. Section III presents our main findings. Section IV summarizes the main results.
II Methods
We used the union–find algorithm Newman and Ziff 2000; Newman and Ziff 2001 to check for any occurrences of wrapping clusters. In our study, we used the version of the union–find algorithm adapted for continuous percolation Li and Zhang 2009; Mertens and Moore 2012.
Discorectangles with were added one by one randomly, uniformly, and isotropically onto a substrate of size having periodic boundary conditions (PBCs), i.e., onto a torus, until a cluster wrapping around the torus in two directions had arisen. In this case, the desired number density, , is
| (6) |
Intersections of the discorectangles were allowed (figure 2). For each given system size, , and number of deposited discorectangles, , independent runs were performed to obtain the probability of percolation, . Here, the superscript means a used criterion, viz., , or mean that the cluster winds the torus in the horizontal, or vertical direction, or in both directions, respectively.
To obtain the probability of percolation in the grand canonical ensemble, we convolved with the Poisson distribution Li and Zhang 2009; Mertens and Moore 2012.
| (7) |
The weights in Eq. (7) can be calculated using the recurrent relations Mertens and Moore 2012,
| (8) |
and
| (9) |
herewith the relation
should be borne in mind. Here, . Therefore, the convolution can be calculated as
| (10) |
where
| (11) |
The factor is absent in the master equation (10), since
Conformal field theory gives exact values for the wrapping probabilities at the transition in the limit Pinson 1994; Newman and Ziff 2000; Newman and Ziff 2001.
| (12) |
where is the probability of wrapping horizontally around the system and is the probability of wrapping around both directions simultaneously. More precise values of including other possible criteria are presented in Ref. Mertens and Moore 2012. This theory provides the most effective method for estimating the percolation threshold Newman and Ziff 2000; Newman and Ziff 2001; Li and Zhang 2009; Mertens and Moore 2012 since
| (13) |
Typically, we used systems of sizes to perform the scaling analysis. The number of independent runs was . All results presented in Section III correspond to the thermodynamic limit.
To verify our program, we performed more accurate estimations for one particular case, viz., (discs of ). For this particular case we used while the number of independent runs was (figure 4).
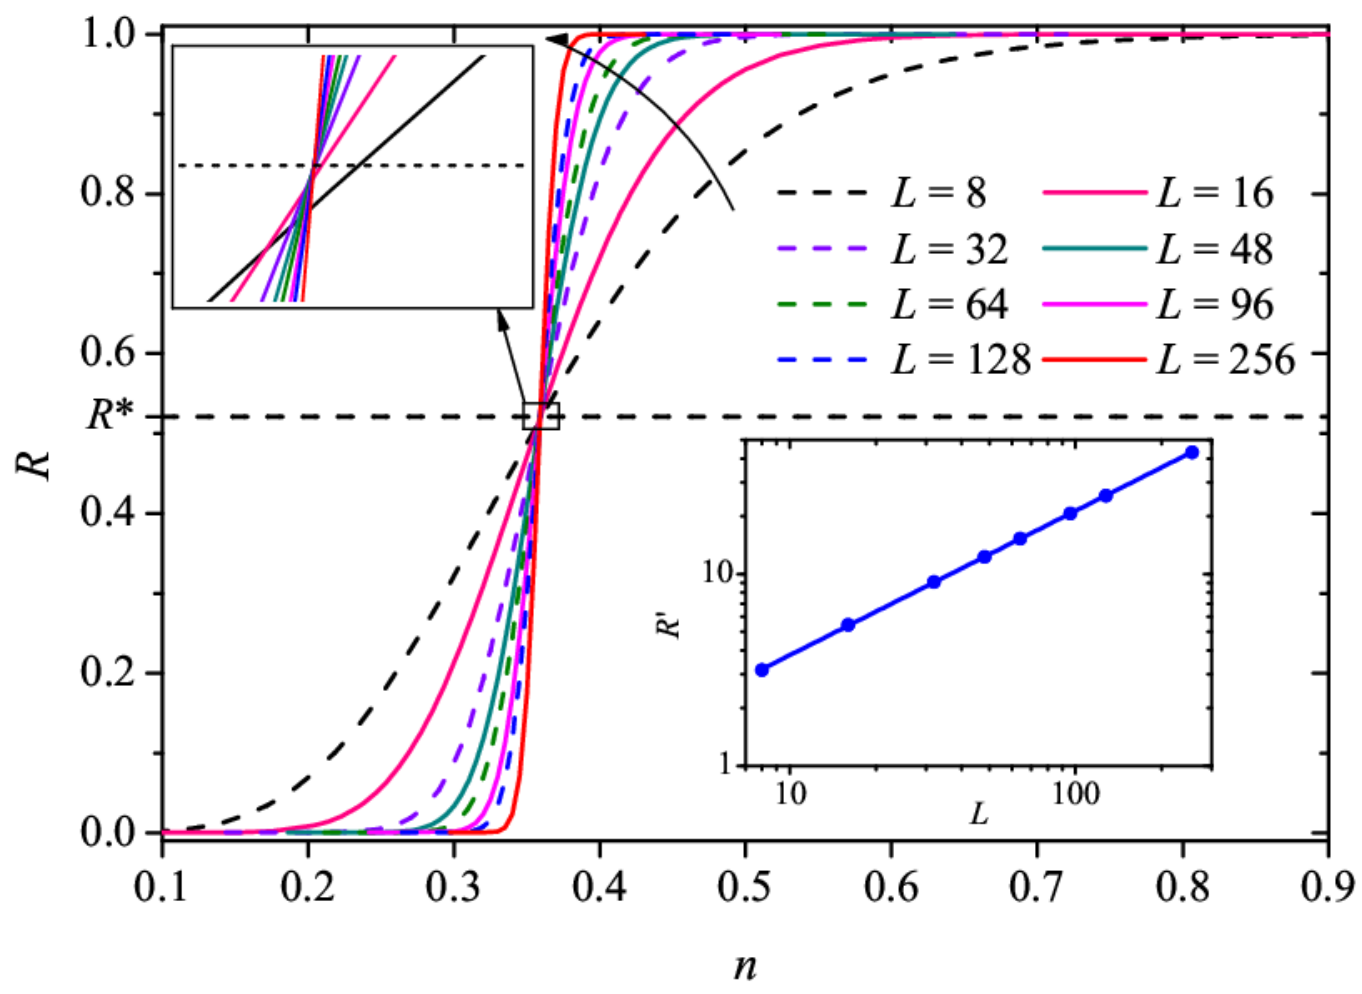
Figure 4 demonstrates an example of scaling for . According to Ref. Mertens and Moore 2012, the standard deviation was taken as , where is the number of independent runs. Our estimations gave with the adjusted . This estimation is reasonable close to the published values for discs of unit diameter Li and Östling 2016 and Mertens and Moore 2012.

Additionally, we checked the derivative of at the percolation threshold. An example of the dependency of for wrapping in the horizontal direction is presented in figure 3 (inset) in log-log scale. The slope is and this corresponds to the value of the critical exponent .
III Results
Our results are presented in Table 1 which compares the percolation thresholds for discorectangles (our results) with known values for rectangles Li and Östling 2013 and ellipses Li and Östling 2016 for different values of the aspect ratio.
| 1 | 0.982278 | 1.436 | 1.436323 |
|---|---|---|---|
| 1.5 | 1.425745 | 1.894 | 2.059081 |
| 2 | 1.786294 | 2.245 | 2.523560 |
| 3 | 2.333491 | 2.760 | 3.157339 |
| 4 | 2.731318 | 3.123 | 3.569706 |
| 5 | 3.036130 | 3.396 | 3.861262 |
| 6 | 3.278680 | 3.612 | 4.079359 |
| 7 | 3.477211 | 3.787 | 4.249158 |
| 8 | 3.643137 | 3.933 | 4.385303 |
| 9 | 3.784321 | 4.057 | 4.497044 |
| 10 | 3.906022 | 4.163 | 4.590416 |
| 15 | 4.329848 | 4.530 | 4.894745 |
| 20 | 4.584535 | 4.749 | 5.062313 |
| 30 | 4.878091 | 5.000 | 5.241522 |
| 50 | 5.149008 | 5.229 | 5.393863 |
| 100 | 5.378856 | 5.422 | 5.513464 |
| 200 | 5.504099 | 5.612260 | |
| 1000 | 5.609947 | 5.624756 | |
| 5.6372858 |
Figure 5 demonstrates the dependencies of the percolation threshold, , on the aspect ratios of discorectangles, . The dependencies for rectangles Li and Östling 2013 and ellipses Li and Östling 2016 are shown for comparison. For any value of , the critical number density increases as the aspect ratio increases. When , the discorectangle is simply a disc, hence, the percolation threshold of such discorectangles equals the percolation threshold of discs. When , ellipses, rectangles, and discorectangles all tend to sticks. Thus their percolation thresholds approach the percolation threshold of zero-width sticks. For any values of , the percolation threshold of discorectangles is situated between the percolation thresholds of ellipses (upper boundary) and rectangles (lower boundary).

IV Conclusion
By means of computer simulation and scaling analysis, we studied the percolation of discorectangles on a torus. The dependencies of the percolation threshold, , on the aspect ratio, , have been obtained in the thermodynamic limit. Comparison with known results for rectangles Li and Östling 2013, , and ellipses Li and Östling 2016, , evidenced that
Naturally, since, in this case, each of these shapes is simply a disc. The value of tends to the value for zero-width sticks Mertens and Moore 2012 when . Improvements to the accuracy of the obtained values of the percolation threshold will require additional time and computational resources.
Our consideration deals with only one particular case when overlapping of particles is allowed. Such the particles are treated as permeable, overlapped particles form a cluster (Fig. 6a). However, other possibilities are also feasible. For instance, in random sequential adsorption Evans 1993, particles are impermeable and none cluster can occur (Fig. 6b).

An intermediate possibility is so-called connectedness percolation of non-overlapping particles Otten and van der Schoot 2011; Drwenski et al. 2018. Two non-overlapping particles are assumed to be connected when the shortest distance between them does not a exceed a certain value, i.e., so-called cutoff distance Lee and Torquato 1988. This case can be also treated as a hard–core–soft–shell model (Fig. 6c). Naturally, in this case, the percolation threshold have to significantly depend on the cutoff distance.
Both length dispersity and alignment of particles may affect the percolation threshold Otten and van der Schoot 2009; Otten and van der Schoot 2011; Tarasevich and Eserkepov 2018. In the case of permeable discorectangles, these effects needs an additional examination.
Acknowledgements.
We acknowledge the funding from the Ministry of Science and Higher Education of the Russian Federation, Project No. 3.959.2017/4.6.References
- Stauffer and Aharony (1994) D. Stauffer and A. Aharony, Introduction to Percolation Theory, 2nd ed. (Taylor & Francis, London, 1994).
- Sahimi (1994) M. Sahimi, Applications Of Percolation Theory (Taylor & Francis, 1994).
- Bollobás and Riordan (2006) Bela Bollobás and Oliver Riordan, Percolation (Cambridge University Press, Cambridge, 2006).
- Grimmett (1999) Geoffrey R. Grimmett, Percolation (Springer-Verlag Berlin Heidelberg, 1999).
- Kesten (1982) Harry Kesten, Percolation theory for mathematicians, Progress in Probability and Statistics, Vol. 2 (Birkhäuser Boston, Mass., 1982) pp. iv+423.
- Li and Zhang (2009) Jiantong Li and Shi-Li Zhang, “Finite-size scaling in stick percolation,” Phys. Rev. E 80, 040104 (2009).
- Mertens and Moore (2012) Stephan Mertens and Cristopher Moore, “Continuum percolation thresholds in two dimensions,” Phys. Rev. E 86, 061109 (2012).
- Li and Östling (2013) Jiantong Li and Mikael Östling, “Percolation thresholds of two-dimensional continuum systems of rectangles,” Phys. Rev. E 88, 012101 (2013).
- Li and Östling (2016) Jiantong Li and Mikael Östling, “Precise percolation thresholds of two-dimensional random systems comprising overlapping ellipses,” Physica A 462, 940–950 (2016).
- Hecht et al. (2011) David S. Hecht, Liangbing Hu, and Glen Irvin, “Emerging transparent electrodes based on thin films of carbon nanotubes, graphene, and metallic nanostructures,” Adv. Mater. 23, 1482–1513 (2011).
- Nam and Lee (2016) Vu Binh Nam and Daeho Lee, “Copper nanowires and their applications for flexible, transparent conducting films: A review,” Nanomaterials 6, 47 (2016).
- Ackermann et al. (2016) Thomas Ackermann, Raphael Neuhaus, and Siegmar Roth, “The effect of rod orientation on electrical anisotropy in silver nanowire networks for ultra-transparent electrodes,” Sci. Rep. 6, 34289 (2016).
- O’Callaghan et al. (2016) Colin O’Callaghan, Claudia Gomes da Rocha, Hugh G. Manning, John J. Boland, and Mauro S. Ferreira, “Effective medium theory for the conductivity of disordered metallic nanowire networks,” Phys. Chem. Chem. Phys. 18, 27564–27571 (2016).
- McCoul et al. (2016) David McCoul, Weili Hu, Mengmeng Gao, Vishrut Mehta, and Qibing Pei, “Recent advances in stretchable and transparent electronic materials,” Adv. Electron. Mater. 2, 1500407 (2016).
- Zhang et al. (2017) Chengpeng Zhang, Yuwen Zhu, Peiyun Yi, Linfa Peng, and Xinmin Lai, “Fabrication of flexible silver nanowire conductive films and transmittance improvement based on moth-eye nanostructure array,” J. Micromech. Microeng. 27, 075010 (2017).
- Hicks et al. (2018) Jeremy Hicks, Junying Li, Chen Ying, and Ant Ural, “Effect of nanowire curviness on the percolation resistivity of transparent, conductive metal nanowire networks,” J. Appl. Phys. 123, 204309 (2018).
- Chatterjee (2015) Avik P. Chatterjee, “Percolation thresholds and excluded area for penetrable rectangles in two dimensions,” J. Stat. Phys. 158, 248–254 (2015).
- Lin and Chen (2019) Jianjun Lin and Huisu Chen, “Measurement of continuum percolation properties of two-dimensional particulate systems comprising congruent and binary superellipses,” Powder Technol. 347, 17–26 (2019).
- Xu et al. (2016) Wenxiang Xu, Xianglong Su, and Yang Jiao, “Continuum percolation of congruent overlapping spherocylinders,” Phys. Rev. E 94, 032122 (2016).
- Newman and Ziff (2000) M. E. J. Newman and R. M. Ziff, “Efficient Monte Carlo algorithm and high-precision results for percolation,” Phys. Rev. Lett. 85, 4104–4107 (2000).
- Newman and Ziff (2001) M. E. J. Newman and R. M. Ziff, “Fast Monte Carlo algorithm for site or bond percolation,” Phys. Rev. E 64, 016706 (2001).
- Pinson (1994) Haru T. Pinson, “Critical percolation on the torus,” J. Stat. Phys. 75, 1167–1177 (1994).
- Evans (1993) J. W. Evans, “Random and cooperative sequential adsorption,” Rev. Mod. Phys. 65, 1281–1329 (1993).
- Otten and van der Schoot (2011) Ronald H. J. Otten and Paul van der Schoot, “Connectivity percolation of polydisperse anisotropic nanofillers,” J. Chem. Phys. 134, 094902 (2011).
- Drwenski et al. (2018) Tara Drwenski, René van Roij, and Paul van der Schoot, “Connectedness percolation of hard convex polygonal rods and platelets,” J. Chem. Phys. 149, 054902 (2018).
- Lee and Torquato (1988) Sang Bub Lee and S. Torquato, “Pair connectedness and mean cluster size for continuum-percolation models: Computer-simulation results,” J. Chem. Phys. 89, 6427–6433 (1988).
- Otten and van der Schoot (2009) Ronald H. J. Otten and Paul van der Schoot, “Continuum percolation of polydisperse nanofillers,” Phys. Rev. Lett. 103, 225704 (2009).
- Tarasevich and Eserkepov (2018) Yuri Yu. Tarasevich and Andrei V. Eserkepov, “Percolation of sticks: Effect of stick alignment and length dispersity,” Phys. Rev. E 98, 062142 (2018).