TOI-222: a single-transit TESS candidate revealed to be a 34-day eclipsing binary with CORALIE, EulerCam and NGTS20NNTOI-222: a single-transit TESS candidate revealed to be a 34-day eclipsing binary with CORALIE, EulerCam and NGTS–References
Abstract
We report the period, eccentricity, and mass determination for the TESS single-transit event candidate TOI-222, which displayed a single 3000 ppm transit in the TESS two-minute cadence data from Sector 2. We determine the orbital period via radial velocity measurements (P= days), which allowed for ground-based photometric detection of two subsequent transits. Our data show that the companion to TOI-222 is a low mass star, with a radius of and a mass of . This discovery showcases the ability to efficiently discover long-period systems from TESS single transit events using a combination of radial velocity monitoring coupled with high precision ground-based photometry.
Keywords:
techniques: photometric, stars: individual: TOI-222, planetary systems1 Introduction
Even though the probability of an exoplanet to transit across its host plummets for long orbital periods, space-based transit surveys such as CoRoT (Baglin et al. 2006) and Kepler (Borucki et al. 2010) have succeeded in detecting a number of long-period transiting planets as they monitor large fields continuously for extended periods of time. Unlike its predecessors, the Transiting Exoplanet Survey Satellite (TESS, Ricker et al. 2014) is optimised for bright stars. From its recently-completed survey of the Southern ecliptic hemisphere, over 1000 promising exoplanet candidates, including multi-planet candidate systems, have been reported as TESS objects of interest (TOIs). A number of the candidates have now also been confirmed as bona fide transiting planets via radial velocity measurements; for example pi Mensae c (Huang et al. 2018; Gandolfi et al. 2018), HD 202772A b (Wang et al. 2019), and HD 1397 b (Nielsen et al. 2019; Brahm et al. 2019).
As predicted by simulations (Cooke et al. 2018; Villanueva et al. 2019), TESS also detected a number of promising exoplanet candidates for which only a single transit event was observed. These "Monotransits" do not provide well-determined periods, although period estimates can be derived using knowledge of the host star and transit parameters (Osborn et al. 2016). Since the time coverage of TESS is limited to 27 days for large parts of the sky, these single-transit event candidates provide longer period planetary systems and eclipsing binaries. The confirmation of monotransit candidates through the observation of a second transit is challenging as the planetary period is only loosely constrained. This task can be made easier by monitoring the primary’s radial velocity in order to constrain the spectroscopic orbit and predict the times of subsequent transit events.
In this work, we present the mass and period determination of TOI-222: a TOI identified as a TESS single-transit event in Sector 2. Using spectroscopic follow-up, we determined the orbit of this low-mass eclipsing binary, leading to the recovery of the transit from subsequent photometric observations. We describe the observations and the analysis of our data in Sections 2 and 3, and place this detection into context in Section 4.
2 Observations
2.1 TESS Discovery Photometry
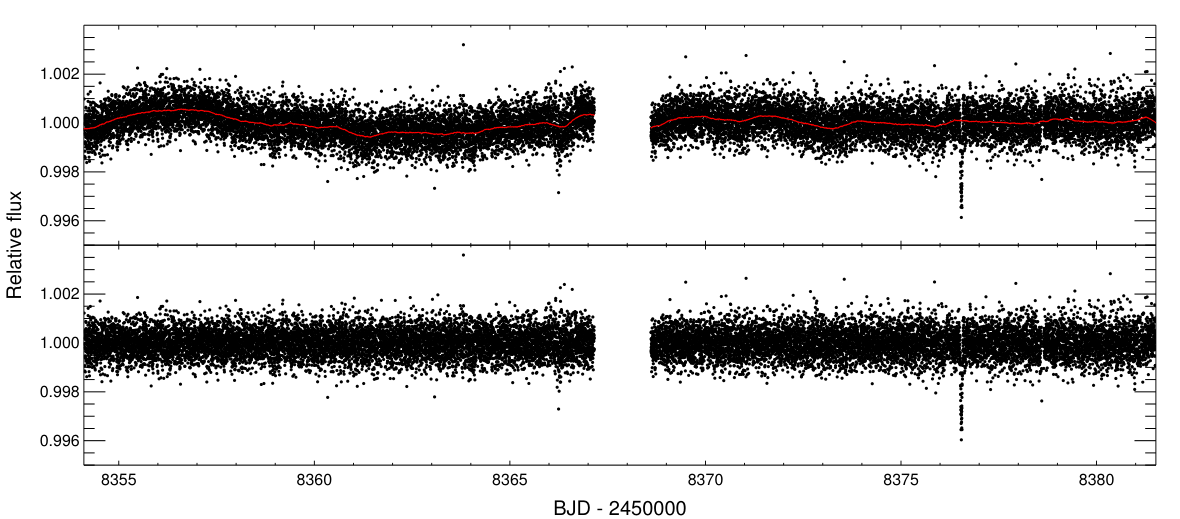
The V=9.3 star HD 224286 (TIC 144440290) was observed by TESS in Sector 2 throughout 27.4 days. The observations have a continuous 2-minute cadence, with only a short gap occurring at the centre of the sequence when observations were interrupted to allow for the data to be downlinked to Earth. A single, approximately 3.5 mmag deep, transit event was identified and denominated TOI-222 by the TESS team. The transit occurred approximately 22 days after the start of the sequence, thus constraining the period of a potential planet or binary companion to be above 22 days. The long period but comparatively short total transit duration of 1.8 hours, paired with a clear V shape, indicated a grazing configuration, with a larger planet or an eclipsing binary only partially transiting the star.
We used the TESS Science Processing Operations Center (Jenkins et al. 2016) two-minute cadence PDC light curve (Smith et al. 2012; Stumpe et al. 2014) for the subsequent analysis, and additionally filtered the time-series by a 12-hour boxcar to remove a low-amplitude variation likely caused by stellar active regions rotating in and out of view. Data points obtained in transit were excluded at this step in order to avoid altering the transit shape when correcting these long-term trends. The TESS data are shown in Figure 1.
2.2 High resolution spectroscopy with CORALIE
TOI-222 was observed with the CORALIE spectrograph on the Swiss 1.2 m Euler telescope at La Silla Observatory, Chile (Queloz et al. 2001) between 2 January and 30 June 2019. CORALIE has a resolving power of and is fed by two fibres; one 2″ on-sky science fibre encompassing the star and another which can either be connected to a Fabry-Pérot etalon for simultaneous wavelength calibration or on-sky for background subtraction of the sky-flux. Radial-velocities (RVs) were computed for each epoch by cross-correlating with a binary G2 mask (Pepe et al. 2002). Bisector-span, FWHM and other line-profile diagnostics were computed as well using the standard CORALIE pipeline. As initial observations showed a large 10 km/s RV shift over 9 days, we reduced the exposure time from 1800 seconds to 900-300 seconds depending on seeing and airmass to save telescope time. We obtain a final precision of 6-20 m/s. The resulting velocities are given in Table 1 and are shown in Figure 2. The CORALIE spectra were shifted to the stellar rest frame and stacked while weighting the contribution from each spectrum with its mean flux to produce a high signal-to-noise spectrum for spectral characterisation.
We detected significant RV variations in the CORALIE data, indicative of a low-mass stellar component orbiting the main target with a period of 33.9 days, which prompted us to proceed with photometric follow-up.
| BJD | RV | RV err | FWHM | BIS | Instrument |
|---|---|---|---|---|---|
| (-2400000) | (km s-1) | (km s-1) | (km s-1) | (km s-1) | |
| 58486.571350 | 1.94699 | 0.01589 | 8.19162 | -0.03997 | CORALIE |
| 58490.540095 | 5.54885 | 0.00645 | 8.25366 | -0.05706 | CORALIE |
| 58495.549674 | 12.01076 | 0.00647 | 8.26060 | -0.05091 | CORALIE |
| 58510.528803 | 22.29837 | 0.01479 | 8.23169 | -0.00504 | CORALIE |
| 58514.527724 | 5.94552 | 0.01239 | 8.26212 | -0.04074 | CORALIE |
| 58517.523825 | 1.48704 | 0.01297 | 8.27996 | -0.05966 | CORALIE |
| 58526.513423 | 7.98638 | 0.03271 | 8.31453 | -0.09361 | CORALIE |
| 58636.901387 | 20.93734 | 0.01824 | 8.24319 | -0.09194 | CORALIE |
| 58638.938599 | 24.24232 | 0.01393 | 8.23949 | -0.00828 | CORALIE |
| 58640.945601 | 27.10596 | 0.01844 | 8.27672 | 0.00445 | CORALIE |
| 58641.935281 | 28.06841 | 0.01544 | 8.24595 | -0.06231 | CORALIE |
| 58656.822502 | 2.42260 | 0.01350 | 8.31897 | -0.02812 | CORALIE |
| 58664.859362 | 11.6754 | 0.02199 | 8.23540 | -0.00685 | CORALIE |
2.3 Transit Recovery With EulerCam
With the system period established, we scheduled photometric observations with EulerCam, also installed at the 1.2 m Euler telescope, with the goal of detecting a second transit of the low-mass companion in front of its host. The observations were carried out throughout 2.8 hours on 13 June 2019, covering approximately 75% of the predicted 1- transit window. We used an Cousins I filter, 20 s exposures and applied a large defocus to avoid saturating the target while keeping a reasonable observation efficiency. For details on the instrument and the data analysis routines used to extract relative aperture photometry, please refer to Lendl et al. 2012. We detected a flux drop of mmag during first half of the sequence, having a depth compatible with that of the TESS measurement. The egress occurred approx. 42 minutes (or ) earlier than predicted, indicating a slightly shorter planetary period. The EulerCam light curve is shown in Figure 3, and the dataset is presented in Table 2.
2.4 Transit Confirmation with NGTS
TOI-222 was initially scheduled for a blind search with NGTS to recover the orbital period following its designations as a single-transit object of interest from TESS. We obtained 37 nights of single-telescope observations (18,510 images with 10 s exposures).
Once the system’s period was known, we scheduled NGTS observations to cover the next primary eclipse of TOI-222, occurring on 17 Jul 2019. In total, 10 telescopes were used to simultaneously observe the primary eclipse, collecting over 10,000 individual data points with an exposure time of 10 seconds each. The data were reduced using the CASUTools11 1 http://casu.ast.cam.ac.uk/surveys-projects/software-release photometry package and we applied the SysRem algorithm (Tamuz et al. 2005) to detrend the data. For more details on NGTS, please refer to Wheatley et al. 2018. The resulting light curve was binned to 2 minutes and detrended using a third-order time polynomial, obtaining an RMS of 450 ppm .
We clearly detect the primary eclipse of TOI-222 with NGTS, confirming the slightly shorter period and distinct V-shape of the eclipse. The NGTS data are shown in Figure 3 and the data are given in Table 3.
| BJD | Flux | Flux error | xshift | yshift | airamass | FWHM | sky flux | exposure time |
|---|---|---|---|---|---|---|---|---|
| (-245000) | pixel | pixel | pixel | s | ||||
| 8647.819731 | 0.996430 | 0.001189 | -0.76 | 2.31 | 1.41 | 14.09 | 42.96 | 20.00 |
| 8647.820159 | 0.993507 | 0.001186 | -0.45 | 3.02 | 1.41 | 15.29 | 42.88 | 20.00 |
| 8647.820589 | 0.998077 | 0.001191 | -1.33 | 1.81 | 1.41 | 14.37 | 42.58 | 20.00 |
| 8647.821005 | 0.995025 | 0.001175 | 0.24 | 0.92 | 1.40 | 15.59 | 42.72 | 20.00 |
| 8647.821431 | 0.994832 | 0.001174 | 3.46 | -1.46 | 1.40 | 15.77 | 41.77 | 20.00 |
| BJD | Flux | Flux error |
|---|---|---|
| 2458681.682801 | 1.000619 | 0.001027 |
| 2458681.684190 | 0.998942 | 0.000992 |
| 2458681.685579 | 1.000491 | 0.000973 |
| 2458681.686967 | 1.000034 | 0.000956 |
| 2458681.688356 | 0.999649 | 0.000928 |
2.5 Additional high-resolution spectroscopy
2.5.1 High resolution spectroscopy with FEROS and CORALIE
The radial velocity variation of TOI-222 was also monitored using the FEROS spectrograph (Kaufer et al. 1999, R=48000) mounted on the MPG 2.2m telescope installed in La Silla Observatory. A total number of seven spectra were obtained between June 4 and July 13 of 2019. The adopted exposure time was of 300s which produced spectra with a typical SNR per resolution element of 130. Observations were performed using the simultaneous calibration mode in which a comparison fiber is illuminated with a Thorium-Argon lamp in order to trace the instrumental variations during the science exposure. Next to these data, we also obtained an additional four data points with CORALIE under Chilean time. These data were processed with the automated CERES package (Brahm et al. 2017) which performs the optimal extraction, wavelength calibration, and computation of precision radial velocities using the cross-correlation technique.
2.5.2 High resolution spectroscopy with MINERVA-Australis
A total of 60 spectra of TOI-222 were obtained at 15 epochs between 2019 May 11 and July 18, using the MINERVA-Australis telescope array at Mt. Kent Observatory in Queensland, Australia (Wittenmyer et al. 2018; Addison et al. 2019). All of the telescopes in the MINERVA-Australis array simultaneously feed a single Kiwispec R4-100 high-resolution (R 80,000) spectrograph with wavelength coverage from 500 to 630 nm over 26 echelle orders. Light from each of the four telescopes is delivered to individual fibres (numbered 3, 4, 5, and 6), and calibration is achieved via a simultaneous Thorium-Argon lamp illuminating fibres 1 and 7. We derived radial velocities for each telescope using the least-squares analysis of Anglada-Escudé & Butler 2012 and corrected for spectrograph drifts with simultaneous Thorium Argon arc lamp observations. TOI-222 was observed simultaneously with up to four telescopes, with one or two 30-minute exposures per epoch. The radial velocities from each telescope are given in Table 1 labeled by their fibre number. Each telescope (fibre) has its own velocity zero-point which is modelled as a free parameter, and the mean uncertainty of the 60 MINERVA-Australis observations is 4.5 m s-1. Additional scatter in the MINERVA data was introduced by a power cut at the observatory.
2.6 Speckle imaging
Nearby stars which fall within the same 21″ TESS pixel as TOI-222 could contaminate the TESS photometry, resulting in a reduced transit depth. We searched for unaccounted companions to TOI-222 with SOAR speckle imaging (Tokovinin 2018) on 18 May 2019 UT, observing in a similar visible bandpass as TESS. Additional details of the observation are available in Ziegler et al. 2019. We detected no nearby stars within 3″of TOI-222. The 5 detection sensitivity and the speckle auto-correlation function from the SOAR observation are plotted in Figure 4.

3 System Analysis
3.1 Properties of the Primary
We used the CORALIE spectra to derive atmospheric parameters for the primary. Each spectrum was corrected into the laboratory reference frame and co-added onto a common wavelength range. Maximum and median filters were applied to identify continuum regions which were fitted with spline functions (one every nm) to normalise the spectra (Blanco-Cuaresma et al. 2014, a standard function within ispec v20161118; ). We used wavelet analysis (Gill et al. 2018) to determine the best-fitting atmospheric parameters for the host star, which works by comparing the wavelet coefficients of the target spectrum to a grid of model spectra. We re-sample between 450-650 nm with 217 values and co-add the spectra. We calculate the wavelet coefficients Wi=4-14 and fit the same coefficients with model spectra (identical to those used in Gill et al. 2018 and Gill et al. 2019) in a Bayesian framework. We initiated 100 walkers and generated 10,000 draws as a burn-in phase. We generated a further 10,000 draws to sample the posterior probability distribution (PPD) for the stellar effective temperature (), metallicity ([Fe/H]), projected rotational velocity () and surface gravity (). Gill et al. 2018 note an [Fe/H] offset of -0.18 dex, which we correct for by adding 0.18 dex to the PPD for [Fe/H]. The wavelet method for CORALIE spectra can determine to a precision of 85 K, [Fe/H] to a precision of 0.06 dex and to a precision of 1.35 km s-1 for stars with 5 km s-1. However, measurements of log g from wavelet analysis are not reliable beyond confirming dwarf-like gravity (log g 4.5 dex). Subsequently, we fit the wings of the magnesium triplets with spectral synthesis by fixing , [Fe/H] and and changing log g until an acceptable fit was found. The inferred values are listed in Table 4.
For an empirical determination of the stellar radius, we performed an analysis of the broadband spectral energy distribution (SED) together with the Gaia parallax, following the procedures described in Stassun & Torres 2016; Stassun et al. 2017; Stassun et al. 2018. We pulled the magnitudes from Tycho-2, the magnitudes from APASS, the magnitudes from 2MASS, the W1–W4 magnitudes from WISE, the magnitude from Gaia, and the FUV and NUV fluxes from GALEX. Together, the available photometry spans the full stellar SED over the wavelength range 0.15–22 m. We performed a fit using Kurucz stellar atmosphere models, with the priors on , , and [Fe/H] from the spectroscopic analysis. The remaining free parameter is the extinction (), which we limited to the maximum line-of-sight extinction from the Schlegel et al. 1998 dust maps. The resulting fit is good with a reduced of 3.9, and a best fit extinction of . Integrating the (unextincted) model SED gives the bolometric flux at Earth of erg s cm-2. Taking the and together with the Gaia parallax, adjusted by mas to account for the systematic offset reported by Stassun & Torres 2018, gives the stellar radius as R⊙.
We verified the above SED fitting of TOI-222 with the method outlined in Gillen et al. 2017, using the PHOENIX v2 set of models with the information available from blended catalogue photometry and Gaia photometric and astrometric data listed in Table 4 (see Figure 5). Both methods are in very good agreement.
In addition, we can estimate the stellar mass from the eclipsing-binary based empirical relations of Torres et al. 2010, which gives , This, together with the empirical radius above, gives the mean stellar density .
| Property | Value | Source |
|---|---|---|
| Astrometric Properties | ||
| RA | 2MASS | |
| Dec | 2MASS | |
| 2MASS I.D. | J23563876-4443086 | 2MASS |
| (mas y-1) | UCAC4 | |
| (mas y-1) | UCAC4 | |
| Photometric Properties | ||
| V (mag) | APASS | |
| B (mag) | APASS | |
| g (mag) | APASS | |
| r (mag) | APASS | |
| i (mag) | APASS | |
| G (mag) | Gaia | |
| T (mag) | TESS | |
| J (mag) | 2MASS | |
| H (mag) | 2MASS | |
| K (mag) | 2MASS | |
| W1 (mag) | WISE | |
| W2 (mag) | WISE | |
| Derived Properties | ||
| Teff (K) | CORALIE Spectra | |
| CORALIE Spectra | ||
| vsini (km s-1) | CORALIE Spectra | |
| (km s-1) | CORALIE Spectra | |
| log g | CORALIE Spectra | |
| () | SED fit | |
| () | TO | |
| () | ||
| Distance (pc) | BJ | |
| 2MASS (Skrutskie et al. 2006); UCAC4 (Zacharias et al. 2013); | ||
| APASS (Henden & Munari 2014); WISE (Wright et al. 2010); | ||
| Gaia (Gaia Collaboration et al. 2016) | ||
| ER = empirical relations using Benedict et al. 2016 | ||
| and Mann et al. 2015 | ||
| TO = interpolated from Torres et al. 2010 | ||
| BJ = from Bailer-Jones et al. 2018 | ||

3.2 Orbital solution
3.2.1 MCMC framework
We made use of the COde for transiting exoplaNet ANalysis, a Markov Chain Monte Carlo (MCMC) framework to carry out a simultaneous analysis of transit and radial-velocity data. CONAN is based on the transit analysis code described in Lendl et al. 2017, with the added capacities of jointly analysing RV and transit data and thus deriving consistent system properties. CONAN is capable of simultaneously modelling multiple transit and RV data sets, deriving global system properties while allowing for independent baseline models for each data set. The MCMC engine can be set to either emcee (Foreman-Mackey et al. 2017) or MC3 (Cubillos et al. 2017).
To compute transit and RV models, CONAN uses the routines of (Kreidberg 2015) and a Keplerian respectively. The MCMC jump (i.e., fitted) parameters are
- •
the stellar-to-planetary radius ratio,
- •
the timing of mid-transit,
- •
the orbital inclination,
- •
the normalised orbital semi-major axis,
- •
the planetary orbital period,
- •
the RV amplitude,
- •
and to derive the eccentricity and the argument of periastron
- •
the combination of the systemic RV, , together with the RV zero point of each RV data set,
- •
the linear combinations and of the quadratic limb-darkening coefficients and (Holman et al. 2006)
Most photometric time-series are affected by some degree of correlated noise, of observational (e.g. differential effects due to reference stars differing in colour), instrumental (e.g. telescope pointing jitter paired with flat field inhomogeneities) or stellar (e.g. rotational variability) origin. We account for these effects by using parametric baseline models in the form of a combination polynomials or trigonometric functions in one or several state variables (e.g., time, stellar FWHM, coordinate shifts, airmass, e.g. see Gillon et al. 2010; Lendl et al. 2017). The coefficients can either be found via least-square minimisation at each MCMC step, or included as MCMC jump parameters. While both approaches fulfil the requirement that baseline coefficients are fit at the same time as the transit parameters (and therefore assure that uncertainties in the baseline parameters are propagated to the inferred transit parameters), the earlier leads to enhanced convergence while being computationally more expensive, the latter allows to trace correlation between the baseline model and transit parameters. Convergence of the MCMC chains is checked with the Gelman & Rubin test (Gelman & Rubin 1992).
We also include two approaches to compensate for excess noise. Either, the user can choose to scale the errors via the method that consists in comparing the binned and non-binned light curve residuals (Winn et al. 2008; Gillon et al. 2010), or decide to quadratically add extra noise to each light curve to reach a reduced chi-square equal to unity. Both approaches assure correct weighing between individual data sets. The latter does so on the basis of assuming white Gaussian noise, while the former compensates for excess red noise and often results in values below unity. Also RV measurements are often affected by excess noise, most prominently due to stellar activity. CONAN allows to account for this RV jitter by adding excess noise quadratically to the RV errors such that is reached.
To compute physical properties from the fitted data, CONAN uses input values for and , and draws from Gaussian distributions centred on these values, and with a user-specified width, for each parameter state output by the MCMC. Here, one may define both and , or define one and fit for the other using the information contained in the transit light curve.
3.3 The TOI-222 system
We used CONAN together with the stellar parameters inferred from the CORALIE data as described in Section 3.1 to derive the properties of the TOI-222 system. Stellar limb-darkening was treated using a quadratic law, with the coefficients derived using the procedures by (Espinoza & Jordán 2015), and held fixed during the analysis. RV data from CORALIE and FEROS were fitted without the need of including a trend, however the MINERVA RVs were affected by an instrumental drift which we compensated by fitting (individually) quadratic drifts to the RV values of fibres 3,4 and 6 and a linear drift to RVs from fibre 5. The photometric baseline models used were a third-order time polynomial for the NGTS data, and a combination of second order polynomials in the stellar FWHM and the sky flux for the EulerCam data. The previously-detrended TESS data were cut to a shorter sequence of 1-day length centred on the transit and only a constant flux offset was fitted. The light curves are shown in Figure 3. To aid convergence, we first carried out a least-square minimisation and used the resulting values as starting points for the MCMC chains.
The primary eclipse of TOI-222 is highly grazing, with an impact parameter larger than unity. This inhibits the precise measurement of the secondary star’s radius as the radius ratio is strongly correlated with the system’s inclination (a larger secondary will create a similarly shallow eclipse when the impact parameter of the eclipse is larger). This means that, albeit the exquisite precision of the photometry, the secondary radius is only loosely constrained. The parameters of the TOI-222 system are summarised in Table 5.
| Jump parameters | |
|---|---|
| , [BJD - 2450000] | |
| Radius ratio, | |
| Inclination [deg] | |
| Period [d] | |
| RV amplitude [] | |
| Primary parameters from spectral analysis | |
| [] | |
| [] | |
| Derived parameters | |
| [] | |
| [] | |
| Orbital semi-major axis [au] | |
| Primary eclipse impact parameter | |
| Orbital eccentricity | |
| Argument of periastron [deg] | |
| Fixed quadratic limb-darkening parameters | |
| Radial velocity zero point offsetsa, [] | |
| CORALIE (CERES) | |
| FEROS | |
| MINERVA3 | |
| MINERVA4 | |
| MINERVA5 | |
| MINERVA6 | |
4 Conclusions and Outlook
We present the ephemeris recovery and orbital characterisation of the single-transit TESS candidate TOI-222 by means of radial-velocity monitoring with CORALIE and ground-based photometry with EulerCam and NGTS. TOI-222 is a binary system with a low-mass eclipsing component orbiting a V=9.3 G2V star in a 33.9 day orbit, showing 3500 ppm-deep grazing eclipses. By observing simultaneously with 10 individual 20 cm NGTS telescopes, we obtain a photometric precision better than 500 ppm per 2 minute bin. This demonstrates that we can reach the precision needed to retrieve small-amplitude signals using this technique. While TOI-222 counts as a false positive in the realm of exoplanet discoveries, this detection highlights that long-period single-transit events can be efficiently recovered from the ground, provided well-coordinated high-precision RV and photometric facilities are available. In the light of the several hundreds of predicted single transit candidates from TESS (Cooke et al. 2018; Villanueva et al. 2019), this opens up a promising avenue for the confirmation of long-period transiting planets.
TOI-222, and future similar discoveries, are particularly exciting as they represent some of the most isolated M-dwarfs with physical properties measured using radial velocities and eclipse photometry. Non-transiting low-mass binaries characterised with radial velocity measurements and/or astrometry require mass-radius-luminosity relations (e.g. Delfosse et al. 2000 or Southworth 2009) which carry relatively large uncertainties and can often be unreliable. Some M-dwarfs around F-/G-type stars have been measured to be hotter and larger than predicted by stellar evolution models. Of those measured within the EBLM project (Hebb et al. 2012), two stars (WASP30B and J101301) appear to be inflated, and a third (J011331) is measured to be hotter than expected. A similar result was also seen for KIC1571511 (Ofir et al. 2012) using high-precision optical photometry from the Kepler space telescope. The favoured explanation lies with magnetic activity, as M-dwarfs in binary systems can be kept in fast rotation regime, by tidal-induced spin-orbit synchronisation, generating a enhanced magnetic field via dynamo action (Chabrier et al. 2007). The effect of this is two-fold: an inhibition of convection in the (almost) fully convective core and higher spot coverage (Gough & Tayler 1966). Compared to these objects, TOI-222 has a relatively large orbital period and thus a large orbital separation. TOI-222 is also not in synchronous rotation, as the spectroscopically-determined implies faster rotation, with a period of at least 14.7 days. Due to the grazing configuration, the TOI-222 system itself is not suited to probe trends between radius inflation and orbital separation. Similar systems however, which are likely to be found from TESS single transit events in the future, will be instrumental in building a larger sample of well-detatched low-mass eclipsing binaries needed to carry out these studies.
Acknowledgements
We thank the Swiss National Science Foundation (SNSF) and the Geneva University for their continuous support to our planet search programs. Contributions at the University of Geneva by FB, LN, ML, OT, and SU were carried out within the framework of the National Centre for Competence in Research "PlanetS" supported by the Swiss National Science Foundation (SNSF). Based on data collected under the NGTS project at the ESO La Silla Paranal Observatory. The NGTS facility is operated by the consortium institutes with support from the UK Science and Technology Facilities Council (STFC) under projects ST/M001962/1 and ST/S002642/1. The contributions at the University of Warwick by PJW, RGW, DLP, DJA, and TL have been supported by STFC through consolidated grants ST/L000733/1 and ST/P000495/1. DJA acknowledges support from the STFC via an Ernest Rutherford Fellowship (ST/R00384X/1). The contributions at the University of Leicester by MGW and MRB have been supported by STFC through consolidated grant ST/N000757/1. CAW acknowledges support from the STFC grant ST/P000312/1. TL was also supported by STFC studentship 1226157. MNG acknowledges support from MIT’s Kavli Institute as a Torres postdoctoral fellow. ML acknowledges support from the Austrian Research Promotion Agency (FFG) under project 859724 “GRAPPA”. JSJ acknowledges support by Fondecyt grant 1161218 and partial support by CATA-Basal (PB06, CONICYT). JIV acknowledges support of CONICYT-PFCHA/Doctorado Nacional-21191829, Chile. RB acknowledges support from FONDECYT Post-doctoral Fellowship Project 3180246, and from the Millennium Institute of Astrophysics (MAS). AJ acknowledges support from FONDECYT project 1171208, and by the Ministry for the Economy, Development, and Tourism’s Programa Iniciativa Científica Milenio through grant IC 120009, awarded to the Millennium Institute of Astrophysics (MAS). This project has received funding from the European Research Council (ERC) under the European Union’s Horizon 2020 research and innovation programme (grant agreement No 681601). The research leading to these results has received funding from the European Research Council under the European Union’s Seventh Framework Programme (FP/2007-2013) / ERC Grant Agreement n. 320964 (WDTracer). MINERVA-Australis is supported by Australian Research Council LIEF Grant LE160100001, Discovery Grant DP180100972, Mount Cuba Astronomical Foundation, and institutional partners University of Southern Queensland, UNSW Australia, MIT, Nanjing University, George Mason University, University of Louisville, University of California Riverside, University of Florida, and The University of Texas at Austin. We respectfully acknowledge the traditional custodians of all lands throughout Australia, and recognise their continued cultural and spiritual connection to the land, waterways, cosmos, and community. We pay our deepest respects to all Elders, ancestors and descendants of the Giabal, Jarowair, and Kambuwal nations, upon whose lands the Minerva-Australis facility at Mt Kent is situated. Funding for the TESS mission is provided by NASA’s Science Mission directorate. We acknowledge the use of public TESS Alert data from pipelines at the TESS Science Office and at the TESS Science Processing Operations Center. Resources supporting this work were provided by the NASA High-End Computing (HEC) Program through the NASA Advanced Supercomputing (NAS) Division at Ames Research Center for the production of the SPOC data products.
References
- Addison et al. (2019) Addison B., et al., 2019, PASP, 131, 115003
- Anglada-Escudé & Butler (2012) Anglada-Escudé G., Butler R. P., 2012, ApJS, 200, 15
- Baglin et al. (2006) Baglin A., et al., 2006, in 36th COSPAR Scientific Assembly. p. 3749
- Bailer-Jones et al. (2018) Bailer-Jones C. A. L., Rybizki J., Fouesneau M., Mantelet G., Andrae R., 2018, AJ, 156, 58
- Benedict et al. (2016) Benedict G. F., et al., 2016, AJ, 152, 141
- Blanco-Cuaresma et al. (2014) Blanco-Cuaresma S., Soubiran C., Heiter U., Jofré P., 2014, A&A, 569, A111
- Borucki et al. (2010) Borucki W. J., et al., 2010, Science, 327, 977
- Brahm et al. (2017) Brahm R., Jordán A., Espinoza N., 2017, PASP, 129, 034002
- Brahm et al. (2019) Brahm R., et al., 2019, AJ, 158, 45
- Chabrier et al. (2007) Chabrier G., Gallardo J., Baraffe I., 2007, A&A, 472, L17
- Cooke et al. (2018) Cooke B. F., Pollacco D., West R., McCormac J., Wheatley P. J., 2018, A&A, 619, A175
- Cubillos et al. (2017) Cubillos P., Harrington J., Loredo T. J., Lust N. B., Blecic J., Stemm M., 2017, AJ, 153, 3
- Delfosse et al. (2000) Delfosse X., Forveille T., Ségransan D., Beuzit J.-L., Udry S., Perrier C., Mayor M., 2000, A&A, 364, 217
- Espinoza & Jordán (2015) Espinoza N., Jordán A., 2015, MNRAS, 450, 1879
- Foreman-Mackey et al. (2017) Foreman-Mackey D., Agol E., Ambikasaran S., Angus R., 2017, AJ, 154, 220
- Gaia Collaboration et al. (2016) Gaia Collaboration et al., 2016, A&A, 595, A2
- Gandolfi et al. (2018) Gandolfi D., et al., 2018, A&A, 619, L10
- Gelman & Rubin (1992) Gelman A., Rubin D., 1992, Statist. Sci., 7, 457
- Gill et al. (2018) Gill S., Maxted P. F. L., Smalley B., 2018, A&A, 612, A111
- Gill et al. (2019) Gill S., et al., 2019, A&A, 626, A119
- Gillen et al. (2017) Gillen E., Hillenbrand L. A., David T. J., Aigrain S., Rebull L., Stauffer J., Cody A. M., Queloz D., 2017, ApJ, 849, 11
- Gillon et al. (2010) Gillon M., et al., 2010, A&A, 511, A3
- Gough & Tayler (1966) Gough D. O., Tayler R. J., 1966, MNRAS, 133, 85
- Hebb et al. (2012) Hebb L., Gomez Maqueo Chew Y., Pollacco D., Stassun K., Collier Cameron A., 2012, in American Astronomical Society Meeting Abstracts #219. p. 345.15
- Henden & Munari (2014) Henden A., Munari U., 2014, Contributions of the Astronomical Observatory Skalnate Pleso, 43, 518
- Holman et al. (2006) Holman M. J., et al., 2006, ApJ, 652, 1715
- Huang et al. (2018) Huang C. X., et al., 2018, ApJ, 868, L39
- Jenkins et al. (2016) Jenkins J. M., et al., 2016, in Proc. SPIE. p. 99133E, doi:10.1117/12.2233418
- Kaufer et al. (1999) Kaufer A., Stahl O., Tubbesing S., Nørregaard P., Avila G., Francois P., Pasquini L., Pizzella A., 1999, The Messenger, 95, 8
- Kreidberg (2015) Kreidberg L., 2015, PASP, 127, 1161
- Lendl et al. (2012) Lendl M., et al., 2012, A&A, 544, A72
- Lendl et al. (2017) Lendl M., Cubillos P. E., Hagelberg J., Müller A., Juvan I., Fossati L., 2017, preprint, (arXiv:1708.05737)
- Mann et al. (2015) Mann A. W., Feiden G. A., Gaidos E., Boyajian T., von Braun K., 2015, ApJ, 804, 64
- Nielsen et al. (2019) Nielsen L. D., et al., 2019, A&A, 623, A100
- Ofir et al. (2012) Ofir A., Gandolfi D., Buchhave L., Lacy C. H. S., Hatzes A. P., Fridlund M., 2012, MNRAS, 423, L1
- Osborn et al. (2016) Osborn H. P., et al., 2016, MNRAS, 457, 2273
- Pepe et al. (2002) Pepe F., et al., 2002, The Messenger, 110, 9
- Queloz et al. (2001) Queloz D., et al., 2001, The Messenger, 105, 1
- Ricker et al. (2014) Ricker G. R., et al., 2014, in Space Telescopes and Instrumentation 2014: Optical, Infrared, and Millimeter Wave. p. 914320 (arXiv:1406.0151), doi:10.1117/12.2063489
- Schlegel et al. (1998) Schlegel D. J., Finkbeiner D. P., Davis M., 1998, ApJ, 500, 525
- Skrutskie et al. (2006) Skrutskie M. F., et al., 2006, AJ, 131, 1163
- Smith et al. (2012) Smith J. C., et al., 2012, PASP, 124, 1000
- Southworth (2009) Southworth J., 2009, MNRAS, 394, 272
- Stassun & Torres (2016) Stassun K. G., Torres G., 2016, ApJ, 831, L6
- Stassun & Torres (2018) Stassun K. G., Torres G., 2018, ApJ, 862, 61
- Stassun et al. (2017) Stassun K. G., Collins K. A., Gaudi B. S., 2017, AJ, 153, 136
- Stassun et al. (2018) Stassun K. G., Corsaro E., Pepper J. A., Gaudi B. S., 2018, AJ, 155, 22
- Stumpe et al. (2014) Stumpe M. C., Smith J. C., Catanzarite J. H., Van Cleve J. E., Jenkins J. M., Twicken J. D., Girouard F. R., 2014, PASP, 126, 100
- Tamuz et al. (2005) Tamuz O., Mazeh T., Zucker S., 2005, MNRAS, 356, 1466
- Tokovinin (2018) Tokovinin A., 2018, PASP, 130, 035002
- Torres et al. (2010) Torres G., Andersen J., Giménez A., 2010, A&ARv, 18, 67
- Villanueva et al. (2019) Villanueva Jr. S., Dragomir D., Gaudi B. S., 2019, AJ, 157, 84
- Wang et al. (2019) Wang S., et al., 2019, AJ, 157, 51
- Wheatley et al. (2018) Wheatley P. J., et al., 2018, MNRAS, 475, 4476
- Winn et al. (2008) Winn J. N., et al., 2008, ApJ, 683, 1076
- Wittenmyer et al. (2018) Wittenmyer R. A., Horner J., Carter B. D., Kane S. R., Plavchan P., Ciardi D., MINERVA-Australis consortium t., 2018, arXiv e-prints, p. arXiv:1806.09282
- Wright et al. (2010) Wright E. L., et al., 2010, AJ, 140, 1868
- Zacharias et al. (2013) Zacharias N., Finch C. T., Girard T. M., Henden A., Bartlett J. L., Monet D. G., Zacharias M. I., 2013, AJ, 145, 44
- Ziegler et al. (2019) Ziegler C., Tokovinin A., Briceno C., Mang J., Law N., Mann A. W., 2019, arXiv e-prints, p. arXiv:1908.10871