First inverse kinematics study of the 22NeNa reaction and its role in AGB star and classical nova nucleosynthesisPreprint: APS/123-QED
Abstract
- Background
-
Globular clusters are known to exhibit anomalous abundance trends such as the sodium-oxygen anti-correlation. This trend is thought to arise via pollution of the cluster interstellar medium from a previous generation of stars. Intermediate-mass asymptotic giant branch stars undergoing Hot Bottom Burning (HBB) are a prime candidate for producing sodium-rich oxygen-poor material, and then expelling this material via strong stellar winds. The amount of 23Na produced in this environment has been shown to be sensitive to uncertainties in the 22NeNa reaction rate. The 22NeNa reaction is also activated in classical nova nucleosynthesis, strongly influencing predicted isotopic abundance ratios in the Na-Al region. Therefore, improved nuclear physics uncertainties for this reaction rate are of critical importance for the identification and classification of pre-solar grains produced by classical novae.
- Purpose
-
At temperatures relevant for both HBB in AGB stars and classical nova nucleosynthesis, the 22NeNa reaction rate is dominated by narrow resonances, with additional contribution from direct capture. This study presents new strength values for seven resonances, as well as a study of direct capture.
- Method
-
The experiment was performed in inverse kinematics by impinging an intense isotopically pure beam of 22Ne onto a windowless H2 gas target. The 23Na recoils and prompt rays were detected in coincidence using a recoil mass separator coupled to a bismuth-germanate (BGO) scintillator array surrounding the target.
- Results
-
For the low energy resonances, located at center of mass energies of 149, 181 and 248 keV, we recover stength values of , , and eV, respectively. These results are in broad agreement with recent studies performed by the LUNA and TUNL groups. However, for the important reference resonance at 458 keV we obtain a strength value of eV, which is significantly lower than recently reported values. This is the first time that this resonance has been studied completely independently from other resonance strengths. In the case of direct capture, we recover an S-factor of 60 keVb, consistent with prior forward kinematics experiments.
- Conclusions
-
In summary, we have performed the first direct measurement of 22NeNa in inverse kinematics. Our results are in broad agreement with the literature, with the notable exception of the 458 keV resonance, for which we obtain a lower strength value. We assessed the impact of the present reaction rate in reference to a variety of astrophysical environments, including AGB stars and classical novae. Production of 23Na in AGB stars is minimally influenced by the factor of 4 increase in the present rate compared to the STARLIB-2013 compilation. The present rate does however impact upon the production of nuclei in the Ne-Al region for classical novae, with dramatically improved uncertainties in the predicted isotopic abundances present in the novae ejecta.
pacs
Valid PACS appear hereI Introduction
Globular clusters (GCs) are dense associations of stars that formed in the early universe. Containing some of the oldest observed stars, these remarkable objects provide estimates for the age of our galaxy as well as a lower limit on the age of the universe Krauss and Chaboyer 2003. In addition to their cosmological importance, GCs are important test sites for the study of galactic chemical evolution as they are thought to consist of a single coeval population of stars. However, advances in optical astronomy have challenged this simple picture, with many globular clusters containing multiple generations of stars accompanied by anomalous abundance correlations Gratton et al. 2004; Gratton et al. 2012; Carretta et al. 2011; Yong et al. 2003. One such abundance trend is the sodium-oxygen anti-correlation, which is observed ubiquitously over all well-studied globular clusters to date. This abundance trend is not reproduced in field stars however, suggesting that the cluster environment itself has a profound influence.
The site responsible for the Na-O anti-correlation must reach temperatures sufficient for activation of both the CNO and NeNa cycles. However, this abundance trend is observed in many stars that could not have reached the required core temperatures for nucleosynthesis beyond Prantzos, N. et al. 2007. This leads to the idea that the cluster environment must have been enriched by a previous generation of stars. Massive () AGB stars undergoing Hot Bottom Burning (HBB) have been put forward as prime candidates for polluting the cluster interstellar medium (ISM) D’Antona F. 1983; Ventura, P. and D’Antona, F. 2008. Other potential scenarios could also contribute, such as: fast rotating massive stars Decressin, T. et al. 2007, massive binaries de Mink, S. E. et al. 2009, and supermassive stars Denissenkov and Hartwick 2014; though AGB stars remain the most likely site to be the dominant source of sodium-rich oxygen-poor material Renzini 2008; Lee 2010. Here, 23Na is produced at the base of the convective hydrogen envelope by radiative proton capture on 22Ne; the third most abundant nuclide produced in core helium burning Buchmann and Barnes 2006. According to stellar evolution calculations Ventura, P. and D’Antona, F. 2005, temperatures at the base of the convective envelope reach to approximately 0.1 GK which is sufficient to activate the NeNa and MgAl burning cycles. This leads to a rise in the Na and Al content of the surrounding stellar envelope as the processed material is brought to the surface by successive third dredge up (TDU) episodes as the star undergoes thermal pulses. The oxygen content is simultaneously reduced by activation of the ON cycle, resulting in the observed NaO anti-correlation.
The 22NeNa reaction also plays a role in classical novae nucleosynthesis. A sensitivity study performed by Iliadis et al. Iliadis et al. 2002 showed that in the case of oxygen-neon (ONe) novae with underlying white dwarf masses of 1.15 and 1.25 , reaching respective peak temperatures of and 0.251 GK, the final abundance of 22Ne was altered by up to 6 orders of magnitude as a result of varying the rate within its upper and lower uncertainty limits. Whereas, in the case of carbon-oxygen (CO) novae with a 1 white dwarf mass ( GK), 22Ne was affected by a factor of 100, 23Na by a factor of 7, 24Mg by a factor of 5, as well as factor of 2 changes in 20Ne, 21Ne, 25Mg, 26Mg, 26Al and 27Al.
The 22NeNa reaction rate has carried an exceptionally large uncertainty due to a number of (until recently) unobserved resonances, many of which reside in the Gamow window for both classical novae and HBB in AGB stars. The discrepancy in available rate compilations spans a factor of 1000 between the NACRE Angulo et al. 1999 and STARLIB-2013 Sallaska et al. 2013a compilations. This situation was recently changed by an experiment performed at the LUNA facility Broggini et al. 2010, in which the strengths of three new resonances at and keV (where is the resonance energy in the center of mass frame) were measured by Cavanna et al. Cavanna et al. 2015. The existence of the two lowest energy resonances were subsequently confirmed by Kelly et al. Kelly et al. 2017 in a study performed at the LENA facility Cesaratto et al. 2010; Longland et al. 2006. This latter study measured the strengths of the aforementioned resonances relative to that of the 458 keV resonance reported in Ref Kelly et al. 2015. The LUNA study by Cavanna et al. also included direct upper limits for possible resonances at and 100 keV. These resonances were tentatively reported in a (3He,) transfer study by Powers et al. Powers et al. 1971, but could not be confirmed in a later study by Hale et al. Hale et al. 2002. Moreover, the corresponding states in 23Na at 8894 and 8862 keV were not observed in a 23NaNa measurement by Moss et al. Moss 1976, nor were they seen in a more recent spectroscopic study by Jenkins et al. Jenkins et al. 2013 using Gammasphere. These resonances have thus not been considered for both the reaction rates put forward by Kelly et al. and the present work. It is perhaps unsurprising that a subsequent attempt by the LUNA collaboration to measure these resonances directly, using a -ray spectrometer comprised of BGO instead of HPGe detectors, could not positively identify any yield from these resonances Ferraro et al. 2018. Although their newly obtained upper limits effectively remove the 100 keV resonance from contention as a significant contributor to the 22NeNa reaction rate, the 68 keV resonance remains a potential contributor, thus defining the upper limit of the new LUNA rate at temperatures below 0.1 GK.
The present work reports on the first inverse kinematics study of the 22NeNa reaction rate, performed using the Detector of Recoils And Gamma-rays Of Nuclear reactions (DRAGON). Here we present strength measurements for the three low energy resonances at center of mass energies of 149, 181 and 248 keV, along with the important reference resonances at 458, 610, 632 and 1222 keV (center of mass). The non-resonant cross section was also measured in the energy range of keV. All previous measurements of the 22NeNa reaction have been carried out in forward kinematics. The present study is thereby subject to a different set of systematic uncertainties than those already found in the literature. It is important, particularly in the case of reference resonances, to derive consistent strength values and S-factors (in the case of direct capture) from a variety of experimental techniques.
II Experiment Description
This study was performed using the Detector of Recoils And Gammas Of Nuclear reactions (DRAGON) Hutcheon et al. 2003, located in the ISAC-I experimental hall Laxdal 2003 at TRIUMF, Canada’s national laboratory for particle and nuclear physics. An isotopically pure beam of was generated by the Multi Charge Ion Source (MCIS) Jayamanna et al. 2010 in the charge state, which was then accelerated to lab energies in the range of keV/ via the ISAC-I Radio-Frequency Quadrupole (RFQ) and Drift-Tube Linac (DTL). The beam was delivered to the DRAGON experiment area with a maximum intensity of pps, and FWHM beam energy spread of .
The DRAGON facility consists of three primary components: (1) a windowless differentially pumped gas target surrounded by a -ray detector array, (2) an electromagnetic vacuum-mode mass separator, and (3) a series of heavy ion detectors located at the focal plane of the separator. The ion-optical configuration of the separator consists of two pairs of magnetic and electric dipole field elements, interspersed with quadrupole and sextupole lenses, as well as strategically placed slit systems for increased beam suppression.
The DRAGON -ray detector array, which surrounds the gas target, is comprised of 30 BGO scintillator crystals and photo-multiplier tubes (PMTs). The close-packed geometry of the array around the gas target vacuum box gives a total solid-angle coverage of 92%. The heavy-ion detectors employed for this study were a pair Micro-Channel Plate (MCP) detectors, followed by a Double-sided Silicon Strip Detector (DSSD) Tengblad et al. 2004. The pair of MCP detectors form a local transmission time-of-flight (TOF) measurement system, whereby ions can be identified via their transit time across a small section of beam-line. The transmitted ions are then stopped in the DSSD, where their kinetic energy is measured. Coincidences between recoils and prompt -rays were identified by a timestamp-based algorithm Christian et al. 2014.

The present experiment has several advantages over the techniques utilized in already published works for this reaction. Difficulties relating to the gaseous nature of both reactant species, such as contaminating background reactions and uncertain target stoichiometry, are circumvented by conducting the experiment in inverse kinematics with a window-less recirculated gas target. The stopping power of the beam through the target is also directly measured by tuning beam through DRAGON’s first magnetic dipole (see section III.2).
III Data Analysis
A total of sixteen successful yield measurements were made, at fourteen different beam energies. The present work targets seven resonances at center of mass energies of: 1222, 632, 610, 458, 248, 181, and 149 keV. The strength of the 632-keV resonance was measured at three different target pressures, in order to exclude contamination from the 610-keV resonance. The non-resonant cross section was also measured at seven different beam energies in the center of mass energy range from 282 keV to 511 keV.
III.1 Thick target yield, reaction cross section and resonance strength
Laboratory experiments of nuclear reaction cross sections (and resonance strengths) measure the reaction yield, which is defined per incident beam ion as:
| (1) |
where is the total number of reactions that occur, and is the number of beam ions incident on the target. At DRAGON, the total number of reactions is inferred by combining the number of detected recoils with the systematics of the experiment. Therefore, equation 1 can be re-written as:
| (2) |
where is the product of all efficiencies affecting the number of detected recoils, . Recoils can be measured either in coincidence with a -ray hit in the BGO detectors or without a detected -ray, referred to as coincidence and singles events respectively. The systematics of the two aforementioned event designation are slightly different, with the former influenced by the detection efficiency of the BGO array. The total detection efficiencies pertaining to singles and coincidence events are given as:
| (3) |
| (4) |
The first four terms in Equations 3 and 4 are common to both singles and coincidence events. These are: the recoil charge state fraction , MCP transmission efficiency , MCP detection efficiency and detection efficiency of the DSSD . is the live time fraction of the focal plane DAQ, whereas is the live time fraction where both the target (head) and focal plane (tail) DAQs are able to accept new triggers Christian et al. 2014.
The recoil transmission efficiency, , relates to the number of recoils that are produced within the acceptances of the separator. Obtained through simulation, this quantity depends on the kinematics of the radiative capture reaction and its effect on the transmission of recoils through the separator. The recoil-gamma coincidence efficiency is the probability that a transmitted recoil will be recorded in coincidence with a prompt -ray detected by the BGO array. This quantity is also obtained via simulation, calculated as:
| (5) |
where is the simulated number of reactions, and is the total number of -rays detected in coincidence with a recoil transmitted to the focal plane. Note that this definition of the recoil- coincidence efficiency already accounts for the transmission of recoils, therefore, need not be included in the total coincidence efficiency.
The total yield is related to the reaction cross section, integrated over the entire target length, by:
| (6) |
where is the total reaction cross section, is the effective target length, and is the number density of the hydrogen gas target. The number density is determined from the average pressure and temperature of the target via the ideal gas law.
The reaction cross section can be used to derive the astrophysical S-factor, , via the following definition:
| (7) |
where is the center of mass energy and the term is the Gamow factor, which accounts for the -wave penetrability at energies well-below the Coulomb barrier. This definition of the S-factor removes strongly energy dependent effects impacting the reaction cross section. For narrow resonances, wherein the resonance width is small compared to the target width, the reaction yield becomes the thick target yield . With center of mass target thicknesses in the range of - keV, all the resonances considered in this study are sufficiently narrow to satisfy the thick target yield condition. For a narrow Breit-Wigner resonance the thick target yield is related to the resonance strength by:
| (8) |
where is the resonance strength in , and are the projectile and target masses (in ) respectively, is the laboratory frame stopping power (eV/cm2), and is the de Broglie wavelength (cm) associated with the relative energy of the resonance in the center of mass frame.
III.2 Beam energy and stopping power
The incident beam energy was measured by tuning through the first magnetic dipole (MD1) onto a downstream pair of slits. The slit plates are electrically isolated so as to enable current to be measured on each plate. The slit plates are unsuppressed however, and therefore do not permit measurement of absolute current. Nonetheless, with the slits closed to 2 mm, they do serve as accurate beam tuning diagnostics to center a given charge state through MD1. The beam energy is related to the MD1 field, as measured by its NMR probe, through:
| (9) |
Where is the atomic mass of the beam, is the beam charge state after the target, is the MD1 field (in Tesla) measured by its NMR probe, is the atomic mass unit, is the the speed of light, and is a constant related to the effective bending radius of MD1 Hutcheon et al. 2012. The final term is a relativistic correction that has only a minor influence on the measured energy and is often neglected.
The total energy lost across the gas target was measured by using Equation 9 to determine the beam energy with and without gas present in the target. In instances where the incident beam exceeds the rigidity limit of MD1, as was the case for the yield measurement, the outgoing beam energy is measured at several gas target pressures. The incident energy is then found by a linear extrapolation of the measured beam energies to zero-pressure. The stopping power across the target can be directly obtained by combining the measured energy loss and target number density. The ability to directly measure stopping powers in the lab is a key advantage of the DRAGON facility as systematic uncertainties related to the use of semi-empirical codes such as SRIM Ziegler et al. 2010 are avoided.
III.3 Beam Normalization
The total number of incident beam ions was determined by taking hourly beam current measurements using a Faraday cup (FC4) positioned approximately 2 m upstream of the gas target. Beam fluctuations within each data taking run were accounted for by relating these regular current measurements to the number target atoms scattered into two ion implanted silicon (IIS) detectors, mounted at and relative to the beam axis. The beam normalization coefficient, R, for a given run, is obtained as:
| (10) |
where is the beam current as measured by FC4 and is the charge of the incident beam ions. is a short time interval, immediately proceeding a Faraday cup reading, over which the target pressure and number of elastically scattered protons is measured. The beam transmission efficiency through the target apertures is measured after each re-tune of the beam by recording the ratio of current measured by FC1 (immediately downstream of the target) over the current measured by FC4. The average normalization coefficient over all runs within a given yield measurement, , can then be used with Equation 11 to determine the total number of beam ions:
| (11) |
where is now the total number of elastically scattered protons, and is the average pressure measured over all runs.
III.4 Charge State Distribution
DRAGON is designed to accept only a single charge state through the separator to the focal plane detectors. Therefore, in order to recover the full reaction yield, the charge state fraction of the recoils to which DRAGON is tuned to accept must be known. For the present work, a stable beam of 23Na was tuned to DRAGON in order to measure the recoil charge state distributions. The incident beam energies and gas-target pressures were selected such that the outgoing beam would closely match the energies of the 23Na recoils from the targeted 22NeNa yield measurements.
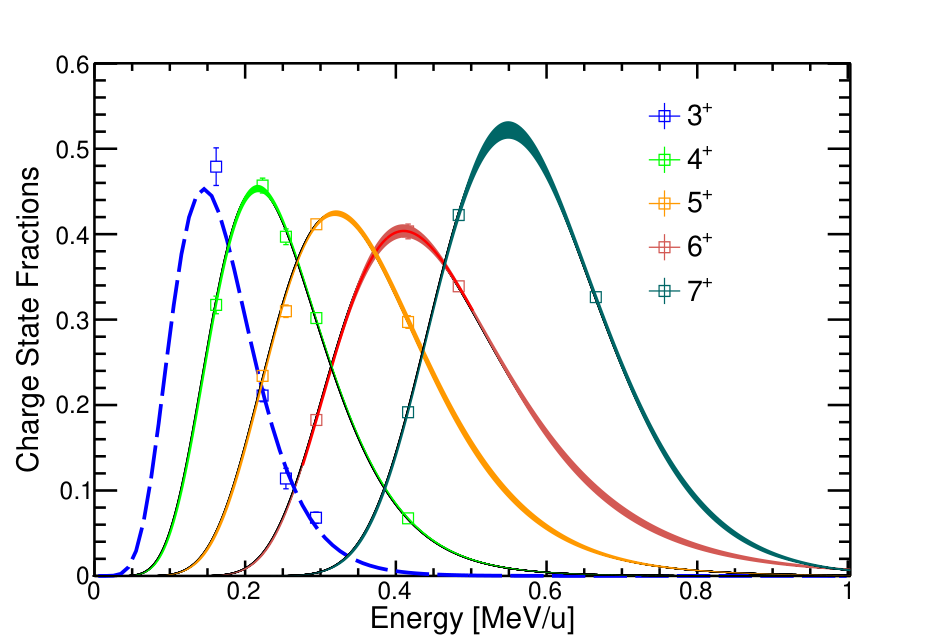
The charge state distributions were measured by tuning various charge states of the 23Na beam through the first magnetic dipole (MD1) with H2 gas present in the target. The charge states are centered onto a Faraday cup (FCCH) positioned at the charge focal plane immediately downstream of MD1 (see schematic of DRAGON shown in Figure 1). The resulting charge state distributions are then fit with a Gaussian normalized to unity. As a second step, the fraction of recoils in a given charge state as a function of outgoing 23Na energy were then fitted using the semi-empirical formula of Lui et al. Liu et al. 2003. The fit functions, and associated confidence bounds, were then evaluated for the outgoing recoil energies. The recoil charge state fractions for the lowest and highest energy measurements, at and 1222 keV respectively, required special consideration. In the case of the keV resonance the full charge state distribution could not be measured as 23Na ions emerging from the gas target in the charge state could not be bent by MD1. Instead, the charge state distribution measurement was performed after the experiment with the gas target pressure set such that the outgoing 23Na ions would have the same energy as those DRAGON was tuned to accept during the 22NeNa experimental run. The same procedure was utilized for determining the charge state fraction for the keV resonance since the charge state fractions were only measured at the outgoing 22NeNa recoil energy, and were not measured over a large enough energy range so as to provide a good fit using a semi-empirical formula.
IV Results
IV.1 Resonance at keV
The first absolute resonance strength measurement was reported by Keinonen et al. Keinonen et al. 1977 for the 1222-keV resonance, with a quoted strength value of eV. More recently, a study performed at Helmholtz-Zentrum Dresden-Rossendorf measured the ratio of the 1222-keV to 458-keV resonance strengths Depalo et al. 2015. In that work, the strength of the 1222-keV resonance was reported as eV, assuming a target thickness derived from a 458-keV resonance strength of eV Here we report a new absolute yield measurement for the 1222-keV resonance that is determined independently of other resonance strength values.
Beam suppression was optimal for this yield measurement, meaning that 23Na recoils could be easily identified using only the focal plane DSSD, without the need for an accompanying -ray detected in coincidence. Nonetheless, it is useful to first gate on the characteristic separator time-of-flight signal, i.e. the time between a -ray and heavy-ion event, in order to identify the region of interest in the DSSD. The separator TOF gate for this resonance is shown in the top-left panel of Figure 3. The DSSD energy spectrum, obtained from both singles only events, and coincidence events gated in the separator TOF signal, is displayed on the left panel of Figure 4. The DSSD spectra appears free from any leaky-beam contamination for both singles and coincidence events. The small tail on the low energy side of the peak is attributed to additional energy loss of recoils traversing the grid of aluminium contacts on the DSSD Tengblad et al. 2004. The imposed cut includes these events, and so the DSSD geometric efficiency of is used to account for inter-strip events Wrede et al. 2003.
From singles data, we extract a resonance strength of eV. In coincidences, assuming primary -ray branching ratios listed on the NNDC database Center, we recover a resonance strength of eV, in good agreement with the singles data. We therefore calculate a weighted average between the present and literature values to give an adopted strength value of eV.
The 1222-keV resonance strength has a strong impact on the high temperature behaviour of the reaction rate, with many resonances above 600 keV normalised to this resonance. In calculating the present rate all the resonances in the STARLIB-2013 compilation which are noted as being measured relative to the 1222-keV resonance have been re-normalized to the adopted value.
IV.2 Resonance at keV
This resonance was initially measured by Meyer et al. Meyer and Smit 1973 relative to the 610-keV resonance, from which a strength value of eV is obtained, in reference to an assumed 610-keV resonance strength of eV. This is significantly larger than results from a more recent study by Depalo et al., who report a resonance strength of eV for the 632-keV resonance Depalo et al. 2015. This was also a relative measurement, utilizing the 1222-keV and 458-keV resonances as references. The authors speculate that the original study by Meyer et al. may have been affected by contamination from the strong neighbouring resonance at 610 keV. To be sure that the present work is free from such contamination we performed separate yield measurements for this resonance at three different gas target pressures. If there were multiple resonances present in the target then one would expect to find some pressure dependence on the calculated yield and measured resonance energy.
| Pressure (Torr) | (keV) | (eV) | |
|---|---|---|---|
| Singles | Coincidences | ||
| 4.871(3) | |||
| 3.169(3) | |||
| 2.205(8) | |||
Table 1 lists the calculated strengths for the three different target pressures; no pressure dependence on the yield is evident. This would not be the case if a contaminating resonance were on the periphery of the gas target energy coverage. Moreover, from the measured energy loss across the target of 14.75 keV (center of mass) at the highest gas pressure used, the 610-keV resonance would be located some 12.2 cm downstream of the end of the gas target. In addition to the yield, one would also expect the calculated resonance energy to be affected by pressure changes. The resonance energies, determined via the BGO hit pattern method detailed in Ref Hutcheon et al. 2012, are also given in Table 1 and all agree on a resonance energy of keV based on an unweighted average over each measurement. Taking all this information together, we conclude that our resonance strength is not being influenced by contamination, and adopt a final strength value of eV based on a weighted average of the singes resonance strengths listed in Table 1.
The discrepancy between the present work with respect to the result by Depalo et al. Depalo et al. 2015 is not easily reconciled, since many systematic effects would produce similar discrepancies for other resonances where reasonable agreement is found. With regards to the previous Meyer et al. value Meyer and Smit 1973, the disagreement here is lessened slightly by re-normalising to the 610-keV resonance strength proposed in this work, which results in a increase in the strength to eV, bringing it to within agreement with respect to the present value. However, taking the literature into consideration as a whole we do not recommend this as a reference resonance.
IV.3 Resonance at keV
The narrow resonance at keV was measured relative to the 1222-keV resonance by Keininen et al. Keinonen et al. 1977. In that study, a resonance strength value of eV was reported for the keV resonance. This is in agreement with an earlier reported measurement by Meyer et al. Meyer and Smit 1973. More recently, this resonance was amongst those targeted by Depalo et al. Depalo et al. 2015. Again, the reported strength in that study is measured relative to both the 458-keV and 1222-keV resonances. The adopted value is calculated from the weighted average of the two relative measurements, quoted as eV, which is good agreement with the preexisting literature.
Unfortunately, excessive leaky-beam background prevented a result from being extracted using singles data. Instead, we obtain a coincidence result of eV. For obtaining the BGO coincidence efficiency we utilized the branching ratios published by Depalo et al. as inputs to the GEANT3 simulation. Our result is well within agreement of all values available in the literature. Therefore, we propose to adopt a weighted average of all the literature values as eV. Given the good agreement in the literature on the strength of this resonance, we propose the keV resonance as a good reference resonance.
IV.4 Resonance at keV
The general lack of well-measured reference resonances was commented upon by Longland et al. Longland et al. 2010, particularly for noble gas targets where issues related to target stochiometry can be especially troublesome. In the particular case of accurate reference resonances will also be of interest for other reaction rate studies. For instance, studies of 22Ne reaction rates, which are of importance for the weak s-process, have used resonances to normalize target thickness Giesen et al. 1993. The isolated narrow resonance at 458 keV is a potentially advantageous candidate to use as a reference due to its relatively large strength and location at a moderately accessible energy.
This resonance was measured over the course of hours of data-taking, with a total estimated number of 22Ne beam ions incident on target. A total of singles and coincident recoils were recorded (for a BGO threshold of MeV in the case of coincidences). The ability to accept such high intensity beams with excellent background suppression is a key advantage of the DRAGON facility; allowing high statistics results with little required measurement time. Figure 5 shows a comparison between the present work and the literature. Here we find significant disagreement with respect to recent measurements by Depalo et al. Depalo et al. 2015 and Kelly et al. Kelly et al. 2015, both of which are higher than the present value of eV, which we calculate based on a weighted average of singles and coincidence measurements. For the -recoil coincidence efficiency we utilized the recommended branching ratios by Kelly et al. Kelly et al. 2015 as inputs for the GEANT3 simulation.
| (keV) | (eV) | Screening | |||
| Literature | Present Work | Adopted | enhancement | ||
| Singles | Coincidences | factor, | |||
| 35 | |||||
| 68 | Cavanna et al. 2015; Depalo et al. 2016 | ||||
| Ferraro et al. 2018 | |||||
| 100 | Cavanna et al. 2015; Depalo et al. 2016 | ||||
| Ferraro et al. 2018 | |||||
| Cavanna et al. 2018a | 1.074 | ||||
| Kelly et al. 2017 | |||||
| Ferraro et al. 2018 | |||||
| Cavanna et al. 2018a | 1.055 | ||||
| Kelly et al. 2017 | |||||
| Ferraro et al. 2018 | |||||
| Cavanna et al. 2018a | 1.034 | ||||
| Ferraro et al. 2018 | |||||
| 417 | Depalo et al. 2015 | ||||
| Kelly et al. 2017 | |||||
| 458 | Kelly et al. 2015 | ||||
| Depalo et al. 2015 | |||||
| 610 | Keinonen et al. 1977 | ||||
| Depalo et al. 2015 | |||||
| 632 | Meyer and Smit 1973 | ||||
| Depalo et al. 2015 | |||||
| 1222 | Keinonen et al. 1977 | ||||
| Depalo et al. 2015 | |||||

Given the discrepancy between the present work and the literature, it is necessary to revisit the techniques employed to derive these strength values. The result presented by Kelly et al. Kelly et al. 2015 is obtained by applying an updated direct-to-ground state branching ratio to the previous measurement by Longland et al Longland et al. 2010, which used this branch to obtain the yield. Longland et al. determined the strength of the 458-keV resonance via a novel technique involving depth profiling the neon target content implanted into an aluminium substrate. Utilizing the -keV 27AlSi resonance strength reported in Ref Powell et al. 1998, a profile of the target stoichiometry was obtained by fitting the 27AlSi resonance yield. However, we note that the -keV 27Al + p resonance, from which the yield was used to determine the target stoichiometry, has a lower strength than that reported in a more recent measurement by Harissopulos et al. Harissopulos et al. 2000. If one assumes that the depth-profiling techniques allows for a simple re-normalisation of the target content then, after applying the new direct-to-ground state branch from Kelly et al. Kelly et al. 2015, the strength from that work becomes eV, in agreement with the present value. This inter dependency of relative strength measurements emphasizes the case for absolute techniques to precisely measure candidate reference resonances, a task for which DRAGON is well suited.
IV.5 Resonance at keV
This resonance was amongst the three low energy resonances reported by the LUNA collaboration Cavanna et al. 2015; Depalo et al. 2016. Here we report a strength value that lies between the first LUNA measurement and a more recent study by the LUNA group Ferraro et al. 2018, thus supporting a larger strength than previous upper limits Görres et al. 1982; Hale et al. 2002.
The lower-centre panel of Figure 3 shows the separator TOF spectrum for this yield measurement. The small background under the indicated signal region is due to random coincidences between background -rays and scattered leaky-beam making it to the focal plane. The background contribution was evaluated by sampling counts in 10 equal sized regions above and below the signal region to obtain a mean background expectation value. This was then subtracted from the signal to give the final number of recoils, with confidence bounds calculated using the Rolke method Rolke and López 2001 assuming a Poisson background model. From this we find a resonance strength of eV. The coincidence efficiency was obtained through simulation, using primary branching ratios published by Depalo et al. Depalo et al. 2016. Unfortunately, no singles result could be extracted due to overwhelming leaky-beam background at the focal plane.
This resonance has only a minor influence on the rate, with greater contributions derived from the other two low-energy resonances at 181 and 149 keV, as discussed in Section V.
IV.6 Resonance at keV
The first direct measurement for the resonance at 181 keV was reported by the LUNA collaboration Cavanna et al. 2015, and was later confirmed in a measurement at TUNL Kelly et al. 2017. The latter study measured the resonant yield relative to the 458-keV resonance strength reported in Ref Kelly et al. 2015. Both the TUNL study and initial LUNA study are in agreement, finding resonance strengths of and eV, respectively, which both lie just below that of the previous direct upper limit of eV set by Gorres et al. Görres et al. 1982. More recently the LUNA group re-measured this resonance, instead using a different set-up comprising a BGO -ray spectrometer. This study found a larger strength, compared with the previous LUNA measurement, of eV, which the authors attribute to greater sensitivity to weak branches that may have been missed by the previous measurement. Here we report a resonance strength of eV that is consistent to within of all the aforementioned literature values, and also in-keeping with the upper limit set by Gorres et al. Görres et al. 1982.
This yield measurement benefited from the increased selectivity provided by a fully functioning MCP-TOF system, following a recent replacement of both MCP detectors. The MCP vs Separator TOF spectrum is plotted in Figure 6, along with the separator TOF gated on the MCP-TOF signal. A distinct grouping of recoil events is clearly distinguished from leaky-beam background, the latter being uncorrelated with respect to the separator TOF. There is still nonetheless a small background contribution arising within the displayed signal gate that ought to be accounted for. The separator TOF spectrum, gated on the MCP-TOF signal region, is shown in the lower panel of Figure 6. An estimate of the background within the signal region was calculated by sampling the background above and below the separator TOF signal region. This estimate was then subtracted from the total signal, and confidence bounds calculated using the Rolke method Rolke and López 2001. For deriving the coincidence efficiency we utilized the branching ratios published from the TUNL study Kelly et al. 2017, which reports an additional weak -decay branch to the ground state.

IV.7 Resonance at keV
The role this resonance plays in the reaction rate was initially thought to be minimal, based on an indirect upper limit of eV obtained from a He, transfer study conducted by Hale et al. Hale et al. 2002. This upper limit is based on a spectroscopic factor assuming an transfer to the -keV state. Despite this study not being able to distinguish between an or transfer, an transfer was discounted based on an assumed spin-parity of for the resonance in question. However, a recent 12CC,Na study using Gammasphere revealed that this resonance in fact comprises a doublet: one state, and a second state at keV with a tentatively assigned spin-parity Jenkins et al. 2013. The literature surrounding the spin-parity assignment of this state, and interpretation of transfer data in-lieu of new spectroscopic information, is discussed in detail by Kelly et al. Kelly et al. 2017.

In this work we present a new absolute strength measurement for the keV resonance. The total number of recoils is obtained in a similar fashion to that explained in the previous section for the keV resonance. The separator vs MCP-TOF spectrum is shown on Figure 7, with a MeV -ray threshold. The BGO software threshold was optimised during offline analysis by comparing the BGO energy spectrum to simulation; this comparison (shown on Figure 8) revealed that the signal-to-background could be improved by raising the software-imposed threshold to 2.5 MeV as opposed to a typical 2 MeV threshold used for all other yield measurements. The coincidence efficiency was then obtained for the aforementioned BGO energy gate, assuming the -ray branching ratios put forward by Kelly et al. Kelly et al. 2017. Though within agreement, our obtained strength of eV is lower than those reported by TUNL Kelly et al. 2017 and both LUNA measurements Cavanna et al. 2018a; Ferraro et al. 2018. It is perhaps worth noting that for the TUNL result, given that this was measured relative to the 458 keV resonance strength reported in Ref Kelly et al. 2015, if one were to re-normalise to the 458 keV strength adopted in the present work then their result would be shifted down to eV. This lower value favours the present lower strength, albeit not in a particularly statistically significant manner.
IV.8 Direct-Capture Yield Measurements
The direct capture cross section was measured by Rolfs et al. Rolfs et al. 1975 and Gorres et al. Görres et al. 1983 in the energy range of . These energies are too large to be of direct astrophysical importance, but were extrapolated down to lower energies using a direct capture model Rolfs 1973. Based on these results, an effective S-factor of keVb was extracted. More recently, the direct capture data has been extended to lower energies by both the TUNL Kelly et al. 2017 and LUNA Ferraro et al. 2018 groups. Here we present data in the energy range of keV.
It is worth noting that carrying out direct capture measurements using inverse kinematics methods, such as employed at DRAGON, means that the yield scales with the total non-resonant cross section, rather than the sum of partial cross sections for observed transitions. However, since we could only extract results from coincidence data, there is a second-order dependence on how unobserved transitions may impact the simulated coincidence efficiency. In order to obtain the primary branching ratios required for the simulation input, we extrapolated (to each measured C.M. energy) the partial cross sections predicted for each contributing state using the direct capture model of Ref Rolfs 1973, and proton spectroscopic factors published by Gorres et al. Görres et al. 1983. An approximate uncertainty of was assumed in these predictions, based on the recommendation from Hale et al. Hale et al. 2002. To understand how this might influence the coincidence efficiency, the extrapolated partial cross sections were randomised by folding in with a random Gaussian distribution with a sigma-width equal to of the central value. This procedure generated many possible primary branching ratio inputs, which were all simulated to obtain the spread in coincidence efficiencies one would expect based on the assumed uncertainty in the primary branch inputs. However, after some 30 simulations at each energy, the spread in calculated efficiencies turned out to be much less than the assumed systematic uncertainty in the simulation. The simulation input was further modified such that reactions are generated uniformly across the length of the target, in-keeping with a uniform cross-section arising due to non-resonant capture. For reference, the simulation normally generates reactions sampled from a Breit-Wigner shaped cross section; this would clearly be inappropriate for non-resonant capture, as systematic effects related to the recoil cone angle, energy spread, and BGO efficiency dependence on the origin of the reaction vertex, would not be properly reproduced.

| (keV) | Cross Section (nb) | S-factor (keV.b) |
|---|---|---|
| 511(6.5) | ||
| 400(5.6) | ||
| 397(8.1) | ||
| 377(8.5) | ||
| 353(7.4) | ||
| 319(9.7) | ||
| 309(7.9) | ||
| 282(7.9) |
The resulting cross sections and astrophysical S-factors were calculated for each measured energy; these are plotted alongside literature data-sets in Figure 9. From our results we find an astrophysical S-factor consistent with the previously adopted value of . Unfortunately, our measurements do not extend down enough in energy to confirm the rise in the astrophysical S-factor seen by Ferraro et al., which the authors attribute to contributions from a broad sub-threshold resonance at keV, arising due to a state at keV.
V Thermonuclear Reaction Rate
In this work we report strength values for a total of seven resonances at center of mass energies of 149, 181, 248, 458, 610, 632 and 1222 keV. Since all of these are isolated narrow resonances, and there are no interference terms to consider, the total rate at a given temperature is calculated by summing the contribution of each resonance. The direct capture cross section was also measured, in the range of keV, from which we derive an astrophysical S-factor of 60 keV.b. The thermonuclear rate, given in table 4 of Appendix A, was calculating using the monte-carlo reaction rate calculator RatesMC. RatesMC computes the log-normal parameters describing the reaction rate at a given temperature. For a more detailed description of RatesMC the reader is referred to Ref Iliadis et al. 2015.
A comparison between the present rate and those put forward by the LUNA and TUNL groups is presented in figure 10, expressed as a ratio over the STARLIB-2013 rate. The present rate is a factor of 4 higher than the STARLIB-2013 rate, following closely with the latest results from the LUNA and TUNL groups. The upper limit of the LUNA rate is discrepant with the present rate, since we do not take into account possible contribution from a tentative resonance at 68 keV.
VI Astrophysical Impact
VI.1 Classical Novae
The impact of the present rate was assessed for a variety of classical nova models, including carbon-oxygen (CO) and oxygen-neon (ONe) novae, with a range of considered white dwarf masses. These were modelled using the one-dimensional, spherically symmetric, implicit hydro-dynamical code SHIVA José and Hernanz 1998; José 2016, which has been used extensively to model nucleosynthesis in classical novae.
Final abundances of nuclei in the Ne-Al region, calculated assuming the present 22NeNa rate and the previous STARLIB-2013 rate Sallaska et al. 2013a, are tabulated in Appendix B. These simulations show that the most wide-spread changes in the ejecta abundances occur for the CO nova model, which exhibits changes of more than for 20Ne, 21Ne, 22Ne, 22Na, 23Na, 25Mg, 26Mg, 26Al, and 27Al. The most significant abundance change of any single isotope was 23Na, with approximately a factor of 2 enhancement for both CO nova models. For the ONe nova models, the 22Ne content is reduced by almost a factor of 2 in both cases, while only modest changes are predicted for all other isotopes considered, with the exception of 24Mg which is enhanced by % in the 1.25 ONe nova model.
The magnesium isotopic ratios 25Mg/24Mg and 26Mg/25Mg warrant closer inspection. These ratios have been studied as a possible means of identifying pre-solar grains of putative classical nova origin, and to provide model constraints on important model parameters such as the peak temperature achieved during the outburst José et al. 2004. In the case of CO novae, synthesis of Mg is very sensitive to the peak temperature reached, and hence the underlying WD mass José et al. 2004. The sensitivity study performed by Iliadis et al. Iliadis et al. 2002 showed that the predicted final abundances of 24Mg and 25Mg for the 1.15 M⊙ CO nova model change by up to a factor of 5, as a result of varying the 22NeNa rate within its prior uncertainties. The newly determined rate drastically limits the reaction rate uncertainty in the relevant temperature range ( MK). Indeed, by varying the current rate within its respective low and high uncertainty limits, changes of less than 7% are observed for all the Mg isotope mass fractions.
Furthermore, the new rate seems to accentuate differences in the Mg isotope ratios between the 1.0 M⊙ and 1.15 M⊙ models. In comparison to the STARLIB-2013 rate, the calculations performed with the new 22NeNa rate result in a 24 increase and a 13 decrease in the 25Mg/24Mg and 26Mg/25Mg isotopic ratios, respectively, for the 1.15 M⊙ model. However, no significant change is seen for the Mg isotopes in the 1.0 M⊙ model. This result could be of potential interest for using Mg isotopic ratios in pre-solar grains as a thermometer for the peak temperatures reached during the outburst. Further work should be undertaken to reassess the sensitivity of magnesium isotopic ratios in CO novae to current nuclear reaction rate uncertainties in the Ne-Al region, incorporating the new 22NeNa rate and associated uncertainties.
Enhanced neon content in meteoritic samples has historically been proposed as a fingerprint for identifying pre-solar grains of classical nova origin, particularly in terms of excess 22Ne content associated with the decay of 22Na Clayton 1975. The 20Ne/22Ne isotopic ratio is also of interest for distinguishing between CO and ONe novae; the latter are expected to have very large ratios of 20Ne/22Ne , whereas CO novae models yield ratios of 20Ne/22Ne José et al. 2004. The present rate leads to more efficient destruction of 22Ne by approximately a factor of 2 over the previous rate, while leaving the mass fraction of 22Na released in the ejecta completely untouched. The previously assumed uncertainty in Neon abundances, due to the 22NeNa rate, is also drastically reduced from orders of magnitude to a few percent, marking a significant improvement in the nuclear physics input uncertainties related to key isotopic ratios predicted for classical nova nucleosynthesis.
VI.2 AGB Stars
The rate calculated through this work was implemented in a series of nucleosythesis network calculations performed using the NuGrid multi-zone post-processing code MPPNP Ritter et al. 2018. Three stellar models were considered for this work, each generated using the stellar evolution code MESA Paxton et al. 2010 and evolved up to the AGB phase. These models also include a recently developed treatment for convective boundary mixing occurring at the bottom of convective envelope during third dredge-up Battino et al. 2016.
The model was used to assess the impact of the present rate, in comparison to the STARLIB-2013 rate Sallaska et al. 2013a, for hot bottom burning in thermally pulsing AGB stars. In addition, simulations of low mass AGB stars were performed to assess the impact of the present rate on the formation of the so-called sodium pocketCristallo et al. 2009; Lucatello et al. 2011. In low mass AGB stars of solar metallicity, recent stellar models predict that the sodium pocket should be a major source of 23Na, with production of 23Na thought to be related to ingestion of the sodium pocket during third dredge-up Cristallo et al. 2009.

Despite a factor of 4 enhancement at MK over the previous thermonuclear rate, there appears to be very little impact on 23Na production during HBB in the TP-AGB star model, as demonstrated in Figure 11. This is in contrast with the significant enhancement (factor ) obtained from similar calculations using the LUNA rate, which was investigated by Slemer et al. Slemer et al. 2016. This is likely a consequence of two factors. The first factor arises due to the significant enhancement at 100 MK seen in the 22NeNa rate put forward by Cavanna et al. Cavanna et al. 2015, due largely to their treatment of tentative resonances at 68 and 100 keV. The second results from the models performed by Slemmer et al. Slemer et al. 2016 not taking into account neutron capture reactions. However, neglecting neutron capture reactions is potentially problematic, given the results of Cristallo et al. Cristallo et al. 2006, which show that in low-metalicity AGB stellar models neutron capture on 22Ne can contribute and of the total surface 23Na abundance from 13C and 22Ne burning respectively. The model calculations presented in this work include neutron capture reactions.

In the case of low mass AGB stars, formation of the sodium pocket in also appears to be negligibly affected by adopting the present 22NeNa rate. The resulting small effect on the surface [Na/Fe] ratio is shown by Figure 12. No discernible changes in the surface Na abundance could be seen for the lower metallicity (Z=0.001) model.
VII Conclusions
In summary, the 22NeNa reaction has, for the first time, been investigated directly in inverse kinematics. As such, the present work is subject to different experimental systematics than previous studies already found in the literature. A total of 7 resonances were measured, located at center of mass energies: 149, 181, 248, 458, 610, 632 and 1222 keV.
The important reference resonance at 458 keV was measured to have a strength value of eV. This is significantly lower than values published in two recent studies Kelly et al. 2015; Depalo et al. 2015. In the case of the three lowest energy resonances, which have the strongest influence on the reaction rate at stellar temperatures, we find close agreement with recent studies conducted at LUNA Cavanna et al. 2015; Cavanna et al. 2018b; Depalo et al. 2016; Ferraro et al. 2018 and TUNL Kelly et al. 2017.
The non-resonant contribution to the 22NeNa reaction rate was also measured, in the energy range of keV. The astrophysical s-factor associated with direct capture is found to be consistent with the previous work of Rolfs et al. Rolfs et al. 1975. Reported Erickson fluctuations in the direct capture cross section observed by Görres et al. Görres et al. 1983 were not found to persist in the energy range considered here. Unfortunately, the data points contributed by the present study do not extend low enough in energy to observe the influence of the keV sub-threshold state, which results in the upturn in the astrophysical s-factor observed in the most recent LUNA study Ferraro et al. 2018.
Our newly proposed rate follows closely with that put forward by the TUNL group. The key difference with respect to the rate published by the LUNA group is a consequence of their inclusion of upper limits from tentative resonances at 68 and 100 keV. The associated states, tentatively observed by Powers et al. Powers et al. 1971, have not been observed in a subsequent He, transfer study Hale et al. 2002, nor in the unselective reaction study by Moss et al. Moss 1976. These states have thus been neglected by the present work, as well as by Kelly et al. Kelly et al. 2017. Furthermore, preliminary analysis of a high resolution 23NaNa study conducted at the Munich Maier-Leibnitz Laboratory shows no signal above background in the relevant excitation region. Details of this study will be put forward in a forthcoming publication.
The impact of our newly proposed rate was assessed for both classical nova and AGB star nucleosynthesis. As a consequence of the present work, uncertainties in the predicted ejecta abundances in the Ne-Al region from CO and ONe novae have been drastically reduced. No significant enhancement in 23Na production is evident in the 2, 3, 5 AGB star models considered in this work. The 22Ne rate is now sufficiently well constrained in the major astrophysical environment thought to contribute to the Na-O anti-correlation.
VIII Acknowledgements
The authors thank the ISAC operations and technical staff at TRIUMF. TRIUMF’s core operations are supported via a contribution from the federal government through the National Research Council Canada, and the Government of British Columbia provides building capital funds. DRAGON is supported by funds from the National Sciences and Engineering Research Council of Canada. UK authors gratefully acknowledge support from the Science and Technology Facilities Council (STFC). J. José acknowledges support from the Spanish MINECO grant AYA2017-86274-P, the EU FEDER funds and the AGAUR/ Generalitat de Catalunya grant SGR-661/2017. Authors from the Colorado School of Mines acknowledge funding via the U.S. Department of Energy grant DE-FG02-93ER40789. U. Battino acknowledges support from the European Research Council (ERC-2015-STG Nr.677497). This article also benefited from discussions within the ‘ChETEC’ COST Action (CA16117). The authors also thank R. Longland for his support in calculating the thermonuclear reaction rate presented in this work.
References
- Krauss and Chaboyer (2003) L. M. Krauss and B. Chaboyer, Science 299, 65 (2003), http://science.sciencemag.org/content/299/5603/65.full.pdf .
- Gratton et al. (2004) R. Gratton, C. Sneden, and E. Carretta, Annu. Rev. Astron. Astrophys. 42, 385 (2004).
- Gratton et al. (2012) R. G. Gratton, E. Carretta, and A. Bragaglia, The Astronomy and Astrophysics Review 20, 50 (2012).
- Carretta et al. (2011) E. Carretta, S. Lucatello, R. Gratton, A. Bragaglia, and V. D’Orazi, Astronomy & Astrophysics 533, A69 (2011).
- Yong et al. (2003) D. Yong, F. Grundahl, D. L. Lambert, P. E. Nissen, and M. Shetrone, Astronomy & Astrophysics 402, 985 (2003).
- Prantzos, N. et al. (2007) Prantzos, N., Charbonnel, C., and Iliadis, C., A&A 470, 179 (2007).
- D’Antona F. (1983) C. A. D’Antona F., Gratton R., Mem. Soc. Astron. Italiana. 54, 173 (1983).
- Ventura, P. and D’Antona, F. (2008) Ventura, P. and D’Antona, F., A&A 479, 805 (2008).
- Decressin, T. et al. (2007) Decressin, T., Meynet, G., Charbonnel, C., Prantzos, N., and Ekström, S., A&A 464, 1029 (2007).
- de Mink, S. E. et al. (2009) de Mink, S. E., Pols, O. R., Langer, N., and Izzard, R. G., A&A 507, L1 (2009).
- Denissenkov and Hartwick (2014) P. A. Denissenkov and F. D. A. Hartwick, Monthly Notices of the Royal Astronomical Society: Letters 437, L21 (2014).
- Renzini (2008) A. Renzini, Monthly Notices of the Royal Astronomical Society 391, 354 (2008).
- Lee (2010) J.-W. Lee, Monthly Notices of the Royal Astronomical Society: Letters 405, L36 (2010).
- Buchmann and Barnes (2006) L. Buchmann and C. Barnes, Nuclear Physics A 777, 254 (2006), special Isseu on Nuclear Astrophysics.
- Ventura, P. and D’Antona, F. (2005) Ventura, P. and D’Antona, F., A&A 431, 279 (2005).
- Iliadis et al. (2002) C. Iliadis, A. Champagne, J. José, S. Starrfield, and P. Tupper, The Astrophysical Journal Supplement Series 142, 105 (2002).
- Angulo et al. (1999) C. Angulo, M. Arnould, M. Rayet, P. Descouvemont, D. Baye, C. Leclercq-Willain, A. Coc, S. Barhoumi, P. Aguer, C. Rolfs, R. Kunz, J. Hammer, A. Mayer, T. Paradellis, S. Kossionides, C. Chronidou, K. Spyrou, S. Degl’Innocenti, G. Fiorentini, B. Ricci, S. Zavatarelli, C. Providencia, H. Wolters, J. Soares, C. Grama, J. Rahighi, A. Shotter, and M. L. Rachti, Nuclear Physics A 656, 3 (1999).
- Sallaska et al. (2013a) A. L. Sallaska, C. Iliadis, A. Champange, S. Goriely, S. Starrfield, and F. Timmes, The Astrophysical Journal Supplement Series 207, 18 (2013a).
- Broggini et al. (2010) C. Broggini, D. Bemmerer, A. Guglielmetti, and R. Menegazzo, Annual Review of Nuclear and Particle Science 60, 53 (2010), https://doi.org/10.1146/annurev.nucl.012809.104526 .
- Cavanna et al. (2015) F. Cavanna, R. Depalo, M. Aliotta, M. Anders, D. Bemmerer, et al., Phys. Rev. Lett. 115, 252501 (2015).
- Kelly et al. (2017) K. J. Kelly, A. E. Champagne, L. N. Downen, J. R. Dermigny, S. Hunt, C. Iliadis, and A. L. Cooper, Phys. Rev. C 95, 015806 (2017).
- Cesaratto et al. (2010) J. Cesaratto, A. Champagne, T. Clegg, M. Buckner, R. Runkle, and A. Stefan, Nuclear Instruments and Methods in Physics Research Section A: Accelerators, Spectrometers, Detectors and Associated Equipment 623, 888 (2010).
- Longland et al. (2006) R. Longland, C. Iliadis, A. Champagne, C. Fox, and J. Newton, Nuclear Instruments and Methods in Physics Research Section A: Accelerators, Spectrometers, Detectors and Associated Equipment 566, 452 (2006).
- Kelly et al. (2015) K. J. Kelly, A. E. Champagne, R. Longland, and M. Q. Buckner, Phys. Rev. C 92, 035805 (2015).
- Powers et al. (1971) J. R. Powers, H. T. Fortune, R. Middleton, and O. Hansen, Phys. Rev. C 4, 2030 (1971).
- Hale et al. (2002) S. Hale, A. Champagne, C. Iliadis, V. Hansper, D. Powell, and J. Blackmon, Physical Review C - Nuclear Physics 65, 158011 (2002).
- Moss (1976) C. Moss, Nuclear Physics A 269, 429 (1976).
- Jenkins et al. (2013) D. G. Jenkins, M. Bouhelal, S. Courtin, M. Freer, et al., Phys. Rev. C 87, 064301 (2013).
- Ferraro et al. (2018) F. Ferraro, M. P. Takács, D. Piatti, F. Cavanna, R. Depalo, M. Aliotta, D. Bemmerer, A. Best, A. Boeltzig, C. Broggini, C. G. Bruno, A. Caciolli, T. Chillery, G. F. Ciani, P. Corvisiero, T. Davinson, G. D’Erasmo, A. Di Leva, Z. Elekes, E. M. Fiore, A. Formicola, Z. Fülöp, G. Gervino, A. Guglielmetti, C. Gustavino, G. Gyürky, G. Imbriani, M. Junker, A. Karakas, I. Kochanek, M. Lugaro, P. Marigo, R. Menegazzo, V. Mossa, F. R. Pantaleo, V. Paticchio, R. Perrino, P. Prati, L. Schiavulli, K. Stöckel, O. Straniero, T. Szücs, D. Trezzi, and S. Zavatarelli (LUNA Collaboration), Phys. Rev. Lett. 121, 172701 (2018).
- Hutcheon et al. (2003) D. Hutcheon, S. Bishop, L. Buchmann, M. Chatterjee, A. Chen, et al., Nucl. Instr. and Methods in Phys. Res. Sec. A 498, 190 (2003).
- Laxdal (2003) R. Laxdal, Nuclear Instruments and Methods in Physics Research Section B: Beam Interactions with Materials and Atoms 204, 400 (2003), 14th International Conference on Electromagnetic Isotope Separators and Techniques Related to their Applications.
- Jayamanna et al. (2010) K. Jayamanna, G. Wight, D. Gallop, R. Dube, V. Jovicic, C. Laforge, M. Marchetto, M. Leross, D. Louie, R. Laplante, R. Laxdal, M. McDonald, G. J. Wiebe, V. Wang, and F. Yan, Review of Scientific Instruments 81, 02A331 (2010).
- Tengblad et al. (2004) O. Tengblad, U. Bergmann, L. Fraile, H. Fynbo, and S. Walsh, Nuclear Instruments and Methods in Physics Research Section A: Accelerators, Spectrometers, Detectors and Associated Equipment 525, 458 (2004).
- Christian et al. (2014) G. Christian, C. Akers, D. Connolly, J. Fallis, D. Hutcheon, K. Olchanski, and C. Ruiz, Eur. Phys. J. A 50, 75 (2014).
- Hutcheon et al. (2012) D. A. Hutcheon, C. Ruiz, J. Fallis, et al., Nucl. Instr. Meth. in Phys. Res. A 689, 70 (2012).
- Ziegler et al. (2010) J. F. Ziegler, M. Ziegler, and J. Biersack, Nuclear Instruments and Methods in Physics Research Section B: Beam Interactions with Materials and Atoms 268, 1818 (2010), 19th International Conference on Ion Beam Analysis.
- Liu et al. (2003) W. Liu, G. Imbriani, L. Buchmann, A. Chen, J. D’Auria, A. D’Onofrio, S. Engel, L. Gialanella, U. Greife, D. Hunter, A. Hussein, D. Hutcheon, A. Olin, D. Ottewell, D. Rogalla, J. Rogers, M. Romano, G. Roy, and F. Terrasi, Nuclear Instruments and Methods in Physics Research Section A: Accelerators, Spectrometers, Detectors and Associated Equipment 496, 198 (2003).
- Keinonen et al. (1977) J. Keinonen, M. Riihonen, and A. Anttila, Phys. Rev. C 15, 579 (1977).
- Depalo et al. (2015) R. Depalo, F. Cavanna, F. Ferraro, et al., Phys. Rev. C 92, 045807 (2015).
- Wrede et al. (2003) C. Wrede, A. Hussein, J. G. Rogers, and J. D’Auria, Nucl. Instrum. Meth. B 204, 619 (2003).
- (41) N. N. D. Center, Brookhaven National Laboratory .
- Meyer and Smit (1973) M. A. Meyer and J. J. A. Smit, Nucl. Phys. A 205, 177 (1973).
- Longland et al. (2010) R. Longland, C. Iiadis, J. M. Cesaratto, et al., Phys. Rev. C 81, 055804 (2010).
- Giesen et al. (1993) U. Giesen, C. P. Browne, J. Görres, S. Graff, C. Iliadis, et al., Nucl. Phys. A 561, 95 (1993).
- Iliadis et al. (2010) C. Iliadis, Longland, C. R., A. E., and A. Coc, Nucl. Phys. A 841, 251 (2010).
- Depalo et al. (2016) R. Depalo, F. Cavanna, M. Aliotta, M. Anders, et al., Phys. Rev. C 94, 055804 (2016).
- Cavanna et al. (2018a) F. Cavanna, R. Depalo, M. Aliotta, M. Anders, D. Bemmerer, A. Best, A. Boeltzig, C. Broggini, C. G. Bruno, A. Caciolli, P. Corvisiero, T. Davinson, A. di Leva, Z. Elekes, F. Ferraro, A. Formicola, Z. Fülöp, G. Gervino, A. Guglielmetti, C. Gustavino, G. Gyürky, G. Imbriani, M. Junker, R. Menegazzo, V. Mossa, F. R. Pantaleo, P. Prati, D. A. Scott, E. Somorjai, O. Straniero, F. Strieder, T. Szücs, M. P. Takács, and D. Trezzi (The LUNA Collaboration), Phys. Rev. Lett. 120, 239901 (2018a).
- Harissopulos et al. (2000) S. Harissopulos, C. Chronidou, K. Spyrou, et al., Eur. Phys. J. A. 9, 479 (2000).
- Powell et al. (1998) D. C. Powell, C. Iliadis, A. E. Champagne, et al., Nucl. Phys. A 644, 263 (1998).
- Görres et al. (1982) J. Görres, C. Rolfs, P. Schmalbrock, H. Trautvetter, and J. Keinonen, Nuclear Physics A 385, 57 (1982).
- Rolke and López (2001) W. A. Rolke and A. M. López, Nuclear Instruments and Methods in Physics Research Section A: Accelerators, Spectrometers, Detectors and Associated Equipment 458, 745 (2001).
- Rolfs et al. (1975) C. Rolfs, W. Rodne, M. Shapiro, and H. Winkler, Nuclear Physics A 241, 460 (1975).
- Görres et al. (1983) J. Görres, H. Becker, L. Buchmann, C. Rolfs, P. Schmalbrock, H. Trautvetter, A. Vlieks, J. Hammer, and T. Donoghue, Nuclear Physics A 408, 372 (1983).
- Rolfs (1973) C. Rolfs, Nuclear Physics A 217, 29 (1973).
- Iliadis et al. (2015) C. Iliadis, R. Longland, A. Coc, F. X. Timmes, and A. E. Champagne, Journal of Physics G: Nuclear and Particle Physics 42, 034007 (2015).
- Sallaska et al. (2013b) A. L. Sallaska, C. Iliadis, A. E. Champange, S. Goriely, S. Starrfield, and F. X. Timmes, The Astrophysical Journal Supplement Series 207 (2013b).
- José and Hernanz (1998) J. José and M. Hernanz, The Astrophysical Journal 494, 680 (1998).
- José (2016) J. José, Stellar explosions: hydrodynamics and nucleosynthesis (CRC Press, 2016).
- José et al. (2004) J. José, M. Hernanz, S. Amari, K. Lodders, and E. Zinner, The Astrophysical Journal 612, 414 (2004).
- Clayton (1975) D. D. Clayton, Nature 257, 36 (1975).
- Ritter et al. (2018) C. Ritter, F. Herwig, S. Jones, M. Pignatari, C. Fryer, and R. Hirschi, Monthly Notices of the Royal Astronomical Society 480, 538 (2018).
- Paxton et al. (2010) B. Paxton, L. Bildsten, A. Dotter, F. Herwig, P. Lesaffre, and F. Timmes, The Astrophysical Journal Supplement Series 192, 3 (2010).
- Battino et al. (2016) U. Battino, M. Pignatari, C. Ritter, F. Herwig, P. Denisenkov, J. Den Hartogh, R. Trappitsch, R. Hirschi, B. Freytag, F. Thielemann, et al., The Astrophysical Journal 827, 30 (2016).
- Cristallo et al. (2009) S. Cristallo, O. Straniero, R. Gallino, et al., The Astrophys. J. 696, 797 (2009).
- Lucatello et al. (2011) S. Lucatello, T. Masseron, J. A. Johnson, et al., Astrophys. J 729:40, 13pp (2011).
- Slemer et al. (2016) A. Slemer, P. Marigo, D. Piatti, M. Aliotta, D. Bemmerer, A. Best, A. Boeltzig, A. Bressan, C. Broggini, C. Bruno, et al., Monthly Notices of the Royal Astronomical Society 465, 4817 (2016).
- Cristallo et al. (2006) S. Cristallo, R. Gallino, O. Straniero, L. Piersanti, and I. Dominguez, arXiv preprint astro-ph/0606374 (2006).
- Cavanna et al. (2018b) F. Cavanna, R. Depalo, M. Aliotta, M. Anders, D. Bemmerer, et al., Phys. Rev. Lett. 120, 239901(E) (2018b).
Appendix A Thermonuclear Reaction Rate
This appendix contains the total thermonuclear reaction rate adopted following this work. The thermonuclear rate was computed using the RatesMC code, which calculates the log-normal parameters and describing the reaction rate at a given temperature. The column labelled ‘A-D statistic’ refers to the Anderson-Darling statistic, indicating how well a log-normal distribution describes the rate at a given temperature. An A-D statistic of less than indicates that the rate is well described by a log-normal distribution. However, it has been shown that the assumption of a log-normal distributed reaction rate holds for A-D statistics in the range Iliadis et al. 2010.
| T [GK] | Low rate | Medium rate | High rate | Log-normal | Log-normal | A-D statistic |
|---|---|---|---|---|---|---|
| 0.010 | 4.2110-25 | 6.7510-25 | 1.0810-24 | -5.56610+01 | 4.8310-01 | 7.8810-01 |
| 0.011 | 1.5810-23 | 2.4410-23 | 3.7810-23 | -5.20710+01 | 4.3910-01 | 5.2610-01 |
| 0.012 | 3.2110-22 | 4.8110-22 | 7.2110-22 | -4.90910+01 | 4.0910-01 | 2.7510-01 |
| 0.013 | 4.0310-21 | 5.9310-21 | 8.7110-21 | -4.65710+01 | 3.8910-01 | 2.0410-01 |
| 0.014 | 3.4910-20 | 5.0810-20 | 7.3710-20 | -4.44310+01 | 3.7810-01 | 1.5010-01 |
| 0.015 | 2.2310-19 | 3.2410-19 | 4.6810-19 | -4.25710+01 | 3.7210-01 | 1.6110-01 |
| 0.016 | 1.1310-18 | 1.6210-18 | 2.3510-18 | -4.09610+01 | 3.7010-01 | 1.2210-01 |
| 0.018 | 1.6310-17 | 2.3610-17 | 3.4410-17 | -3.82810+01 | 3.7410-01 | 1.2610-01 |
| 0.020 | 1.3510-16 | 1.9810-16 | 2.9010-16 | -3.61610+01 | 3.8310-01 | 3.0910-01 |
| 0.025 | 5.6910-15 | 8.6410-15 | 1.3010-14 | -3.23810+01 | 4.1210-01 | 6.7710-01 |
| 0.030 | 6.5510-14 | 1.0210-13 | 1.5710-13 | -2.99210+01 | 4.3910-01 | 7.3210-01 |
| 0.040 | 1.2510-12 | 2.0510-12 | 3.2510-12 | -2.69210+01 | 4.7810-01 | 8.1010-01 |
| 0.050 | 7.0010-12 | 1.1610-11 | 1.8910-11 | -2.51910+01 | 4.9910-01 | 6.6410-01 |
| 0.060 | 2.3610-11 | 3.8110-11 | 6.1310-11 | -2.39910+01 | 4.7910-01 | 6.5810-01 |
| 0.070 | 1.0010-10 | 1.3410-10 | 1.8710-10 | -2.27110+01 | 3.1710-01 | 2.7310+01 |
| 0.080 | 8.2510-10 | 9.2210-10 | 1.0510-09 | -2.08010+01 | 1.2610-01 | 2.9010+01 |
| 0.090 | 6.5710-09 | 7.1010-09 | 7.7110-09 | -1.87610+01 | 8.1210-02 | 1.2310+00 |
| 0.100 | 3.9010-08 | 4.1810-08 | 4.4910-08 | -1.69910+01 | 7.1010-02 | 3.0410-01 |
| 0.110 | 1.7410-07 | 1.8610-07 | 1.9810-07 | -1.55010+01 | 6.3810-02 | 1.9710-01 |
| 0.120 | 6.2010-07 | 6.5610-07 | 6.9510-07 | -1.42410+01 | 5.8110-02 | 1.5610-01 |
| 0.130 | 1.8310-06 | 1.9310-06 | 2.0310-06 | -1.31610+01 | 5.3710-02 | 3.0410-01 |
| 0.140 | 4.6510-06 | 4.8810-06 | 5.1410-06 | -1.22310+01 | 5.0410-02 | 5.6610-01 |
| 0.150 | 1.0510-05 | 1.1010-05 | 1.1510-05 | -1.14210+01 | 4.7810-02 | 6.9810-01 |
| 0.160 | 2.1410-05 | 2.2410-05 | 2.3510-05 | -1.07110+01 | 4.5810-02 | 7.1210-01 |
| 0.180 | 7.1410-05 | 7.4410-05 | 7.7710-05 | -9.50510+00 | 4.2410-02 | 6.5110-01 |
| 0.200 | 1.9310-04 | 2.0110-04 | 2.0910-04 | -8.51410+00 | 3.8910-02 | 4.8610-01 |
| 0.250 | 1.8310-03 | 1.8810-03 | 1.9410-03 | -6.27610+00 | 2.8510-02 | 2.5110-01 |
| 0.300 | 2.0010-02 | 2.0710-02 | 2.1510-02 | -3.87610+00 | 3.5610-02 | 5.1310-01 |
| 0.350 | 1.5810-01 | 1.6410-01 | 1.7010-01 | -1.80710+00 | 3.8010-02 | 3.9510-01 |
| 0.400 | 7.9810-01 | 8.2810-01 | 8.5910-01 | -1.88410-01 | 3.7310-02 | 3.8710-01 |
| 0.450 | 2.8610+00 | 2.9610+00 | 3.0710+00 | 1.08610+00 | 3.6010-02 | 4.5910-01 |
| 0.500 | 7.9810+00 | 8.2610+00 | 8.5510+00 | 2.11210+00 | 3.4510-02 | 5.0810-01 |
| 0.600 | 3.7910+01 | 3.9210+01 | 4.0410+01 | 3.66810+00 | 3.1910-02 | 5.8510-01 |
| 0.700 | 1.1810+02 | 1.2210+02 | 1.2610+02 | 4.80310+00 | 3.0810-02 | 8.3010-01 |
| 0.800 | 2.8310+02 | 2.9210+02 | 3.0210+02 | 5.67810+00 | 3.2810-02 | 2.7310+00 |
| 0.900 | 5.6810+02 | 5.8910+02 | 6.1210+02 | 6.38010+00 | 3.8210-02 | 9.7710+00 |
| 1.000 | 1.0110+03 | 1.0510+03 | 1.1010+03 | 6.95910+00 | 4.5910-02 | 1.8810+01 |
| 1.250 | 2.9410+03 | 3.1210+03 | 3.3410+03 | 8.05110+00 | 6.6310-02 | 2.7410+01 |
| 1.500 | 6.2510+03 | 6.7210+03 | 7.3210+03 | 8.82010+00 | 8.1610-02 | 2.5310+01 |
| 1.750 | 1.0910+04 | 1.1910+04 | 1.3010+04 | 9.38810+00 | 9.0910-02 | 2.2510+01 |
| 2.000 | 1.6810+04 | 1.8310+04 | 2.0210+04 | 9.82210+00 | 9.5810-02 | 2.0410+01 |
| 2.500 | 3.1010+04 | 3.3910+04 | 3.7510+04 | 1.04410+01 | 9.7810-02 | 1.8210+01 |
| 3.000 | 4.6610+04 | 5.1010+04 | 5.6310+04 | 1.08510+01 | 9.5110-02 | 1.7510+01 |
| 3.500 | 6.2210+04 | 6.7710+04 | 7.4510+04 | 1.11310+01 | 9.1110-02 | 1.7110+01 |
| 4.000 | 7.6410+04 | 8.2910+04 | 9.0810+04 | 1.13310+01 | 8.7010-02 | 1.6810+01 |
| 5.000 | 9.9510+04 | 1.0710+05 | 1.1710+05 | 1.15910+01 | 8.0010-02 | 1.5910+01 |
| 6.000 | 1.1510+05 | 1.2310+05 | 1.3310+05 | 1.17310+01 | 7.4810-02 | 1.4610+01 |
| 7.000 | 1.2410+05 | 1.3310+05 | 1.4310+05 | 1.18010+01 | 7.1110-02 | 1.3310+01 |
| 8.000 | 1.2910+05 | 1.3810+05 | 1.4810+05 | 1.18410+01 | 6.8310-02 | 1.2110+01 |
| 9.000 | 1.3110+05 | 1.3910+05 | 1.4910+05 | 1.18410+01 | 6.6210-02 | 1.1010+01 |
| 10.000 | 1.3010+05 | 1.3810+05 | 1.4810+05 | 1.18410+01 | 6.4610-02 | 1.0010+01 |
Appendix B Classical Novae Model Calculations
This appendix contains tables of isotope mass fractions in the Ne-Al mass range ejected assuming a variety of classical novae models. Two carbon-oxygen and two oxygen-neon novae models were considered, see text in section VI.1 for a summary of key findings. The models were generated using the one dimensional spherically symmetric hydrodynamic code SHIVA José and Hernanz 1998; José 2016.
| Nuclide | STARLIB-2013 | Low Rate | Medium Rate | High Rate |
|---|---|---|---|---|
| 20Ne | ||||
| 21Ne | ||||
| 22Ne | ||||
| 22Na | ||||
| 23Na | ||||
| 24Mg | ||||
| 25Mg | ||||
| 26Mg | ||||
| 26Al | ||||
| 27Al |
| Nuclide | STARLIB-2013 | Low Rate | Medium Rate | High Rate |
|---|---|---|---|---|
| 20Ne | ||||
| 21Ne | ||||
| 22Ne | ||||
| 22Na | ||||
| 23Na | ||||
| 24Mg | ||||
| 25Mg | ||||
| 26Mg | ||||
| 26Al | ||||
| 27Al |
| Nuclide | STARLIB-2013 | Low Rate | Medium Rate | High Rate |
|---|---|---|---|---|
| 20Ne | ||||
| 21Ne | ||||
| 22Ne | ||||
| 22Na | ||||
| 23Na | ||||
| 24Mg | ||||
| 25Mg | ||||
| 26Mg | ||||
| 26Al | ||||
| 27Al |
| Nuclide | STARLIB-2013 | Low Rate | Medium Rate | High Rate |
|---|---|---|---|---|
| 20Ne | ||||
| 21Ne | ||||
| 22Ne | ||||
| 22Na | ||||
| 23Na | ||||
| 24Mg | ||||
| 25Mg | ||||
| 26Mg | ||||
| 26Al | ||||
| 27Al |