SMA Observations of Haro 2: Molecular Gas around a Hot Superbubble Facilities: SMACASA, AIPS, ds9
Abstract
Haro 2 , a nearby dwarf starburst dwarf galaxy with strong Ly emission, hosts a starburst that has created outflows and filaments. The clear evidence for galactic outflow makes it an ideal candidate for studying the role of molecular gas in feedback processes in a dwarf galaxy. We observed CO(2-1) in Haro 2 at the Submillimeter Array in the compact and extended configurations, and have mapped the molecular emission with velocity resolution 4.1 km s-1 and spatial resolution ″ . With this significant increase of resolution over previous measurements we see that the molecular gas comprises two components: bright clumps associated with the embedded star clusters of the starburst, and fainter extended emission east of the starburst region. The extended emission coincides with an X-ray bubble and has the kinematic signatures of an outflowing cone or of an expanding shell or bubble; the velocity range is km s-1 . We suggest that the starburst winds that created the X-Ray bubble have entrained molecular gas, and that the apparent velocity gradient at an angle to the photometric axis is an artifact caused by the outflow. The molecular and X-ray activity is on the east of the galaxy and the ionized outflow and optical filaments are west; their relationship is not clear.
Keywords:
galaxies:individual (Haro2), galaxies: kinematics and dynamics, galaxies: starburstAugust 11, 2026
I Introduction
Blue compact dwarf (BCD) galaxies form stars in environments quite different from gas-rich spirals or luminous infrared galaxies. BCDs are often rich in atomic gas but it is difficult to study their molecular components; the CO emission is usually weak and BCDs are often of low metallicity which complicates the interpretation of the emission. The origin of the molecular gas from which the stars are forming is thus unclear. Perhaps star-forming molecular clouds form from their reservoirs of atomic gas; alternatively, molecular gas could be acquired from other galaxies via accretion or merger. Another urgent question is how starburst feedback operates on molecular gas. The gravitational wells of dwarf galaxies are not as deep as spirals’ and it is easier for them to lose gas to winds. However, molecular gas has greater cooling capacity than atomic, which can cause galactic winds to fail and inhibit gas dispersal. This can have ramifications for the escape of ionizing radiation from the starburst.
Haro 2 (Mrk 33, Arp 233, UGC 5720) is one of the best local targets in which to study the processes of star formation fueling and feedback in a dwarf galaxy. One of the most luminous BCDs, Haro 2 has a very blue nucleus (Haro 1956) is of moderate metallicity (), with strong ultraviolet and optical emission lines and WR features (Kunth & Joubert 1985; Loose & Thuan 1986; Kinney et al. 1993), and bright radio continuum emission (Beck et al. 2000; Aversa et al. 2011), indicating very recent ( Myr) star formation. Haro 2 is one of the closest Lyman emitting galaxies; Its strong, blue-shifted Ly line is probably due to a outflow of ionized gas at km s-1 with respect to the galaxy (Lequeux et al. 1995; Meier et al. 2001). The ionized outflow is presumably driven by the massive stars in the starburst. Summers et al. 2001 observed the soft X–ray emission of Haro 2 with HRI on ROSAT with 1.5″ pixels and saw “an extended, complex shell-like morphology”; they found hard emission concentrated in three point sources as well as the widely distributed soft emission. CO(1–0),CO(2–1), and CO(3–2) lines have been detected with single dishes (Arnault et al. 1988; Sage et al. 1992; Barone et al 2000; Meier et al. 2001; Mao et al. 2010; Israel et al. 1995). Haro 2 is comparatively weak in low J lines of CO relative to the brightness of the starburst, which is common for BCDs.
With sensitive array observations, CO can be mapped at the scales of individual giant molecular clouds (GMCs) in nearby galaxies, allowing the star formation process to be studied at the cluster scale. The first interferometric maps of CO and HI in Haro 2 were by Bravo-Alfaro et al. 2004; their map of CO(1–0) revealed unusual halo-like emission around the galaxy. They found the molecular gas to have a velocity gradient almost due north-south, at an angle to the photometric major axis of the galaxy, and suggested that the photometric and kinematic axes are misaligned.
This motivated us to observe Haro 2 in a higher transition; CO lines from high J are often stronger than CO(1-0) in BCDs, especially in regions of star formation (Israel et al. 1995; Meier et al. 2001). We accordingly observed Haro 2 in the CO(2-1) line with the Submillimeter Array (SMA) on Mauna Kea in both the extended and compact configurations, giving spatial resolution better than 2″ and velocity resolution of km s-1 over the star forming region (observational parameters are in Table 1). We combine this data cube with archival radio continuum and optical images for a full picture of molecular gas kinematics in the center of Haro 2 which is very different from the earlier results.
II Observations
We observed the CO(2-1) line in both the extended and compact configurations of the Submillimeter Array (SMA). The compact configuration, which has a maximum baseline of 70 m, was used on 13/6/2015 and the extended configuration with maximum baseline 220 m on 19/4/2016. Callisto was the absolute flux calibrator. Full parameters of the observations and the range of spatial resolutions achieved are in Table 1. The data was calibrated in MIRIAD and imaged with AIPS and CASA 4.7.0. Combining the extended and the compact configuration data created a data cube with spatial beam of ″ , almost as high as the extended configuration, but as sensitive as the compact configuration to large-scale structures; the largest structure that can be mapped is ″, corresponding to 22 kpc at the galaxy’s distance of 21 Mpc. Final noise levels in the individual combined channel maps are 17 . The integrated intensity (moment 0) image was constructed from all channels stronger than . The intensity weighted mean velocity and dispersion maps (first and second moments) were constructed from emission . Barone et al 2000 obtained a peak km s-1 for Haro 2 at the IRAM 30-m telescope, which gives a total flux density of -125 Jy km s-1 , depending on the true source size. The SMA observations find a total flux of 110 Jy km s-1 , consistent with the single-dish measurements as far as can be determined.
III SMA Observations of CO(2–1): Distribution of Emission within Haro 2

III.1 Basic Structure: Starburst Clumps and an Extended Northeast Wing
The CO(2-1) total integrated intensity map of Haro 2 is displayed in Figure 1, as contours on an 814nm HST image. The total extent of the CO emission is about 1.5–2 kpc, about the size of the optical image. The brightest CO coincides with the brightest starburst region and there is extended CO emission east and north of the starburst. The edges of the extended CO lie near weak dust lanes, indicating that the extended CO is on the near side of the galaxy. These features are also seen in the CO(1-0) images of Bravo-Alfaro et al. 2004. We do not see CO(2-1) west of the starburst nucleus where Méndez & Esteban 2000 found filaments.
The CO(2-1) flux, , is distributed with Jy km s-1 in the central starburst region and 50-60 Jy km s-1 in the extended north-east emission. Bravo-Alfaro et al. 2004 find a CO(1-0) flux, , of Jy km s-1 in the central region and 6-7 Jy km s-1 in the extended. The ratio of 2.9 in the central region is typical of compact galaxies (Israel, 2005) and thermally excited gas at . The flux ratio of the extended blue emission is 7-9, but this ratio simply reflects the fact that the CO(1-0) emission falls below the intensity cut of the CO(1-0) map at 100 mJy/bm km s-1 . This corresponds, for a typical ratio of 3, to an rms almost 5 times higher than the mJy/bm km s-1 of our more sensitive maps. We do not expect to see the extended blue emission detected by the SMA in the Bravo-Alfaro et al. 2004 maps.
We can estimate the total mass in the extended emission from the observed 50-60 Jy km s-1 by assuming and , the conversion factor giving from CO flux. For Bravo-Alfaro et al. 2004’s value of , there is in the extended emission region, and for .


Figure 3 compares the CO(1-0) and CO(2-1) maps and shows the CO(2-1) extending north and east of the CO(1-0) emission. This will be discussed further in relation to the X-ray emission below.
Bravo-Alfaro et al. 2004 report ‘possible’ CO(1-0) concentrations south and northwest of the main emission region in a map made with a ″ beam . These features are very weak at the full spatial resolution; tapering the beam to ″ shows emission at the per beam level northwest and south east of the main galaxy. These possible features appear in the moment maps of Figure 5. We believe them to be real, especially the extended northwest feature which covers several beams, but the signal-to-noise at this time is too low for meaningful study and they will not be discussed further here.
The starburst in Haro 2 has been mapped in the radio continuum by Beck et al. 2000 and Aversa et al. 2011 with beams of 2″ and 1″ respectively; at this resolution the emission appears as two bright regions. An archival VLA image from the AY35 program, shown in Figure 2, has resolution ″ and shows that each of the bright regions breaks up into a few clumps. Figure 2 shows the CO(2-1) moment 0 overlaid with the high resolution radio map and demonstrates that the strongest CO emission mostly coincides with the two bright starburst clumps. In the right panel of Figure 2 we display the radio continuum and the 1.6 m continuum mapped by NICMOS 11 1 As astrometry from the NICMOS headers is known to be imprecise at the 1-2″ level (Oti-Floranes et al. 2012), we shifted the NICMOS image ″north-east to bring the strong southern infrared source into coincidence with the bright radio clump.
IV SMA Observations: the Kinematics of the Molecular Gas
The kinematics of gas in Haro 2 are of particular interest because it is one of the closest Lyman emitting galaxies. Since Haro 2 does not have a particularly low metallicity, it has been suggested (Lequeux et al. 1995) that the escape of Lyman continuum photons is due to gas kinematics, and indeed there is a suggestion of outflow in the ionized gas (Legrand et al. 1997). How this might compare to the kinematics of the molecular gas is an important question. Furthermore, previous observations have found signs of unusual and non-rotational kinematics in Haro 2 . Bravo-Alfaro et al. 2004 and Bravo-Alfaro et al. 2006 report that in both HI and CO the photometric and kinematic axes appear to be misaligned, with little velocity gradient along the major axis and a strong gradient at an angle of to it; similar results are reported for H by Petrosian et al. 2002. These results have been taken as signs of a past accretion or merger event (Bravo-Alfaro et al. 2004 and Bravo-Alfaro et al. 2006) However, the CO data cube on which these arguments were based only covered velocities of 1378 to 1503 km s-1 and had beam size ″. The SMA data with its better spatial resolution and more complete velocity coverage presents a somewhat different picture, which we now discuss.
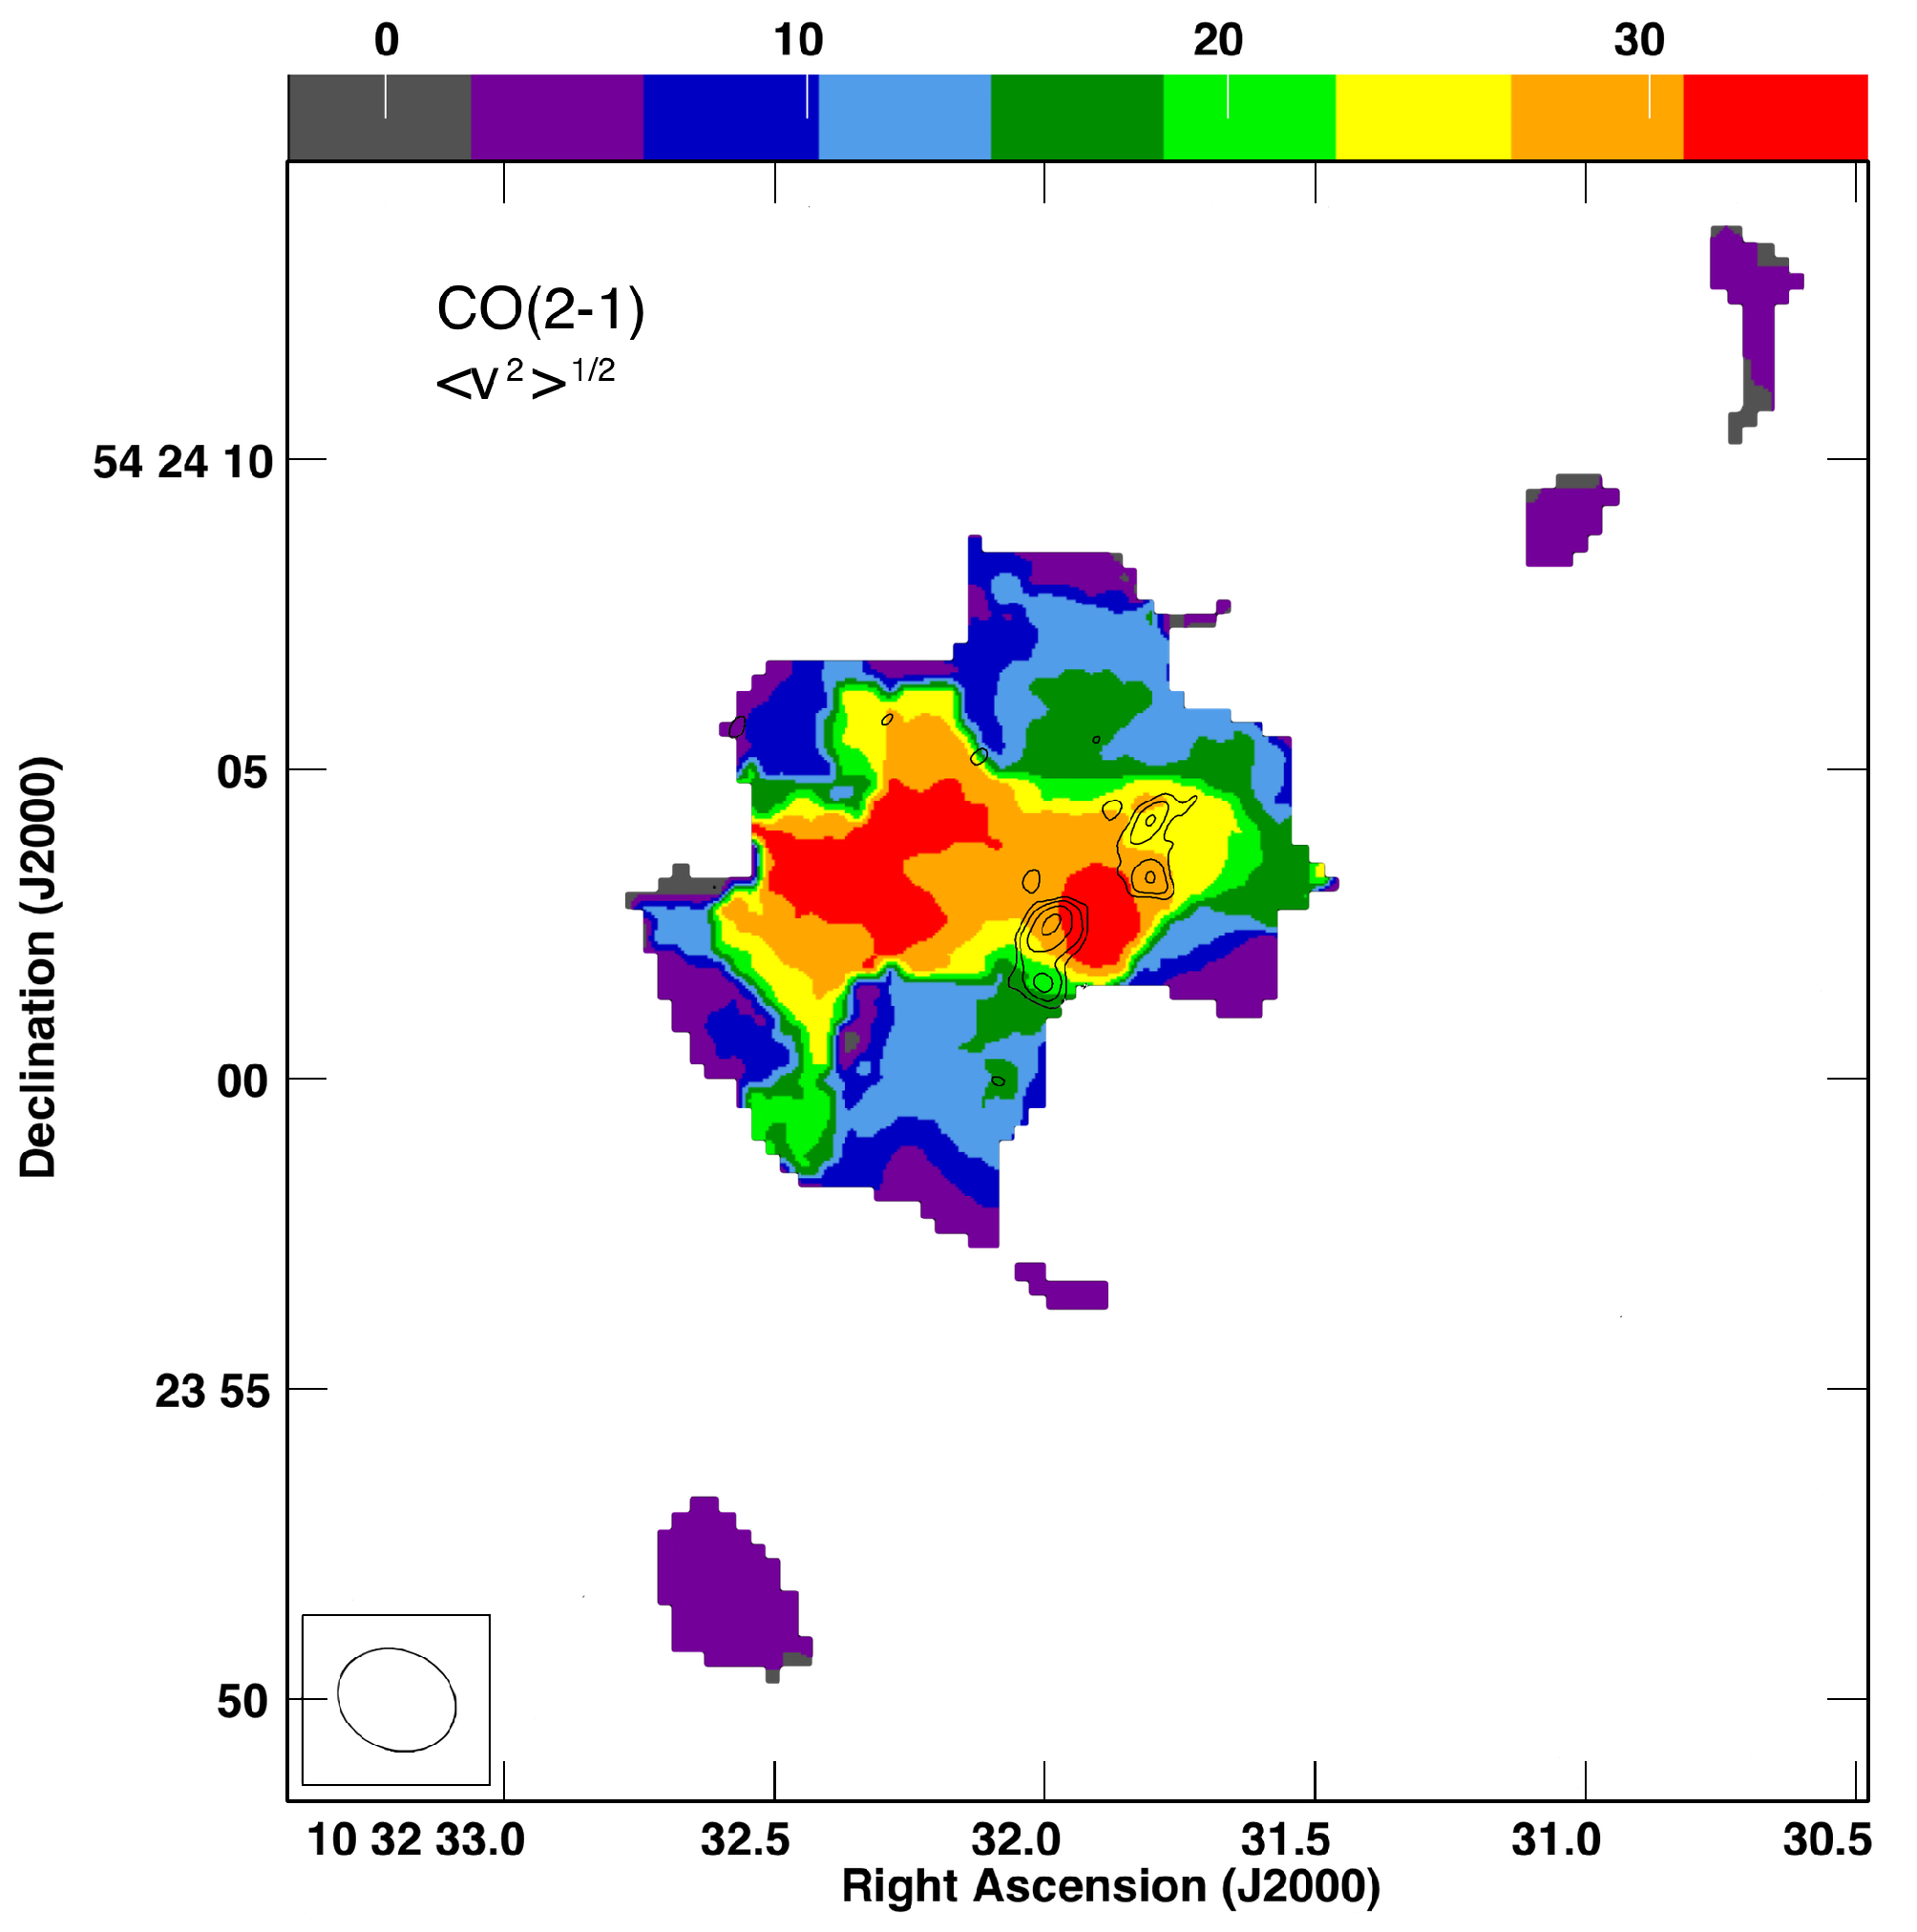
Figure 4 displays samples of channel maps of CO(2–1) emission (a complete set of channel maps is in the Appendix). The CO(2-1) emission in Haro 2 spans a total velocity range of km s-1 FWZI, from about 1380 to 1580 km s-1, with a centroid of 1470 km s-1 ( Bravo-Alfaro et al. 2004 found 1440 km s-1 as the center of the HI line). Figure 5 displays the first moment (intensity-weighted peak velocity) and second moment (dispersion) of the CO(2-1) line, with the radio continuum contours superimposed to show the location of the young star clusters and the photometric axis of the galaxy. These displays of the kinematics show:
- •
Along the axis defined by the positions of the young star clusters there is a smooth velocity gradient from km s-1 on the north to km s-1 on the south.
- •
The extended emission north and east of the starburst is blue-shifted relative to the starburst and has velocities between km s-1 and km s-1 .
- •
The velocity field of the extended blue emission is complex.
- •
Over most of the region of extended blue emission the dispersion is high.
We conclude that the galaxy holds two distinct kinematic regions: the starburst lying along the photometric axis, and the blue emission north-east of the main body of the galaxy. We now discuss each component.
IV.1 Molecular Gas Kinematics in the Starburst
The channel maps of Figure 3 clearly show two velocity components associated with the starburst: one at km s-1 on the southeast star-forming clump and another component at km s-1 on the north clump, giving a centroid of 1490 km s-1. How do these velocities compare to those seen at optical wavelengths? The spectra of Méndez & Esteban 2000 found velocities of , and on their knots 1,2,3 respectively. They do not give absolute coordinates for their positions, but from their offsets and by comparing the H image to the near-infared, we conclude that their knots 1 and 2 are north of the radio emission region and not associated with the star forming clumps. Their knot 3 corresponds to the the northern radio source and agrees with it in velocity. That the southern radio source has no associated is a sign of high local extinction, which plays an important role in the appearance of this galaxy’s core.
The central panel of Figure 6 shows the velocity as a function of position (Position-Velocity Diagram of PVD) along the main body of the galaxy as defined by the radio clumps. The velocity shift between the two sources is consistent with the gradient set by the clumps, further north along the same axis. The patch of high dispersion with 35 km s-1 that appears in Figure 5 between the two radio concentrations shows where emission of both groups of sources enter the beam.


IV.2 Molecular Gas North East of the Starburst: A CO Outflow or Expanding Bubble
The emission north-east of the starburst extends over 1.5-2 kpc and 1400-1500 km s-1 in velocity. The first and second moment maps of Figure 5 and the channel maps in Figure 4 and the Appendix show that the extended eastern emission is entirely blue of the main starburst; the blue velocities of the extended eastern emission have no counterpart in the optical spectra. The eastern emission is concentrated at two velocities km s-1 apart; these appear in the channel maps of Figure 4 as two ‘horns’ extending east from the starburst region. These features appear clearly in Position-Velocity Diagrams (PVDs) in Figure 6. In short, the channel maps, PVD and line profiles of the molecular gas east of the starburst all demonstrate the kinematic signatures of a body of gas flowing away from the galaxy with velocity km s-1.
Two types of motions that could produce this kinematic signatures are 1) an expanding shell or bubble, 2) outflow cones based in the starburst. In a true bubble expanding from a central point, the highest velocities and the greatest velocity dispersion will be seen in the center. In the Haro 2 extended emission region the most extreme gas velocities and the region of highest velocity dispersion, shown as a thin black contour on the channel maps, are not in the center of the emission but closer to the starburst. This may argue that the blue velocities show outflows from the clusters. However, the gas spatial distribution is patchy and if there is a shell it is very incomplete and difficult to see. It may not be possible with the current data to distinguish clearly between expansion of a partial shell and an set of outflows. We refer below to this component of molecular gas as a ’bubble’ because it coincides with a well-known X-ray bubble, with the caveat that the molecular gas may not have identical morphology.
IV.2.1 The Molecular Outflow and the X-Ray Emission
The large-scale activity reflected in the molecular outflow appears as well in the high energy regime. Summers et al. 2001 observed Haro 2 with HRI on ROSAT with a ″ beam and 1.5″ pixels and saw ”an extended, complex shell-like morphology” . Oti-Floranes et al. 2012 observed with CHANDRA over a wider energy range and with 0.49″ pixels. Their image of the soft (0.2-1.5 KeV) emission is very similar to the ROSAT result; they find in addition 3 point-like sources of hard (2.5-8.0 KeV) X-rays. How does the structure correspond to the molecular gas? In Figure 8 we overlay the CO(2-1) map on the full resolution ROSAT X-ray image. The CO(2-1) line agrees well with the soft X-ray distribution: the X-ray shell coincides with the blue CO emission and the base of the shell with the starburst clusters.
Oti-Floranes et al. 2012’s dominant hard x-ray source, X1, agrees with the brightest near-infrared clump in NICMOS images. We identify the near-infrared peak with the brighter (northern) sub-clump in the southern starburst region of Figure 2, although the formal coordinates disagree by about 1″ ; Oti-Floranes et al. 2012 also note this inconsistency in the coordinates. With this alignment, the secondary hard X-ray source X2 agrees with the weaker southern sub-clump. We do not have a candidate for the X3 source that Oti-Floranes et al. 2012 suggest may not belong to the galaxy.

The CO(2-1) agrees spatially with the X-ray better than does the CO(1-0); Bravo-Alfaro et al. 2004 show in their Figure 8 that the X-ray extends further to the east than does the CO(1-0) emission. That the CO(2-1) is a better match than the (1-0) with the X-ray may be partly due to the improved sensitivity of the CO(2-1) but also because the gas is warm or hot: a jiggle-mode maps of CO(3-2) with 14.5″ resolution in the JCMT Nearby Galaxies Legacy Survey (Wilson et al. 2012) shows (their figure C26) the CO(3-2) emission clearly extended north and east of the optical nucleus, consistent with the CO(2-1) appearance. That the higher CO transitions are consistently stronger than the (1-0) east of the galaxy implies that the eastern gas is warm and the upper levels populated, as is seen near other strong starbursts (Consiglio et al 2016). We conclude that the extended blue molecular gas, be it bubble or outflow, is associated with the hot X-ray emitting gas. The double velocity peaks of the CO line here resembles that on an X-ray source in He 2-10, (Beck et al. 2018) and CO lines are seen emitted from the edges of other bubbles and superbubbles (e.g. Matsushita et al 2005, Sano et al 2017, Tsai et al 2009). The molecular gas is probably concentrated in the thin, dense shell created in the ’snowplow’ stage (Summers et al. 2001). We estimate the total energy in the outflowing molecular gas from its mass of (derived with ) and a typical 35 km s-1 velocity to be , again similar to He 2-10.
IV.2.2 Kinematics of the X-Ray Bubble, Molecular Gas and
Summers et al. 2001 model their X-ray bubble as resulting from the stellar winds of the nuclear starburst under the assumption that it is the same process as the ionized outflow observed in . They accordingly use the size and expansion velocity Legrand et al. 1997 found for the system to determine parameters of the the X-ray bubble. But the current data show clearly that the X-ray and molecular bubble is east of the nucleus. Although the spectra of Legrand et al. 1997 cannot be registered spatially because of the very poor seeing, it is reasonable to associate the ionized outflow they observe in with the filaments seen in the deep images of Méndez & Esteban 2000 west of the nucleus. The velocities are another discrepancy between the ionized and molecular kinematics: the ionized outflow has expansion velocity km s-1 , significantly higher than the km s-1 of the molecular velocities.
We conclude that the nuclear region of Haro 2 drives two outflows: to the west, a fast ionized outflow which has created filaments, and to the east a bubble of hot, X-ray emitting gas which has entrained warm molecular gas.
How will the results calculated by Summers et al. 2001 change in this model? The important difference is that the expansion velocity may have been overestimated. If the observed molecular velocities of km s-1 are used, instead of the 200 km s-1 found from the results, for in their Equation 8, the age estimate is yr, instead of yr. The longer time is more consistent than the short with other estimates of the age of the relatively mature starburst of Haro 2 . The longer lifetime in turn reduces the mechanical injection power derived; Summers et al. 2001’s Equation 1 gives instead of . Such energy can be readily supplied by the stellar population of any one of the nuclear clumps. The most likely driver is in the northern source, as its velocity overlaps with velocities in the CO bubble.
IV.2.3 Re-evaluating the Global Kinematics of Haro 2
Identifying the blue-shifted molecular gas NE of the galaxy as an outflow means that we must re-appraise the overall CO and HI kinematics described by Bravo-Alfaro et al. 2004. While the blue-shifted holds only of the total gas mass, it is so spatially distinct that it appears clearly in first moment maps and create an apparent velocity gradient NE to SW, at an angle to the optical major axis. We believe this is what Bravo-Alfaro et al. 2004 see in their HI data as well. Now that we treat the blue CO emission as a separate feature, a bubble driven by the northern star clusters, the only velocity gradient is along the photometric major axis.
Is the CO and X-ray bubble the base of a true galactic wind; in other words, will the matter in the bubble escape from the galaxy? We do not have a model for the mass distribution of Haro 2 but can make a first estimate by treating it as an dE type; escape velocity from a dE galaxy of Haro 2 ’s luminosity is expected to be km s-1( Merritt et al. 2004, Figure 2). If this approximation is valid to within a factor of 2, it would indicate that only the very fastest gas may escape from the galaxy, while the bulk of the molecular gas will enter new orbits or fall back onto the galaxy core.
V Summary and Discussion
We report observations of CO (2-1) in Haro 2 which combine the SMA in extended and compact arrays to give beam sizes ″ . The major findings are:
- •
Approximately the molecular gas is in two clumps, kinematically and spatially distinct and coincident with the bright radio sources which are identified as obscured starburst clumps.
- •
Approximately of the molecular gas is in a blue-shifted outflow or bubble north-east of the galactic nucleus, with expansion velocity km s-1 .
- •
The blue CO outflow coincides with an X-ray superbubble which is believed to have been created by stellar winds in the starburst, and with no other known sources. The molecular gas has probably been entrained by the hot gas in the outflows.
- •
The reported misalignment of the optical and kinetic axis in Haro 2 now appears to be an artifact caused by low spatial resolution of earlier observations.
It is not clear how the stellar activity that created the molecular bubble is related to the ionized outflow and filaments seen west of the galaxy by Méndez & Esteban 2000 . Is one starburst clump driving two outflows of different types in different directions? Are the ionized and molecular outflows driven by two different sources? Is there an ionized outflow connected to the molecules and X-rays that has not yet been detected? It would be very useful to observe Haro 2 further in optical emission lines to determine the full extent of its outflow activity, and in higher transitions of CO to determine conditions in the molecular clouds associated with the X-ray superbubble.
References
- Arnault et al. (1988) Arnault, P., Casoli, F., Combes, F., et al. 1988, A&A, 205, 41
- Aversa et al. (2011) Aversa, A. G., Johnson, K. E., Brogan, C. L., Goss, W. M., & Pisano, D. J. 2011, AJ, 11996ApJ…460..271K41, 125
- Barone et al (2000) Barone, L. T.; Heithausen, A.; Huttemeister, S.; Fritz, T.; & Klein, U., MNRAS, 317, 649
- Beck et al. (2000) Beck, S. C., Turner, J. L., & Kovo, O. 2000, AJ, 120, 244
- Beck et al. (2018) Beck, S.C., Turner, Jean L. & Consiglio, S.Michelle 2018, ApJ, 867, 165
- Bravo-Alfaro et al. (2004) Bravo-Alfaro, H., Brinks, E., Baker, A. J., Walter, F., & Kunth, D. 2004, AJ, 127, 264
- Bravo-Alfaro et al. (2006) Bravo-Alfaro, H., Coziol, R., & Brinks, E. 2006, Rev. Mexicana Astron. Astrofis., 42, 261
- Consiglio et al (2016) Consiglio, S. Michelle; Turner, Jean L.; Beck, Sara; & Meier, David S., 2016, ApJ, 833, L6
- Haro (1956) Haro, G. 1956, Boletin de los Observatorios Tonantzintla y Tacubaya, 2, 8
- Israel et al. (1995) Israel, F. P., Tacconi, L. J., & Baas, F. 1995, A&A, 295, 599
- Israel, (2005) Israel, F.P., 2005, A&A438, 8551
- Kinney et al. (1993) Kinney, A. L., Bohlin, R. C., Calzetti, D., Panagia, N., & Wyse, R. F. G. 1993, ApJS, 86, 5
- Knapp&Rupen (1996) Knapp, G. & Rupen, M. , 1996,1988ApJ…333..821M ApJ460, 271
- Kobulnicky & Genhardt (2000) Kobulnicky, Henry A., & Gebhardt, Karl 2000, AJ, 119,
- Kunth & Joubert (1985) Kunth, D., & Joubert, M. 1985, A&A, 142, 411
- Legrand et al. (1997) Legrand, F., Kunth, D., Mas-Hesse, J. M., & Lequeux, J. 1997, A&A, 326, 929
- Lequeux et al. (1995) Lequeux, J., Kunth, D., Mas-Hesse, J. M., & Sargent, W. L. W. 1995, A&A, 301, 18
- Loose & Thuan (1986) Loose, H.-H., & Thuan, T. X. 1986, ApJ, 309, 59
- MacLaren, Richardson & Wolfendale (1988) MacLaren, I., Richardson, K., & Wolfendale, A. ApJ, 333, 821 (1988)
- Mas-Hesse, & Kunth (1999) Mas-Hesse, J. M., & Kunth, D. 1999, A&A, 349, 765
- Mas-Hesse et al. (2003) Mas-Hesse, J. M., Kunth, D., Tenorio-Tagle, G., et al. 2003, ApJ, 598, 858
- Mao et al. (2010) Mao, R.-Q., Schulz, A., Henkel, C., et al. 2010, ApJ, 724, 1336
- Matsushita et al (2005) Matsushita, Satoki; Kawabe, Ryohei; Kohno, Kotaro; Matsumoto, Hironori; Tsuru, Takeshi G.; & Vila-Vilaro, Baltasar, 2005, ApJ618, 761
- Meier et al. (2001) Meier, D. S., Turner, J. L., Crosthwaite, L. P., & Beck, S. C. 2001, AJ, 121, 740
- Méndez & Esteban (2000) Méndez, D. I., & Esteban, C. 2000, A&A, 359, 493
- Merritt et al. (2004) Merritt, D., Milosavljevi?, M., Favata, M., Hughes, S., Holz, D. E. 2004, ApJ607, 9
- Murphy et al. (2012) Murphy, E. J., Bremseth, J., Mason, B. S., et al. 2012, ApJ, 761, 97
- Oti-Floranes et al. (2012) Oti-Floranes, H.; Mas-Hesse, J. M.; Jimenez-Bailon, E.; Schaerer, D.; Hayes, M.; Ostlin, G.; Atek, H.; Kunth, D.
- Petrosian et al. (2002) Petrosian, A. R., Movsessian, T., Comte, G., Kunth, D., & Dodonov, S. 2002, A&A, 391, 487
- Sage et al. (1992) Sage, L. J., Salzer, J. J., Loose, H.-H., et al. 1992, A&A, 265, 19
- Sano et al (2017) Sano, H.; Yamane, Y.; Voisin, F.; Fujii, K.; Yoshiike, S.; Inaba, T.; Tsuge, K.; and 11 coauthors, 2017, ApJ843, S61
- Summers et al. (2001) Summers, L. K., Stevens, I. R., & Strickland, D. K. 2001, MNRAS, 327, 385
- Thuan, Hibbard & Levrier (2004) Thuan, T., Hubbard, J., & Levrier, F. AJ, 128, 617 (2004)
- Tsai et al (2009) Tsai, An-Li, Matsushita, Satoki; Nakanishi, Kouichiro; Kohno, Kotaro; Kawabe, Ryohei; Inui, Tatsuya; Matsumoto, Hironori; Tsuru, Takeshi G.; Peck, Alison B.; & Tarchi, Andrea, 2009, PASJ61, 237
- Turner & Ho (1994) Turner, J. L., & Ho, P. T. P. 1994, ApJ, 421, 122
- Wilson et al. (2012) Wilson, C.D. and numerous co-authors 2012, MNRAS, 424, 3050
| Date | Telescope | Wavelength | Beam Size | Spectral Channels | noise |
|---|---|---|---|---|---|
| 18/4/16 | SMA-Extended | 230 Ghz | ″ | km s-1 | |
| 04/01/16 | SMA-Compact | ” | ″ | ” | |
| n.a. | SMA-Combined | ” | ″ | ” | |
| 02/11/90 | VLA-C array | 4.86 Ghz | ″ | n.a. |
VI APPENDIX
Kinematic Channel Maps
