Uncertain Natural Language Inference
Abstract
We introduce Uncertain Natural Language Inference (UNLI), a refinement of Natural Language Inference (NLI) that shifts away from categorical labels, targeting instead the direct prediction of subjective probability assessments. We demonstrate the feasibility of collecting annotations for UNLI by relabeling a portion of the SNLI dataset under a probabilistic scale, where items even with the same categorical label differ in how likely people judge them to be true given a premise. We describe a direct scalar regression modeling approach, and find that existing categorically labeled NLI data can be used in pre-training. Our best models approach human performance, demonstrating models may be capable of more subtle inferences than the categorical bin assignment employed in current NLI tasks.
1 Introduction
Variants of entailment tasks have been used for decades in benchmarking systems for natural language understanding. Recognizing Textual Entailment (RTE) or Natural Language Inference (NLI) is traditionally a categorical classification problem: predict which of a set of discrete labels apply to an inference pair, consisting of a premise () and hypothesis (). The FraCaS consortium offered the task as an evaluation mechanism, along with a small challenge set Cooper et al. 1996, which was followed by the RTE challenges Dagan et al. 2005. Despite differences between these and recent NLI datasets (Marelli et al. 2014; Lai et al. 2017; Williams et al. 2018; Khot et al. 2018, i.a.), NLI hsa remained a categorical prediction problem.
However, entailment inference is uncertain and has a probabilistic nature Glickman et al. 2005. Maintaining NLI as a categorical classification problem is not ideal since coarse categorical labels mask the uncertain and probabilistic nature of entailment inference. NLI pairs may share a coarse label, but the probabilities that the hypotheses are entailed by their corresponding premises may vary greatly (see Table 1). Hence, not all contradictions are equally contradictory and not all entailments are equally entailed.
Premise Hypothesis NLI UNLI A man in a white shirt taking a picture A man takes a picture ent 100% A boy hits a ball, with a bat The kid is playing in a baseball game ent 78% A wrestler in red cries, one in blue celebrates The wrestler in blue is undefeated con 50% Man laying on a platform outside on rocks Man takes a nap on his couch con 0%
We propose Uncertain Natural Language Inference (UNLI), a refinement of NLI that captures more subtle distinctions in meaning by shifting away from categorical labels to the direct prediction of human subjective probability assessments. We illustrate that human-elicited probability assessments contain subtle distinctions on the likelihood of a hypothesis conditioned on a premise, and UNLI captures these distinctions far beyond categorical labels in popular NLI datasets.
We demonstrate how to elicit UNLI annotations. Using recent large-scale language model pre-training, we provide experimental results illustrating that systems can often predict UNLI judgments, but with clear gaps in understanding. We conclude that scalar annotation protocols should be adopted in future NLI-style dataset creation, which should enable new work in modeling a richer space of interesting inferences.
Premise Hypothesis SNLI u-SNLI A man is singing into a microphone. A man performs a song. neu 95% A man is performing on stage. neu 84% A male performer is singing a special and meaningful song. neu 15% A man performing in a bar. neu 14% A man is singing the national anthem at a crowded stadium. neu 0.6%
2 Eliciting UNLI annotations
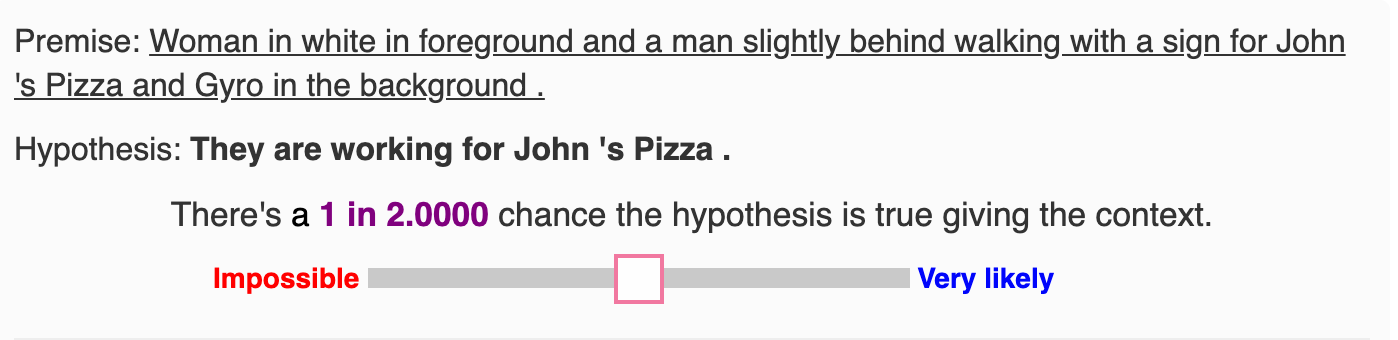
We elicit subjective probabilities from crowdsource workers (MTurk) for premise-hypothesis pairs from existing NLI data. Annotators are asked to estimate how likely the situation described in the hypothesis sentence would be true given the premise. Following the Efficient Annotation of Scalar Labels framework (Sakaguchi and Durme 2018, EASL;), we present annotators sentence-pairs, each with a slider bar enabling direct assessment for each pair and ask annotators to calibrate their score for a sentence-pair based on the scores they provided to the other four pairs.11 1 Example pairs were provided in the instructions along with suggested probability values. See Appendix A for details of the annotation interface and qualifications.
In contrast to the uniform scale employed in the original EASL protocol, we modify the interface to allow finer-grained values near 0.0 and 1.0, following psychological findings that humans are especially sensitive to values near the ends of the probability spectrum Tversky and Kahneman 1981.22 2 This is called the certainty effect: more sensitivity to the difference between, e.g., 0% and 1% than 50% and 51%. This interface decision is a key distinction of this work contrasting prior efforts that averaged Likert-scale (ordinal) annotations. This allows us to capture the difference between NLI pairs that are both appropriately contradicted or entailed under NLI, but that have a perceived difference of less than 1% probability.
In order to capture the sensitivity near these ends, we adopt a more fine-grained slider bar with 10,000 steps with a logistic transformation. Specifically, for raw score , we apply a scaled logistic function to re-scale the final result range to . We ran pilots to tune , and determine that people tend to choose much lower probability for some events even though they are just slightly less likely (e.g., just below 50%).33 3 This phenomenon accords with the weighting function in Prospect Theory Kahneman and Tversky 1979; Tversky and Kahneman 1992, where people tend to downweight probabilities with around 0.4 or above. Therefore, we use different ’s depending on the range of or . Each sentence pair is annotated with 2- or 3-way redundancy. The individual responses are averaged to create a gold standard label for a premise-hypothesis pair.
Data
We annotate, i.e. elicit a probability , for a subset of SNLI Bowman et al. 2015 examples and refer to this data as u-SNLI.44 4 We use SNLI due to its popularity and its feature that each premise is paired with multiple hypotheses. SNLI’s training set contains 7,931 distinct premises paired with at least 5 distinct neutral (neu) hypotheses. For each premise, we sample 5 neutral hypotheses, resulting in 39,655 of these neu pairs annotated. An additional 15,862 contradicted (con) and entailed (ent) pairs are annotated for our training set, resulting in 55,517 training examples. For our dev and test sets, we respectively annotated 3,040 examples sampled from SNLI’s dev and test splits. In total, we annotated 61,597 examples, about 12% of all examples in SNLI. Figure 1 plots the resultant median and quartile for each categorical SNLI label in the u-SNLI dev set, showing the wide range of probability judgments elicited for each label (see Table 2 for examples).55 5 Data is available at http://nlp.jhu.edu/unli.
Premise Hypothesis SNLI u-SNLI Predicted A man perched on a row of aquariums is using a net to scoop a fish from another aquarium. A man is standing by the aquariums. ent 1.0 0.119 A man and woman are drinking at a bar. A couple is out on a date. neu 0.755 0.377 Couple walking on the beach. The couple are holding hands. neu 0.808 0.308 An elderly woman crafts a design on a loom. The woman is a seamstress. neu 0.923 0.197 Two girls riding an amusement park ride. The two girls are screaming. neu 0.909 0.075 A man and woman sit at a cluttered table. The table is neat and clean. con 4.91 0.262 A race car sits in the pits. The car is going fast. con 2.88 0.724 A guy is standing in front of a toilet with a coffee cup in one hand and a toilet brush in the other. A man is attempting to brew coffee. con 8.32 0.504
3 Prediction
Formally, given a premise and a hypothesis , a UNLI model should output an uncertainty score of the premise-hypothesis pair that correlates well with a human-provided subjective probability assessment. We train a regression UNLI model to predict the probability that a premise entails a hypothesis. We modify the sentence pair classifier66 6 The neural architecture for MultiNLI Williams et al. 2018 in Devlin et al. 2019. in BERT to exploit recent advancements in large-scale language model pre-training. Following Devlin et al. 2019, we concatenate the premise and the hypothesis, with a special sentinel token (cls) inserted at the beginning and a separator (sep) inserted after each sentence, tokenized using WordPiece. After encoding the concatenated token sequence with BERT, we take the encoding of the first sentinel token.
We pass the resulting feature vector through a sigmoid-activated linear layer to obtain a probability, instead of a softmax used in categorical NLI. We directly model UNLI as a regression problem, trained using a binary cross-entropy loss77 7 No significant difference is observed with an loss. between the human annotation and the model output . Owing to the concerns raised with annotation artifacts in SNLI Gururangan et al. 2018; Tsuchiya 2018; Poliak et al. 2018, we include a hypothesis-only baseline.88 8 See Appendix D for additional training details.
Metrics
We compute Pearson correlation (), the Spearman rank correlation (), and the mean square error (MSE) between y and as the metrics to measure the to performance of UNLI models. Pearson measures the linear correlation between the gold probability assessments and model’s output; Spearman measures the ability of the model ranking the premise-hypothesis pairs with respect to their subjective probability; MSE measures whether the model can recover the subjective probability value from premise-hypothesis pairs. A high and , but a low MSE is desired.
4 Results & Analysis
Table 4reports results on u-SNLI dev and test sets. Just training on u-SNLI examples yields a 62.71% Pearson on test. The hypothesis-only baseline achieved a correlation around 40%. This result corroborates the findings that a hidden bias exists in the SNLI dataset’s hypotheses, and shows this bias may also exist in u-SNLI.99 9 This is unsurprising because u-SNLI examples are sampled from SNLI.
Hyp-only Full-model Dev Test Dev Test 0.3759 0.4120 0.6383 0.6271 0.3853 0.4165 0.6408 0.6346 MSE 0.1086 0.1055 0.0751 0.0777
Human Performance
We elicit additional annotations on u-SNLI dev set to establish a randomly sampled human performance. We use the same annotators as before but ensure each annotator has not previously seen the pair they are annotating. We average the scores from three-way redundant elicitation,1010 10 This setting approximates the performance of a randomly sampled human on u-SNLI, and is therefore a reasonable lower bound on the performance one could achieve with a dedicated, trained single human annotator. yielding , , and : our regression model trained on u-SNLI is therefore approaching human performance. While encouraging, the model fails drastically for some examples.
Qualitative Error Analysis
Table 3 illustrates examples with large gaps between the gold probability assessment and the BERT-based model output. The model seems to have learned lexicon-level inference (e.g., race cars going fast, but ignored crucial information (sits in the pits), and fails to learn certain commonsense patterns (e.g. riding amusement park ride screaming; man and woman drinking at a bar on a date). These examples illustrate the model’s insufficient commonsense reasoning and plausibility estimation.
Pre-training with SNLI
Can we leverage the remaining roughly 500,000 SNLI training pairs that only have categorical labels? One method would be to train a categorical NLI model on SNLI and when fine-tuning on u-SNLI, replace the last layer of the network from a categorical prediction with a sigmoid function.1111 11 This is similar to how Pavlick and Callison-Burch 2016 pre-train on SNLI, then fine-tune the model using their Add-One pairs. However, a typical categorical loss function would not take into account the ordering between the different categorical labels.1212 12 That the score of ent score of neu score of con. Instead, we derive a surrogate function that maps SNLI categorical labels to the average score of all u-SNLI training annotations labeled with in SNLI.1313 13 .
SNLI SNLI + u-SNLI Dev Test Dev Test 0.5198 0.4958 0.6762 0.6589 0.5238 0.5231 0.6806 0.6708 MSE 0.1086 0.0928 0.0694 0.0733
We use this mapping to pre-train a regression model on the SNLI training examples not included in u-SNLI. We also fine-tune the model on u-SNLI’s training set. Table 5 reports the results evaluated on u-SNLI’s dev and test sets. The model trained on the roughly mapped SNLI examples, performs much worse than when trained on just about u-SNLI examples. When we pre-train the model on the mapped SNLI and fine-tune on u-SNLI, results noticeably improve. This improvement is akin to the Phang et al. 2018’s finding that many NLI datasets cover informative signal for different tasks, explaining why pre-training on NLI can be advantageous. Here, an impoverished version of UNLI is helpful.
Model behavior
Figure 2 depicts the model behavior when training just on SNLI or fine-tuning with u-SNLI. When using the original SNLI data, under the surrogate regression setting, the model’s prediction concentrates on the 3 surrogate scalar values of the 3 SNLI classes. After fine-tuning on u-SNLI, the model learns smoother predictions for premise-hypothesis pairs, supported by the superior Pearson correlation score. The darker boxes in bottom-right corner of the heatmaps (Figure 2) indicate high accuracy on samples with gold u-SNLI labels and model predictions, signifying that our UNLI models are very good at recognizing entailments.

5 Related Work
The probabilistic nature and the uncertainty of NLI has been considered from a variety of perspectives. Glickman et al. 2005 modified the task to explicitly include the probabilistic aspect of NLI, stating that “ probabilistically entails … if increases the likelihood of being true,” while Lai and Hockenmaier 2017 noted how predicting the conditional probability of one phrase given another would be helpful in predicting textual entailment. Other prior work has elicited ordinal annotations (e.g. Likert scale) reflecting likelihood judgments Pavlick and Callison-Burch 2016; Zhang et al. 2017, but then collapsed the annotations into coarse categorical labels for modeling. Vulić et al. 2017 proposed graded lexical entailment, which is similar to our idea but applied to lexical-level inference, asking “to what degree is a type of .” Additionally, Lalor et al. 2016; Lalor et al. 2018 tried capturing the uncertainty of each inference pair by item response theory (IRT), showing fine-grained differences in discriminative power in each label.
Pavlick and Kwiatkowski 2019 recently argued that models should “explicitly capture the full distribution of plausible human judgments” as plausible human judgments cause inherent disagreements. Our concern is different as we are interested in the uncertain and probabilistic nature of NLI. We are the first to propose a method for direct elicitation of subjective probability judgments on NLI pairs and direct prediction of these scalars, as opposed to reducing to categorical classification.
Recent work have also modeled the uncertainty of other semantic phenomena as direct scalar regression (and collected scalar versions of data for them) instead of categorical classification, e.g. factuality Lee et al. 2015; Stanovsky et al. 2017; Rudinger et al. 2018, and semantic proto-roles Teichert et al. 2017.
Plausiblity tasks such as COPA Roemmele et al. 2011 and ROCStories Mostafazadeh et al. 2016 ask models to choose the most probable examples given a context, capturing relative uncertainty between examples, but do not force a model to predict the probability of given . Li et al. 2019 viewed the plausibility task of COPA as a learning to rank problem, where the model is trained to assign the highest scalar score to the most plausible alternative given context. Our work can be viewed as a variant to this, with the score being an explicit human probability judgment instead.
Linguists such as van Eijck and Lappin 2014, Goodman and Lassiter 2015, Cooper et al. 2015 and Bernardy et al. 2018 have described models for natural language semantics that introduce probabilities into the compositional, model-theoretic tradition begun by those such as Davidson 1967 and Montague 1973. Where they propose probabilistic models for interpreting language, we are concerned with illustrating the feasibility of eliciting probabilistic judgments on examples through crowdsourcing, and contrasting with prior efforts restricted to limited categorical label sets.
6 Conclusion
We proposed Uncertain Natural Language Inference (UNLI), a new task of directly predicting human likelihood judgments on NLI premise-hypothesis pairs. In short, we have shown that not all NLI contradictions are created equal, nor neutrals, nor entailments. We demonstrated that (1) eliciting supporting data is feasible, and (2) annotations in the data can be used for improving a scalar regression model beyond the information contained in existing categorical labels, using recent contextualized word embeddings, e.g. BERT.
Humans are able to make finer distinctions between meanings than is being captured by current annotation approaches; we advocate the community strives for systems that can do the same, and therefore shift away from categorical NLI labels and move to something more fine-grained such as our UNLI protocol.
Acknowledgments
We thank anonymous reviewers from current and past versions of the article for their insightful comments and suggestions. This research benefited from support by DARPA AIDA and DARPA LORELEI. The U.S. Government is authorized to reproduce and distribute reprints for Governmental purposes. The views and conclusions contained in this publication are those of the authors and should not be interpreted as representing official policies or endorsements of DARPA or the U.S. Government.
References
- Bernardy et al. (2018) Jean-Philippe Bernardy, Rasmus Blanck, Stergios Chatzikyriakidis, and Shalom Lappin. 2018. A compositional Bayesian semantics for natural language. In Proceedings of the First International Workshop on Language Cognition and Computational Models, pages 1–10. Association for Computational Linguistics.
- Bowman et al. (2015) Samuel R. Bowman, Gabor Angeli, Christopher Potts, and Christopher D. Manning. 2015. A large annotated corpus for learning natural language inference. In Proceedings of the 2015 Conference on Empirical Methods in Natural Language Processing, pages 632–642.
- Cooper et al. (1996) Robin Cooper, Dick Crouch, Jan Van Eijck, Chris Fox, Johan Van Genabith, Jan Jaspars, Hans Kamp, David Milward, Manfred Pinkal, Massimo Poesio, et al. 1996. Using the framework. Technical report, The FraCaS Consortium.
- Cooper et al. (2015) Robin Cooper, Simon Dobnik, Shalom Lappin, and Stefan Larsson. 2015. Probabilistic type theory and natural language semantics. Linguistic Issues in Language Technology, 10(1):1–43.
- Dagan et al. (2005) Ido Dagan, Oren Glickman, and Bernardo Magnini. 2005. The PASCAL recognising textual entailment challenge. In Machine Learning Challenges, Evaluating Predictive Uncertainty, Visual Object Classification and Recognizing Textual Entailment, First PASCAL Machine Learning Challenges Workshop, pages 177–190.
- Davidson (1967) Donald Davidson. 1967. Truth and meaning. Synthese, 17(1):304–323.
- Devlin et al. (2019) Jacob Devlin, Ming-Wei Chang, Kenton Lee, and Kristina Toutanova. 2019. BERT: pre-training of deep bidirectional transformers for language understanding. In Proceedings of the 2019 Conference of the North American Chapter of the Association for Computational Linguistics: Human Language Technologies, Volume 1, pages 4171–4186.
- van Eijck and Lappin (2014) Jan van Eijck and Shalom Lappin. 2014. Probabilistic semantics for natural language. In Zoe Christoff, Paulo Galeazzi, Nina Gierasimczuk, Alexandru Marcoci, and Sonja Smets, editors, The Logic and Interactive Rationality Yearbook 2012, volume II.
- Glickman et al. (2005) Oren Glickman, Ido Dagan, and Moshe Koppel. 2005. A probabilistic classification approach for lexical textual entailment. In Proc. AAAI, AAAI’05, pages 1050–1055. AAAI Press.
- Goodman and Lassiter (2015) Noah D. Goodman and Daniel Lassiter. 2015. Probabilistic semantics and pragmatics: Uncertainty in language and thought. In Shalom Lappin and Chris Fox, editors, The Handbook of Contemporary Semantic Theory, 2nd edition.
- Gururangan et al. (2018) Suchin Gururangan, Swabha Swayamdipta, Omer Levy, Roy Schwartz, Samuel R. Bowman, and Noah A. Smith. 2018. Annotation artifacts in natural language inference data. In Proceedings of the 2018 Conference of the North American Chapter of the Association for Computational Linguistics: Human Language Technologies, Volume 2, pages 107–112.
- Kahneman and Tversky (1979) Daniel Kahneman and Amos Tversky. 1979. Prospect theory: An analysis of decision under risk. Econometrica, 47(2):263–292.
- Khot et al. (2018) Tushar Khot, Ashish Sabharwal, and Peter Clark. 2018. SciTail: A textual entailment dataset from science question answering. In AAAI.
- Kingma and Ba (2015) Diederik P. Kingma and Jimmy Ba. 2015. Adam: A method for stochastic optimization.
- Lai et al. (2017) Alice Lai, Yonatan Bisk, and Julia Hockenmaier. 2017. Natural language inference from multiple premises. In Proceedings of the Eighth International Joint Conference on Natural Language Processing, Volume 1, pages 100–109.
- Lai and Hockenmaier (2017) Alice Lai and Julia Hockenmaier. 2017. Learning to predict denotational probabilities for modeling entailment. In Proceedings of the 15th Conference of the European Chapter of the Association for Computational Linguistics, Volume 1, pages 721–730.
- Lalor et al. (2018) John P. Lalor, Hao Wu, Tsendsuren Munkhdalai, and Hong Yu. 2018. Understanding deep learning performance through an examination of test set difficulty: A psychometric case study. In Proceedings of the 2018 Conference on Empirical Methods in Natural Language Processing, pages 4711–4716.
- Lalor et al. (2016) John P. Lalor, Hao Wu, and Hong Yu. 2016. Building an evaluation scale using item response theory. In Proceedings of the 2016 Conference on Empirical Methods in Natural Language Processing, pages 648–657.
- Lee et al. (2015) Kenton Lee, Yoav Artzi, Yejin Choi, and Luke Zettlemoyer. 2015. Event detection and factuality assessment with non-expert supervision. In Proceedings of the Conference on Empirical Methods in Natural Language Processing, 2015, pages 1643–1648.
- Li et al. (2019) Zhongyang Li, Tongfei Chen, and Benjamin Van Durme. 2019. Learning to rank for plausible plausibility. In Proceedings of the 57th Conference of the Association for Computational Linguistics, pages 4818–4823.
- Marelli et al. (2014) Marco Marelli, Stefano Menini, Marco Baroni, Luisa Bentivogli, Raffaella Bernardi, and Roberto Zamparelli. 2014. The SICK (Sentences Involving Compositional Knowledge) dataset for relatedness and entailment.
- Montague (1973) Richard Montague. 1973. The proper treatment of quantification in ordinary english. In K. J. J. Hintikka, J. M. E. Moravcsik, and P. Suppes, editors, Approaches to Natural Language: Proceedings of the 1970 Stanford Workshop on Grammar and Semantics, pages 221–242. Springer Netherlands, Dordrecht.
- Mostafazadeh et al. (2016) Nasrin Mostafazadeh, Nathanael Chambers, Xiaodong He, Devi Parikh, Dhruv Batra, Lucy Vanderwende, Pushmeet Kohli, and James F. Allen. 2016. A corpus and cloze evaluation for deeper understanding of commonsense stories. In NAACL HLT 2016, The 2016 Conference of the North American Chapter of the Association for Computational Linguistics: Human Language Technologies, pages 839–849.
- Pavlick and Callison-Burch (2016) Ellie Pavlick and Chris Callison-Burch. 2016. Most "babies" are "little" and most "problems" are "huge": Compositional entailment in adjective-nouns. In Proceedings of the 54th Annual Meeting of the Association for Computational Linguistics, Volume 1, pages 2164–2173.
- Pavlick and Kwiatkowski (2019) Ellie Pavlick and Tom Kwiatkowski. 2019. Inherent disagreements in human textual inferences. Trans. Assoc. Comput. Linguistics, 7:677–694.
- Phang et al. (2018) Jason Phang, Thibault Févry, and Samuel R. Bowman. 2018. Sentence encoders on stilts: Supplementary training on intermediate labeled-data tasks. CoRR, abs/1811.01088.
- Poliak et al. (2018) Adam Poliak, Jason Naradowsky, Aparajita Haldar, Rachel Rudinger, and Benjamin Van Durme. 2018. Hypothesis only baselines in natural language inference. In Proceedings of the Seventh Joint Conference on Lexical and Computational Semantics, pages 180–191.
- Roemmele et al. (2011) Melissa Roemmele, Cosmin Adrian Bejan, and Andrew S. Gordon. 2011. Choice of plausible alternatives: An evaluation of commonsense causal reasoning. In Logical Formalizations of Commonsense Reasoning, Papers from the 2011 AAAI Spring Symposium.
- Rudinger et al. (2018) Rachel Rudinger, Aaron Steven White, and Benjamin Van Durme. 2018. Neural models of factuality. In Proceedings of the 2018 Conference of the North American Chapter of the Association for Computational Linguistics: Human Language Technologies, Volume 1, pages 731–744.
- Sakaguchi and Durme (2018) Keisuke Sakaguchi and Benjamin Van Durme. 2018. Efficient online scalar annotation with bounded support. In Proceedings of the 56th Annual Meeting of the Association for Computational Linguistics, Volume 1, pages 208–218.
- Shapiro et al. (2014) Amram Shapiro, Louise Firth Campbell, and Rosalind Wright. 2014. Book of Odds: From Lightning Strikes to Love at First Sight, the Odds of Everyday Life. William Morrow Paperbacks.
- Stanovsky et al. (2017) Gabriel Stanovsky, Judith Eckle-Kohler, Yevgeniy Puzikov, Ido Dagan, and Iryna Gurevych. 2017. Integrating deep linguistic features in factuality prediction over unified datasets. In Proceedings of the 55th Annual Meeting of the Association for Computational Linguistics, Volume 2, pages 352–357.
- Teichert et al. (2017) Adam R. Teichert, Adam Poliak, Benjamin Van Durme, and Matthew R. Gormley. 2017. Semantic proto-role labeling. In Proceedings of the Thirty-First AAAI Conference on Artificial Intelligence, pages 4459–4466.
- Tsuchiya (2018) Masatoshi Tsuchiya. 2018. Performance impact caused by hidden bias of training data for recognizing textual entailment. In Proceedings of the Eleventh International Conference on Language Resources and Evaluation.
- Tversky and Kahneman (1981) Amos Tversky and Daniel Kahneman. 1981. The framing of decisions and the psychology of choice. Science, 211(4481):453–458.
- Tversky and Kahneman (1992) Amos Tversky and Daniel Kahneman. 1992. Advances in prospect theory: Cumulative representation of uncertainty. Journal of Risk and uncertainty, 5(4):297–323.
- Vulić et al. (2017) Ivan Vulić, Daniela Gerz, Douwe Kiela, Felix Hill, and Anna Korhonen. 2017. Hyperlex: A large-scale evaluation of graded lexical entailment. Computational Linguistics, 43(4).
- Williams et al. (2018) Adina Williams, Nikita Nangia, and Samuel R. Bowman. 2018. A broad-coverage challenge corpus for sentence understanding through inference. In Proceedings of the 2018 Conference of the North American Chapter of the Association for Computational Linguistics: Human Language Technologies, Volume 1, pages 1112–1122.
- Zhang et al. (2017) Sheng Zhang, Rachel Rudinger, Kevin Duh, and Benjamin Van Durme. 2017. Ordinal common-sense inference. Trans. Assoc. Comput. Linguistics, 5:379–395.
Appendix A Annotation
Here we include information about the qualifications used to vet annotators. We also include screenshots of the interface used to collect annotations.
A.1 Qualification Test
Annotators were given a qualification test to ensure non-expert workers were able to give reasonable subjective probability estimates. We first extracted seven statements from Book of Odds Shapiro et al. 2014, and manually split the statement into a bleached premise and hypothesis. We then wrote three easy premise-hypothesis pairs with definite probabilities like ( = “A girl tossed a coin.”, = “The coin comes up a head.”, probability: 0.5). We qualify users that meet both criteria: (1) For the three easy pairs, their annotations had to fall within a small error range around the correct label , computed as . (2) Their overall annotations have a Pearson and Spearman . This qualification test led to a pool of 40 trusted annotators, which were employed for the entirety of our dataset creation.
A.2 Annotation Interface
Appendix B Redundant Annotations
By default, we use two crowdsource workers to annotate each UNLI sentence-pair. If the two annotations on the raw slider bar differ by more than 2000, we then elicit a third annotator.
Appendix C Dataset Statistics
Table 6 summarizes the statistics of u-SNLI.
Appendix D Additional Training Details
We use the bert-base-uncased model, with the Adam optimizer Kingma and Ba 2015, an initial learning rate of , and maximum gradient norm 1.0. Our model is trained for 3 epochs, where the epoch resulting in the highest Pearson on the dev set is selected.

Partition Breakdown SNLI U-SNLI train Distinct premises 151k 7,931 ent hypotheses 183k 7,931 neu hypotheses 183k 39,655 con hypotheses 183k 7,931 Total P-H pairs 550k 55,517 dev Distinct premises 3,319 2,647 ent hypotheses 3,329 162 neu hypotheses 3,235 2,764 con hypotheses 3,278 114 Total P-H pairs 10k 3,040 test Distinct premises 3,323 2,635 ent hypotheses 3,368 156 neu hypotheses 3,219 2,770 con hypotheses 3,237 114 Total P-H pairs 10k 3,040