Regression analysis of
unmeasured confounding
Abstract.
When studying the causal effect of on , researchers may conduct regression and report a confidence interval for the slope coefficient . This common confidence interval provides an assessment of uncertainty from sampling error, but it does not assess uncertainty from confounding. An intervention on may produce a response in that is unexpected, and our misinterpretation of the slope happens when there are confounding factors . When are measured we may conduct multiple regression, but when are unmeasured it is common practice to include a precautionary statement when reporting the confidence interval, warning against unwarranted causal interpretation. If the goal is robust causal interpretation then we can do something more informative. Uncertainty in the specification of three confounding parameters can be propagated through an equation to produce a confounding interval. Here we develop supporting mathematical theory and describe an example application. Our proposed methodology applies well to studies of a continuous response or rare outcome. It is a general method for quantifying error from model uncertainty. Whereas confidence intervals are used to assess uncertainty from unmeasured individuals, confounding intervals can be used to assess uncertainty from unmeasured attributes.
Key words and phrases:
Propensity, Correlation, Model uncertainty1. Introduction
Causal inference from observational data is challenging and controversial (Ding and Miratrix 2015). Confounding bias can be eliminated, theoretically, using causal graphs to select an admissible set of covariates for adjustment (Pearl 2009), but this relies on a “web of assumptions” (Rosenbaum 1995). Confounding bias can be assessed with sensitivity analysis and propensity scores (Rosenbaum 2010), assuming estimates of propensity for each individual. In this paper, we show that when an admissible set of covariates is unmeasured and individual estimates for propensity are unavailable, it is still possible to conduct causal inference. Our introduced methodology allows us to bound an adjusted estimate without requiring individual observations on the confounders.
For simplicity and concreteness we focus on the model
| (1) |
We have observations on , where has recorded treatment or exposure values and has measured the resulting response or outcome. The unmeasured confounding set may contain indicator variables for homogeneous groups or higher order interaction terms. The joint error distribution is assumed to be consistent with the principle of least-squares. We can not fit the model since is unmeasured, and we should not fit the reduced model
because the unadjusted slope-coefficient may differ greatly from the adjusted slope-coefficient (Knaeble and Dutter 2017). We can, however, obtain from the parameters
The coefficient of determination is the proportion of variation in explained by using the model fit with least-squares. Here, is the mean and are the fitted values. Similarly, the coefficient of determination is the proportion of variation in explained by using the model fit with least-squares. Here, is the mean and are the fitted values. The coefficient is the Pearson correlation coefficient between the two vectors of fitted values.
Proposition 1.1.
Let be the measured correlation coefficient for and , and let be the measured ratio of standard deviations for and . With , , and as described above, the adjusted slope-coefficient satisfies
| (2) |
Proposition 1.1 can be derived from a proof found in the appendix of Knaeble and Dutter 2017. We provide an alternative proof using projection matrices in Appendix A. Within (2) the terms and can be rewritten as and respectively (c.f. Frank 2000), but there are advantages to our factorized formulation. and are square roots of coefficients of determination and therefore monotonic in , the number of predictors of . Also, the factors and are more intuitive than their product . We develop intuition for within the context of our case study in Section 3.
The -tuple provides insight into unmeasured confounding in a way similar to how epidemiologists use association parameters during categorical sensitivity analysis or bias analysis. They often make use of information on the prevalence of an unmeasured confounder, its association with treatment or exposure, and its effect on the outcome (MacLehose et al. 2005, p. 548). Ding and VanderWeele 2016 have used risk ratios in a condition supporting the E-value (Ding and VanderWeele 2017). Lee 2011 has a condition utilizing risk differences and odds ratios. The performance of conditions has been assessed with simulations (Knaeble and Chan 2018), and conditions originally derived in the continuous setting have performed well.
For continuous sensitivity analysis Frank 2000 has developed an index to bound the impact of confounders, and Hosman et al. 2010 have established reference points for speculation about omitted confounders. Knaeble and Dutter 2017 have shown how to determine the sign of when . Here we improve their result by showing how to capture within an interval. This confounding interval is computed using an algorithm described in Section 2. Supporting proofs are provided in the appendix. In Section 3 we describe an example case study emphasizing uncertainty from unmeasured attributes over uncertainty from unmeasured individuals (c.f. Knaeble 2015). In Section 4 we discuss extensions and limitations of our methodology while emphasizing connections with topics of interest in causality, the Bayesian paradigm, categorical sensitivity analysis, propensity scores, and high-dimensional data analysis.
2. Methods
We specify six interval endpoints determining the constraints
| (3a) | ||||
| (3b) | ||||
| (3c) | ||||
Not all tuples that satisfy the constraints are realistic. To characterize realistic tuples we need a fourth constraint. The following proposition is proven in Appendix B.
Proposition 2.1.
The tuple of statistics can arise from actual data only if
| (4) |
Conversely, if and the coefficients satisfy
then we can construct data for these coefficients which realize the tuple .
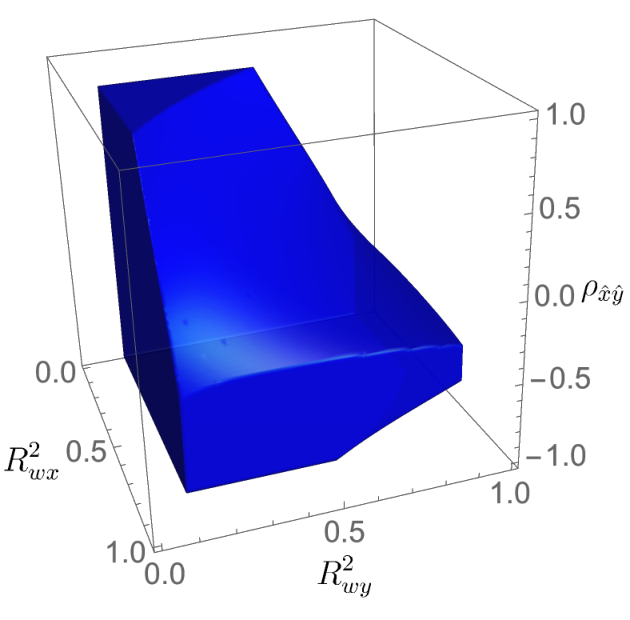
The intersection of the four constraints given in (3) and (4) is assumed to be nonempty. An example of for one choice of parameters is given in Figure 1; the parameters are specified in the caption. We refer to as the feasible set. A point is said to be feasible if it is an element of .
Given , the function
| (5) |
is continuous on . Since the function is continuous and is connected, by the intermediate value theorem, is an interval. By the Weierstrass extreme value theorem, the interval is closed and we write
| (6) |
We refer to as a confounding interval.
Computation of a confounding interval requires solutions to the non-convex, constrained optimization problem in (6), i.e., minimizing and maximizing , over the feasible set . We have developed an algorithm for computing any confounding interval from input parameters
The algorithm computes exact solutions in negligible run time. It is based on the following proposition.
Proposition 2.2.
Let denote the square of the two solutions to the quadratic equation , i.e., . Let be the discrete set of points that are feasible and of one of the following forms:
| (7a) | ||||
| (7b) | ||||
| (7c) | ||||
| (7d) | ||||
| (7e) | ||||
| (7f) | ||||
| (7g) | ||||
where , , and . Then
A proof of Proposition 2.2 is given in Appendix C. The set is finite with cardinality for all sets of parameter values. Given input parameters the computational algorithm first determines and then computes and , which are the endpoints of the desired confounding interval according to Proposition 2.2. Python and R implementations of this algorithm are provided at the first author’s github page (Knaeble 2019).
3. Application
Eskenazi et al. 2013 studied children and found an association between in utero PBDE exposure (log transformed) and follow-up IQ at 7 years of age. Regression of on produces a slope estimate with a standard error . While there is some uncertainty about whether this finding is statistically significant, there is also uncertainty about whether causal interpretation is warranted. For reference we record the standard deviations and () and the correlation .
We can use potential outcomes to define non-confounding or ignorable treatment or exposure assignment (Rosenbaum and Rubin 1983). Causal inference is warranted when conditional on some covariate set the potential outcomes are independent of treatment: . The assumption of ignorable treatment assignment can be made more believable by conditioning on as many pretreatment covariates as possible (Rubin 2009; Rosenbaum 2002, p. 76). Eskenazi et al. adjusted for sex, mothers score on a vocabulary test, spoken language, maternal years spent living in the US, parity, and exposure to environmental tobacco smoke. Their adjusted estimate was .
It is possible for an adjusted estimate to have amplified bias (Ding and Miratrix 2015). There are (non statistical, causal) methods for selecting an admissible set of covariates for adjustment (Pearl 2009). If the admissible set is unmeasured some insight can be gained by using our algorithm (see Section 2). We can construct a confounding interval to assess uncertainty from unmeasured confounding by any set of confounders. To demonstrate our proposed methodology we consider unmeasured confounding by diet, simplified as : fat consumption, protein consumption.
VanderWeele and Shpitser 2011 recommend adjustment for any covariate that causes exposure or the outcome. There are reasons to suspect diet as a cause of PBDE exposure (Schecter et al. 2010; CDC 2017). Suppose for illustrative purposes that we bound diet’s coefficient of determination for PBDE exposure as follows: . Diet may also be a causal factor for IQ (Kuratko et al. 2013; Liu et al. 2003). Suppose again for illustrative purposes that we bound diet’s coefficient of determination for IQ as follows: . Based on this information alone we may apply our optimization algorithm (see Section 2) and conclude . Since the upper and lower bounds for were left unspecified we have set and by default.
Tighter bounds on are possible through careful specification of and to bound . We describe two hypothetical situations to improve reader intuition for . In each scenario we have within an largely determined by the first variable, fat consumption (Schecter et al. 2010). On a population that consumes fish we may have within a also largely determined by the first variable, (beneficial) fat consumption (Kuratko et al. 2013), resulting in near . On a population that does not consume fish we may have within a now largely determined by the second variable, protein consumption (Liu et al. 2003), resulting in near .
Negative confounding (Choi et al. 2008) occurs when . If for illustrative purposes we rule out negative confounding and specify in addition to our previously specified and then another application of the optimization algorithm produces the tighter bound . This interval can be seen in black on the lower left portion of the plot in Figure 2. The plot shows a rough dependence of on . Open source software for making similar plots is provided at the first author’s github page (Knaeble 2019).
4. Discussion
We have gained insight into unmeasured confounding using coefficients of determination and correlation between fitted values. Uncertainty of these coefficients can be propagated through Equation 2 to produce a confounding interval. The details of this methodology have been described in Section 2, and an example case study application has been described in Section 3. In this section, we elaborate by describing various extensions and some limitations while emphasizing connections to related topics of interest.
4.1. Necessary conditions
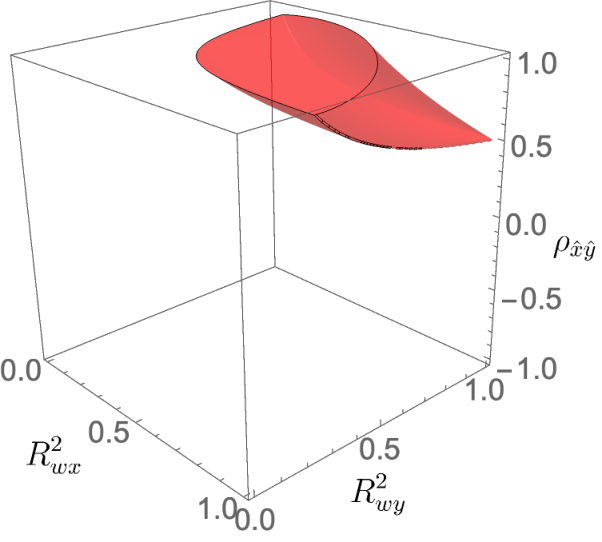
To avoid assumptions (Ding and VanderWeele 2016, p. 369) a researcher may seek conditions on that are necessary for any interpretation to explain away the observed association (Cornfield et al. 1959; Ding and VanderWeele 2014). We could use (4) and (5) to determine the subset of -values that are realizable from an actual and necessary for to be practically insignificant. This approach is illustrated in Figure 3. If the resulting subset is unreasonably extreme (i.e. inconsistent with subject matter knowledge) then we may infer from the -data and supporting analysis that is practically significant for all . To avoid retrospective confirmation bias we recommend prospective definition of practical significance and reasonable -values.
4.2. Bayesian paradigm
We have seen how is important during assessment of uncertainty from unmeasured confounding. Researchers may also bound or even , and bounds on these quantities manifest as additional constraints on . More generally, researchers may specify an arbitrary subset of possible -values. On the basis of previously published literature a prior distribution on may be specified and transformed through Proposition 1.1 to produce a distribution on . Our methodology can thus be used to support reuse of externally valid experiments to facilitate causal inference from observational studies. Supplementary to classic use of confidence intervals in meta analyses, confounding intervals can be used to check for consistency between observational studies and controlled trials in a systematic review.
4.3. Causal inference
An admissible is required for causal interpretation of a confounding interval, and toward this ideal analysts should consider all causes of variation in for inclusion within (VanderWeele and Shpitser 2011). For instance, in the application study of Section 3, we could have included household use of electronics (Horton et al. 2013; Ramani et al. 2017) in addition to diet. Researchers can also adjust for covariates that cause (VanderWeele and Shpitser 2011), and if a covariate causes but not then it can be used to transform (Knaeble 2017) before applying our method. Some precaution is warranted when adjusting for confounders that are themselves not randomly assigned (Ding and Miratrix 2015, Section 2, Butterfly Bias). Fisher 1935 has written of randomization as the “reasoned basis” for causal inference (Rosenbaum 2010, p. 33). When there has been random assignment to we may then reason causally to bound .
4.4. Extensions and limitations
We can repeatedly apply our methodology across the levels of a moderator variable to study effect modification or interaction effects (Corraini et al. 2017; VanderWeele 2009). If subgroup sample sizes are small we may incorporate sampling distributions for and . We do not recommend use of our methodology to assess uncertainty from unmeasured confounding of already-adjusted slope-coefficients, unless coefficients of determination and correlations between residual vectors remain intuitive. Measurements on a subset of an admissible set of covariates can be used to estimate lower bounds and . We describe a technique for estimating upper bounds in Section 4.8. We can not conduct thorough regression diagnostics when part of is unmeasured. Also, we require a model that is linear in its parameters which precludes straightforward application during logistic regression (Rothman and Greenland 1998, Chapter 20). Some modification is required before application during interrupted time series analysis (Kontopantelis et al. 2015).
4.5. Categorical predictors
We do not require linearity of observed data. Our main assumption is a causal effect that for some is linear, perhaps only locally, and perhaps only on some suitable subpopulation. We automatically have a linear when is dichotomous categorical, e.g. when it is an indicator for a treatment or an exposure. Then we can bound the magnitude of (the linear quantity) using a (nonlinear) model of propensity (Rosenbaum and Rubin 1983) and a generalized . This framework is flexible enough to provide some support during causal interpretation of a comparison between two means. For improved modeling we recommend use of indicator variables within , c.f. Hastie et al. 2008. When contains categorical variables they can be replaced with indicator variables in the standard way.
4.6. Categorical outcomes
When is dichotomous-categorical and the categories can be determined from a continuous latent model (as possible with say a Probit model) then we can estimate the latent and values from the fitted parameters of the categorical model and proceed with the continuous analysis, or we can use least-squares estimates directly to estimate proportions. If is rare and acts on (and only on) a fixed proportion of individuals then conditional rate differences may be roughly constant across the levels of a categorical and the adjusted (for ) rate difference can be approximated with . If is common then inequalities (Knaeble and Chan 2018, Lemma 5.3) and approximations (VanderWeele 2017) provide some support for using regression coefficients to analyze unmeasured confounding of a contingency table (Knaeble and Chan 2018).
4.7. Propensity scores
Rosenbaum and Rubin 1983 write that the propensity score is the coarsest balancing score. Hypothetically or ideally under their assumptions fine covariate data is no longer needed; coarse propensity is sufficient. Here we go a step further, toward more coarseness, essentially collapsing rows (of individuals) in addition to columns (of attributes). Under our assumptions propensity is no longer needed; the three statistics , , and are sufficient, where estimates propensity for treatment. It is the correlation between propensity ( and treatment () that matters most (see the role of in (2)). This correlation is related to the distribution of propensities. This correlation is close to zero when the propensities are nearly constant, and it is close to one when the propensities are near zero and one. This correlation is determined by the distribution of propensities, given a sufficiently large sample.
4.8. High-dimensional data
It can be difficult to interpret an observational study of high-dimensional data when there is model uncertainty (Chatfield 1995), and it may not be computationally feasible to fit every possible candidate model (Patel, Burford, and Ioannidis 2015). Once a parsimonious model (McNamee 2005) has been selected confounding intervals can be used to quickly assess the sensitivity of interpretations to any model extension within some space of regular extensions. Since is monotonic in the number of predictors we can objectively set the constraints and by considering the largest set of predictors omitted from the parsimonious model and analyzing their coefficients of determination for and conditional on the set of covariates in the parsimonious model (Knaeble and Dutter 2017).
4.9. Natural experiments
We have an objective approach to assess uncertainty of residual confounding during causal analysis of high-dimensional observational data. We also have a way to assess potential for unmeasured confounding using the parameters , , and . The parameter gives the proportion of variation in that is due to , and here it can be understood as a measure of departure from a randomized experiment (where ) to a study with fully deterministic treatment assignment (where ). Some studies are quasi-experiments, and when variation in is mostly haphazard researchers may refer to the study as a natural experiment (Rosenbaum 2010, p. 5). This language for classifying studies can be made more precise with specification of bounds for , , and . These bounds can then be transformed into confounding intervals for improved causal inference.
Acknowledgement
We thank Tom Greene, Judy Ou, Jincheng Shen, and Yue Zhang for various suggestions and James Miles for his derivation of Proposition 2.1.
References
- CDC (2017) CDC (2017). Public Health Statement on Polybrominated Diphenyl Ethers (PBDEs). [Online] Retrieved 20 March 2019 from https://www.atsdr.cdc.gov/ToxProfiles/tp207-c1-b.pdf
- Chatfield (1995) Chatfield, C. (1995). Model uncertainty, data mining and statistical inference. Journal of the Royal Statistical Society: Series A, 158, 419-466.
- Choi et al. (2008) Choi et al. (2008). Negative Confounding in the Evaluation of Toxicity: The Case of Methylmercury in Fish and Seafood. Critical Reviews in Toxicology, 38(10).
- Cornfield et al. (1959) Cornfield et al. (1959). Smoking and lung cancer: recent evidence and a discussion of some questions. Journal of the National Cancer Institute, 22, 173-203.
- Corraini et al. (2017) Corraini et al. (2017). Effect modification, interaction and mediation: an overview of theoretical insights for clinical investigators. Clinical Epidemiology, 9: 331-338.
- Ding and Miratrix (2015) Ding, P. and Miratrix, L. (2015). To Adjust or Not to Adjust? Sensitivity Analysis of M-Bias and Butterfly-Bias. Journal of Causal Inference, 3(1), 41-57.
- Ding and VanderWeele (2014) Ding, P. and VanderWeele, T. (2014). Generalized Cornfield conditions for the risk difference. Biometrika, 101(4).
- Ding and VanderWeele (2016) Ding, P. and VanderWeele, T. (2016). Sensitivity Analysis Without Assumptions. Epidemiology, 27(3): 368-377.
- Ding and VanderWeele (2017) Ding, P. and VanderWeele, T. (2017). Sensitivity Analysis in Observational Research: Introducing the E-Value. Annals of Internal Medicine, 167(4): 268-274.
- Eskenazi et al. (2013) Eskenazi et al. (2013). In utero and childhood polybrominated diphenyl ether (PBDE) exposures and neurodevelopment in the CHAMACOS study. Environmental Health Perspectives, 121(2):257-62.
- Fisher (1935) Fisher, R.A. (1935). Design of Experiments. Oliver and Boyd.
- Frank (2000) Frank, K. (2000). Impact of a Confounding Variable on a Regression Coefficient. Sociological Methods & Research, 29(2) 147-194.
- Hastie et al. (2008) Hastie, Tibshirani, and Friedman (2008). The Elements of Statistical Learning, Data Mining, Inference, and Prediction. Springer.
- Horton et al. (2013) Horton et al. (2013). Polybrominated flame retardants among healthy pregnant women in an urban environment: a cross-sectional study. Environmental Health, 12:23.
- Hosman et al. (2010) Hosman, C., Hansen, B., and Holland, P. (2010). The sensitivity of linear regression coefficients’ confidence limits to the omission of a confounder. The Annals of Applied Statistics, 4(2), 849-870.
- Knaeble (2019) Knaeble, B. (2019). https://github.com/bknaeble/ConfoundingIntervals
- Knaeble (2015) Knaeble, B. (2015). Regression and Random Confounding. Electronic Journal of Applied Statistical Analysis, 8(3).
- Knaeble (2017) Knaeble, B. (2017). Adjustment with three continuous variables. Communications in Statistics - Simulation and Computation, 48(2).
- Knaeble and Chan (2018) Knaeble, B. and Chan, J. (2018). Odds are the sign is right. Biometrical Journal.
- Knaeble and Dutter (2017) Knaeble, B. and Dutter, S. (2017). Reversals of Least-Squares Estimates and Model-Invariant Estimation for Directions of Unique Effects. The American Statistician, 71(2).
- Kontopantelis et al. (2015) Kontopantelis et al. (2015). Regression based quasi-experimental approach when randomisation is not an option: interrupted time series analysis. BMJ, 350:h2750.
- Kuratko et al. (2013) Kuratko et al. (2013). The Relationship of Docosahexaenoic Acid (DHA) with Learning and Bahavior in Healthy Children: A Review. Nutrients, 5(7): 2777-2810.
- Lee (2011) Lee WC. (2011) Bounding the Bias of unmeasured factors with confounding and effect modifying potentials. Statistics in Medicine, 30(9):1007-1017.
- Liu et al. (2003) Liu et al. (2003). Malnutrition at Age 3 Years and Lower Cognitive Ability at Age 11 Years - Independence From Psychosocial Adversity. Arch Pediatr Adolesc Med, June, 2003.
- MacLehose et al. (2005) MacLehose et al. (2005). Bounding causal effects under uncontrolled confounding using counterfactuals. Epidemiology, 548-555.
- McNamee (2005) McNamee, R. (2005). Regression modelling and other methods to control confounding. Occupational and environmental medicine, 62 (7), 500-506.
- Nocedal and Wright (2006) Nocedal, J. and Wright, S. (2006). Numerical Optimization. Springer.
- Patel, Burford, and Ioannidis (2015) Patel, CJ. Burford, B. and Ioannidis, JP. (2015). Assessment of vibration of effects due to model specification can demonstrate the instability of observational associations. Journal of Clinical Epidemiology.
- Pearl (2009) Pearl, J. (2009). Causal inference in statistics: An overview. Statistics Surveys, Vol. 3, 96-146.
- Ramani et al. (2017) Ramani et al. (2017). Domain-Specific and Domain-General Training to Improve Kindergarten Children’s Mathematics. Journal of Numerical Cognition, 3(2).
- Rosenbaum and Rubin (1983) Rosenbaum, P. and Rubin, D. (1983). The central role of the propensity score in observational studies for causal effects. Biometrika, 70(1), 41-55.
- Rosenbaum (1995) Rosenbaum, P. (1995). Discussion of ‘Causal diagrams for empirical research’ by J Pearl. Biometrika, 82(4), p 698.
- Rosenbaum (2002) Rosenbaum, P. (2002). Observational Studies. Springer.
- Rosenbaum (2010) Rosenbaum, P. (2010). Design of Observational Studies. Springer.
- Rothman and Greenland (1998) Rothman, K. and Greenland, S. (1998). Modern Epidemiology. Lippincott, Williams, & Wilkins.
- Rubin (2009) Rubin, D. (2009). Should observational studies be designed to allow lack of balance in covariate distributions across treatment groups? Statistics in Medicine, 28, 1420-1423.
- Schecter et al. (2010) Schecter et al. (2010). Polybrominated Diphenyl Ethers (PBDEs) and Hexacbromocyclodecane (HBCD) in Composite U.S. Food Samples. Environmental Health Perspectives, 118(3): 357-362.
- VanderWeele (2009) VanderWeele, T. (2009). On the Distinction Between Interaction and Effect Modification. Epidemiology, 20: 863-871.
- VanderWeele (2017) VanderWeele, T. (2017). On a square-root transformation of the odds ratio for a common outcome. Epidemiology, 28(6): e58–e60.
- VanderWeele and Shpitser (2011) VanderWeele, T. and Shpitser, I (2011). A new criterion for confounder selection. Biometrics, 67(4), 1406-13.
Appendix A Proof of Proposition 1.1
Let denote the ones vector, ,
Note that and are projection matrices, i.e., and . Furthermore, since includes as a column, we have that , , and is also a projection matrix.
We use and to write , ,
and
Using the above expressions, we compute
Dividing both sides by , we obtain
| (8) |
Solving for , we obtain an expression for the partial correlation,
| (9) |
We now consider our model from (1) rewritten as
where . Write and . Note that is a projection matrix, and since , we have that and . In this notation, the fitted values are given by
We now add and subtract terms as follows:
and rearrange to obtain:
We now apply to both sides, take the inner product with on both sides, use , and rearrange to obtain
| (10a) | ||||
| (10b) | ||||
| (10c) | ||||
Appendix B Proof of Proposition 2.1
Conversely, if , there are sufficient degrees of freedom for to take any desired value in .
Appendix C Proof of Proposition 2.2
We assume that the feasible set is non-empty and is defined by the upper and lower inequality constraints in (3a), (3b), (3c), and (4), for eight inequality constraints in total. We do not allow in (4), but we do allow , , and or . We say an inequality constraint is active when it holds with equality. In what follows for we say exactly constraints are active when exactly constraints are active and each active constraint is from a different line of (3a), (3b), (3c), or (4), e.g., counts as one constraint not two constraints. There is no ambiguity when zero constraints are active. In three dimensions it is impossible or redundant to have four active constraints.
Recalling our notation and , we say a point is optimal if it satisfies or . To prove Proposition 2.2 we show that any optimal points in must also be within the finite subset of points . and depend on parameters as described in Section 2. Recall, . Note that
wherever and . To simplify algebra in what follows we compute in place of and in place of . Likewise, we infer the constancy of in or from its constancy in or respectfully.
Wherever no constraints are active and no optimal points exist. If exactly one constraint is active, we have the following cases. If the constraint is from either (3a) or (3b), then . If that constraint is (3c), then either or, if , is constant in . Finally, if that one constraint is (4), then
| (12) |
which is strictly monotonic in both and on both surfaces
| (13) |
We have thus far shown that two or more constraints must be active in order for a point to be optimal.
Suppose exactly two constraints are active. If those two constraints are (3a) and (3b) then and either or is constant in . If those two constraints are (3a) and (3c) then and either or is constant in . If those two constraints are (3b) and (3c) then and because optimal points require
We now consider exactly two active constraints and require one of them to be (4). If those two constraints are (3a) and (4) then as in (12) we have strictly monotonic in . If those two constraints are (3b) and (4) then as in (12) we have strictly monotonic in . If those two constraints are (3c) and (4) then , or written differently
| (14) |
Along a curve , via (12),
At an optimal point, for some real , we must have (Nocedal and Wright 2006, p. 31), implying equality between
and
which in turn implies . Solving for within (14) produces or resulting in lines (7b) and (7c) of Proposition 2.2.
Suppose exactly three constraints are active. If those three constraints are (3a), (3b), and (3c) then any candidate point is of the form as in line (7d) of Proposition 2.2. If those three constraints are (3a), (3b), and (4) then via (13) we have resulting in line (7e) of Proposition 2.2. If those three constraints are (3a), (3c), and (4) then via (13) we have , which after rearrangement and squaring gives
| (15) |
Using the quadratic formula on (15) results in line (7f) of Propositon 2.2. If those three constraints are (3b), (3c), and (4) then likewise via (13) we have and with analogous rearrangement, squaring, and use of the quadratic formula we solve for and derive line (7g) of Proposition 2.2.