Constraints for stellar electron-capture rates on 86Kr via the 86Kr(,3He)86Br reaction and the implications for core-collapse supernovae
Abstract
In the late stages of stellar core-collapse, prior to core bounce, electron captures on medium-heavy nuclei drive deleptonization and simulations require the use of accurate reaction rates. Nuclei with neutron number near , just above atomic number , play an important role, but rates used in astrophysical simulations rely primarily on a relatively simple single-state approximation. In order to improve the accuracy of astrophysical simulations, experimental data are needed to test the electron-capture rates and to guide the development of better theoretical models. This work presents the results of the 86Kr(,3He+) experiment at the NSCL, from which an upper limit for the Gamow-Teller strength up to an excitation energy in 86Br of 5 MeV is extracted. The derived upper limit for the electron-capture rate on 86Kr indicates that the rate estimated through the single-state approximation is too high and that rates based on Gamow-Teller strengths estimated in shell-model and QRPA calculations are more accurate. The QRPA calculations tested in this manner were used for estimating the electron capture rates for 78 isotopes near and above . The impact of using these new electron-capture rates in simulations of supernovae instead of the rates based on the single-state approximation is investigated, indicating a significant reduction in the deleptonization that affects multi-messenger signals, such as the emission of neutrinos and gravitational waves.
pacs
21.60.Cs, 23.40.-s, 25.40.Kv, 26.30.JkI Introduction
Reactions mediated by the weak nuclear force, such as electron captures and decays, are known to play important roles in many stellar phenomena. In particular, the rates at which nuclei capture electrons at high stellar densities and temperatures affects the evolution of core-collapse supernovae Fryer 1999; Heger et al. 2003; Janka et al. 2007; Janka et al. 2012; Burrows 2013; Langanke and Martínez-Pinedo 2003. The late stages of core-collapse supernovae, immediately before the explosion of the star, are heavily dependent on electron-capture rates on medium-heavy, neutron-rich nuclei Richers et al. 2017; Janka et al. 2007; Hix et al. 2003; Bethe et al. 1979; Langanke et al. 2003; Sullivan et al. 2016. In recent sensitivity studies Sullivan et al. 2016; Titus et al. 2018; Furusawa et al. 2017; Pascal et al. 2019, the electron captures on nuclei surrounding the shell closure above 78Ni (here referred to as the “high-sensitivity region”) were shown to have a significant effect on the change in electron fraction of the star during the period of deleptonization until core bounce.
Electron-capture rates are sensitive to Gamow-Teller transitions (, , ) in the direction. Such transitions can be measured directly via -decay experiments but are limited to probing transitions within a finite -value window. For neutron-rich systems, which are of greatest importance for core-collapse supernovae, the values of such reactions are negative. Hence, no direct information can be obtained from decay, although decay data from the electron-capture daughter to the mother can be used to estimate the ground-state to ground-state transition strength. Gamow-Teller strengths may also be measured indirectly via charge-exchange reactions, which are not limited by a -value window, yielding information about transitions at higher excitation energies. Additionally, because there is a well-known proportionality between the charge-exchange cross section and the Gamow-Teller strength Taddeucci et al. 1987; Zegers et al. 2006; Zegers et al. 2007, the strength distribution, and associated electron-capture rates, can be extracted model-independently.
While it would be preferable to derive electron-capture rates for astrophysical simulations based on measured Gamow-Teller strengths, this is not feasible for two reasons. First, there are thousands of nuclei that participate in these astrophysical processes, making it difficult to perform charge-exchange experiments on all of them in a timely manner. Second, transitions from thermally populated low-lying excited states Langanke and Martínez-Pinedo 2000 and high-temperature unblocking effects occur in stellar environments Langanke et al. 2001, but cannot be explored in the laboratory. For these reasons, the majority of electron-capture rates must come from theoretical calculations. Experimental data are needed to validate and benchmark current theoretical models and to guide the improvement of these models.
The neutrino interaction library NuLib O’Connor 2015; Sullivan 2015, which is used in a variety of astrophysical simulations, including the spherically-symmetric, general-relativistic hydrodynamics code GR1D, O’Connor 2015; O’Connor and Ott 2010 used in this work, contains electron-capture rates on approximately 4000 nuclei. The electron-capture rates within the tables are derived from a variety of theoretical calculations and experimental data Fuller et al. 1982; Oda et al. 1994; Langanke and Martínez-Pinedo 2003; Langanke and Martínez-Pinedo 2001; Hix et al. 2003; Langanke et al. 2001; Pruet and Fuller 2003; Suzuki et al. 2016. For light nuclei (up to the shell), shell-model calculations have been used for computing electron-capture rates, which are well-tested against data (see Ref. Cole et al. 2012 and references therein). However, for medium-heavy and heavy nuclei, and nuclei near the drip lines, the calculations rely on a variety of other approaches. For a large number of nuclei for which no rates based on microscopic calculations are available for the density and temperature ranges of relevance for astrophysical simulations, a “single-state approximation” is presently used. It is based on the following parametrization Langanke et al. 2003; Raduta et al. 2017:
| (1) |
where is the electron mass, s, are Fermi integrals of rank and degeneracy , , , and and are the temperature and electron chemical potential, respectively. , the effective Gamow-Teller transition strength, is fixed for all isotopes to 4.6. , the effective excitation energy was originally fixed Langanke et al. 2003 to a single value for all nuclei, but following Ref. Raduta et al. 2017, is adjusted based on the neutron and proton numbers of the parent nucleus.
For the nuclei in the high-sensitivity region, one presently relies primarily on this single-state approximation to calculate the electron-capture rates, potentially leading to a significant overestimation of the rates Titus et al. 2018, because it does not account fully for Pauli-blocking effects, which become increasingly prominent for progressively more neutron-rich nuclei. In order to achieve more accurate astrophysical simulations, it is necessary to obtain more accurate electron-capture rates in the high-sensitivity region. Therefore, an effort was started to better constrain and guide the theoretical development by performing charge-exchange experiments on nuclei at and near the shell closure, starting with 86Kr, 88Sr jua 2019, and 93Nb. In parallel, new theoretical calculations were pursued that can be compared with the single-state approximation, and benchmarked by the data. These efforts are closely integrated with astrophysical simulations, in order to have immediate feedback on sensitivities of astrophysical phenomena to variations in electron-capture rates derived from experimental and theoretical strength distributions.
This work describes the experimental results of a (,3He) charge-exchange reaction experiment on 86Kr and the comparison with shell-model and quasi-particle random-phase approximation (QRPA) calculations. The latter model is also used to create a new addition to the electron-capture rate tables, which is inserted into NuLib to estimate the impact on the late-stage evolution of core-collapse supernovae.
II Experimental Setup
The 86Kr(,3He+) experiment was performed at the National Superconducting Cyclotron Laboratory (NSCL). A primary beam of 16O, generated by the Coupled Cyclotron Facility (CCF) with an energy of 150 MeV/, was impinged on a beryllium production target with a thickness of 3525 mg/cm2. The A1900 fragment separator Morrissey et al. 2003 was used to select tritons from the reaction products by using an aluminum wedge Hitt et al. 2006, yielding a secondary beam with an energy of approximately 115 MeV/ and a purity in excess of 99%. A negligible amount of 6He particles was also present in the beam. The energy spread of the triton beam was about 3.3 MeV. The tritons were transported to a 86Kr gas target cell, which was 7 cm in diameter and 3 cm in thickness. The gas target was controlled and monitored by the Ursinus College Liquid Hydrogen Target gas handling system Palardy et al. 2010. When filled with 86Kr gas with a purity of 99.952% to a pressure of 1210 Torr at a temperature of 295 K, the target thickness was approximately constant with a value of 20 mg/cm2. The target thickness was measured by comparing (,3He) spectra in the S800 focal plane with the target filled and empty. The target cell windows were made of kapton foil (C22H10N2O5) with a thickness of 125 m. Reactions on the 12C nuclei in the windows were used for data calibration. Production runs with the target cell both filled and empty were performed in order to determine the contribution of events from the target windows to the measured cross section. In addition, data were taken with only the upstream target-cell foil and only the downstream target-cell foil to model the background from reactions on the windows, as discussed below.
3He reaction products were momentum-analyzed by the S800 magnetic spectrograph Bazin et al. 2003. The triton beam was transported to the target using dispersion-matched optics Fujita et al. 2002 to improve the energy resolution of the reconstructed excitation-energy spectra to about 400 keV (see below) even though the beam energy spread was 3.3 MeV. The magnetic rigidity of the transport beam line was 4.8 Tm (close to the present limit for operating in dispersion-matched optics). The magnetic rigidity of the S800 was set to 2.32 Tm, well below its maximum rigidity of 4 Tm. A timing signal from a 5-mm thick plastic scintillator, placed behind the tracking detectors at the end of the S800 focal plane, was used in conjunction with the cyclotron RF signal to obtain the time-of-flight of particles through the spectrograph. Together with the energy-loss signal in the plastic scintillator (the 3He particles were not stopped), 3He ejectiles were cleanly separated from background caused by unreacted tritons scattering off the S800 beam chamber in its first dipole magnet. The scattering angles and momenta of the 3He ejectile at the target were reconstructed by using the position and angle measurements from two cathode-readout drift chambers (CRDCs) Yurkon et al. 1999, with a detection efficiency of about 95%, measured relative to 3He particles detected in the scintillator. An inverse raytrace matrix was used to determine the scattering angle and momentum at the target from the position and angle measurements in the focal plane detectors Makino and Berz 1999. A missing-mass calculation yielded excitation energies of the reaction products, 86Br, along with 16F, 14C and 12B from the target windows, with an energy resolution of keV full width at half maximum (FWHM). This resolution was determined from the excitation of the 12B ground state, which is the dominant peak in the spectrum. Given the limited statistics obtained for reactions from the 86Kr gas target, the analysis was performed in bins of 500 keV wide. Scattering angles at the target position were measured from 0 4 with an angular resolution of 12 mrad (FWHM). The angular acceptance of the S800 is 100% for scattering angles up to 50 mrad. For larger scattering angles, the reduced solid angle coverage is corrected for in the determination of the differential cross sections.
The high resolution -ray detection array, GRETINA Paschalis et al. 2013; Weisshaar et al. 2017, was installed around the target position. To make room for the gas handling system of the krypton target cell, all thirty-two high-purity germanium crystals (36 fold segmented) were placed in the northern hemisphere of the frame, yielding about 1 solid-angle coverage. The detectors were used to measure rays from the de-excitation of 86Br, in an attempt to extract weak Gamow-Teller transitions from among the other transitions that could occur. Owing to the excellent photo-peak energy resolution and efficiency (6% efficiency for MeV as measured with 152Eu source, and 4% for MeV), these measurements can be used to identify low-lying weak transitions which are not easily identified in the (,3He) singles data. This technique has been used successfully in past charge-exchange experiments to extract transitions with Gamow-Teller strengths of as low as 0.01 Noji et al. 2015; Noji et al. 2014. The live-time of the combined data acquisition systems of S800 and GRETINA was about 90%. The S800 singles 3He event rate was about 30 events per second. The true-to-random coincidence ratio for S800-GRETINA coincidences was about 125.
III Experimental Results
III.1 Calibration of the Absolute Cross Section
The windows of the gas target cell introduced reactions on 12C, 16O and 14N contaminants into the experimental data. Although this complicated the analysis as discussed below, it also provided an advantage. Because these reactions were present in all of the data, it simplified the data calibration and overall normalization. Calibrations of the experimental data and determination of the absolute normalization factors were performed by using the 12C(,3He)12B(1+; g.s.) reaction, which has been studied in detail previously Scott et al. 2014 and the absolute cross sections are known. That previous measurement used nearly the identical setup as for the experiment described here, except that in the previous measurement the beam intensity was carefully measured and monitored by in-beam scintillators, to reduce the systematic uncertainties in the absolute normalization. Hence, the cross section for 86Kr(,3He) reactions were determined relative to the known cross section for the 12C(,3He)12B(1+; g.s.) reaction (after accounting for the difference in the number of 12C and 86Kr particles in the target and its foils) since this eliminated the need to carefully monitor the beam intensity or to correct for detection efficiencies and other factors that can affect the absolute cross section measurement, as these are identical for reactions on 12 and 86. Data for the 14N(,3He)14C reaction (previously measured by using the (,2He) reaction Negret et al. 2006) were used as additional checks on the energy and angular calibration.
The corresponding excitation-energy spectra extracted for these reactions are shown in Figs. 1(a) and 1(b). In Fig. 1(a) the 12C(,3He)12B(1+; g.s.) transition can clearly be identified. In Fig. 1(b), several excitations belonging to (,3He) reactions on 14N are identified at their appropriate excitation energies. In Figs. 1(c) and 1(d), the measured differential cross sections for the 12C(,3He)12B(1+; g.s.) and 14N(,3He)14C(2+; 8.3 MeV) excitations are shown. Both of these are well-known Gamow-Teller transitions and are compared with differential cross sections calculated in the distorted-wave Born approximation (DWBA); see Ref. Scott et al. 2014 and Sec. III.2 for further details. Note that for the 14N(,3He)14C(2+; 8.3 MeV) reaction at scattering angles beyond , charge-exchange reactions on hydrogen contaminated the signal and were excluded from Fig. 1(d).

III.2 Singles Analysis
Compared to the events from reactions on the target windows, the 86Kr(,3He) signal was small. Therefore, it was necessary to subtract the target-window events from the krypton-cell data, in order to extract the reactions on 86Kr. To perform this subtraction accurately, data were taken on the upstream and downstream foils of the target cell separately, from which the background to the data could be modeled. To test the subtraction procedure, the data from the individual upstream and downstream windows were first used to reconstruct the empty-cell data (with both upstream and downstream windows in place). In order to accomplish this, corrections accounting for the energy losses and energy and angular straggling of the 3H and 3He particles in the windows were made. As an example, the results for one angular bin (1∘–2∘) are shown in Fig. 2. In the top panel, there are several peaks, corresponding to events from 12C, 16O and 14N in the windows. Spectra from the individual upstream target window and the downstream target window are shown as well. For these, the energy-loss and energy- and angular-straggling corrections have already been applied, which is why the two spectra are slightly offset. The background model is the sum of these two contributions. When the model was subtracted from the empty-cell data, the bottom plot of Fig. 2 resulted. From this, it is clear that the background model matched the data from the empty cell quite well, although for 5 MeV, a combination of statistical and systematic uncertainties caused some deviations from zero. These could, for example, be due to minor changes in the beam properties during the experiment.

After using the background-subtraction method on the empty cell, the process was modified to subtract the target-window events from the cell filled with krypton gas. The additional step necessary for this analysis was to include the energy loss due to the 3H and 3He particles passing through the 86Kr-filled cell. Due to the bulging of the target foils (up to 5 mm at the center of the foils) when the cell was filled with gas, in combination with the 5-cm tall beam-spot size in the dispersive plane associated with operating in dispersion-matched optics Hitt et al. 2006, the 86Kr target thickness was not uniform. This effect was included in the background model. By varying the energy-losses within reasonable experimental uncertainties ( keV; the average energy loss of the beam and ejectile through the target is about 1.25 MeV), the subtraction was optimized, based on the reproduction of the strong 12C peak in the excitation-energy spectra.

An example of the cross sections before and after the background subtraction, for the 1∘–2∘ angular bin, is shown in Fig. 3. The top panel shows the full spectrum (target windows plus krypton) and the background model using the optimized parameters for energy loss and energy smearing within the target. The bottom panel shows the 86Kr(,3He) spectrum after the subtraction of simulated background. Some systematic uncertainties remain, as evidenced, for example, by the remaining structure near the location of the 12B(1+; g.s.) peak. Based on the optimization process of the background model parameters described above, the systematic uncertainties in the extracted cross sections for the 86Kr(,3He)86Br reaction were estimated. For (86Br) MeV the systematic uncertainties in the cross sections were 25% determine for energy-loss shifts of up to 50 keV. For (86Br) 5 MeV, where the cross sections for the reactions on 12C and 16O are very high compared to the reactions on 86Kr, the systematic uncertainties were too large to obtain sufficiently reliable cross sections for the 86Kr(,3He) reaction. Hence, for the remainder of the analysis, only the data for (86Br) MeV were analyzed.
By using the newly subtracted cross sections, angular distributions were extracted from the data and a multipole decomposition analysis (MDA) was performed Bonin et al. 1984; Ichimura et al. 2006; Scott et al. 2014. Through this method, the Gamow-Teller component () was extracted from the cross section. The angular distribution for each 0.5-MeV wide excitation-energy bin from 0 MeV up to 5 MeV in 86Br was fitted with a linear combination of angular distributions associated with monopole (), dipole () and quadrupole () transitions. The components were calculated using the distorted-wave Born-approximation (DWBA) code FOLD Cook and Carr, in which the Love-Franey -interaction at 140 MeV/ Franey and Love 1985 was double-folded over the transition densities of the 86Kr-86Br and -3He systems. One-body transitions densities for the transitions were obtained from a shell-model calculation using the NUSHELLX code Brown et al. 2004 in the SNE model space Lipoglavšek et al. 2002 using the jj44pna interaction Lisetskiy et al. 2004 (for details, see below). One-body transition densities for the component were obtained from a normal-modes calculation Hofstee et al. 1995, using the NORMOD code S. Y. van der Werf. Transition densities for and 3He particles were taken from variational Monte Carlo calculations Pieper and Wiringa 2001. The optical potential used for the DWBA calculation was from elastic 3He scattering on 90Zr Kamiya et al. 2003 for the outgoing 3He channel. For the incoming triton channel, the real and imaginary potential depths were scaled to 85% of the values for 3He, following Ref. Werf et al. 1989. Although transitions associated with angular-momentum transfers can contribute to the spectra, they are expected to be small for the small momentum transfers considered here and have angular distributions at forward scattering angles that are similar to the angular distribution for transitions and thus not included as separate components.

The results of the MDA are shown in Fig. 4 for each of the 0.5-MeV wide excitation-energy bins below (86Br) 5 MeV. Some of the distributions, such as the 0 to 0.5 MeV bin, show an angular distribution that is dominated by dipole strength, whereas other bins, such as the 2.0 to 2.5 MeV bin, illustrate the case in which there could be a larger component. Due to the large error bars on the experimental data, which include both statistical and systematic contributions, the uncertainties in the MDA fitting parameters for each component were also large. As such, the extraction of the Gamow-Teller strength from the MDA results also carried relatively large uncertainties.
As mentioned above, there is a well-known proportionality between the cross section at zero momentum transfer () and the Gamow-Teller strength, given by the following expression Taddeucci et al. 1987; Zegers et al. 2006; Zegers et al. 2007; Perdikakis et al. 2011:
| (2) |
In this equation, refers to the component of the cross section, extrapolated to zero momentum transfer, and is the unit cross section, calculated using the empirical expression mb/sr, where is the mass number of the target nucleus Zegers et al. 2007; Taddeucci et al. 1987; Scott et al. 2014; Sasano et al. 2009; Grewe et al. 2008. Following these references, to obtain the cross sections at , the extracted cross sections at from the MDA at finite reaction values were extrapolated to MeV by using the DWBA calculations. The extracted Gamow-Teller strength distribution is shown in Fig. 5. Because of the uncertainties associated with the analysis, it is only possible to provide an upper limit on the extracted Gamow-Teller strength, as the error bars on the values are consistent with zero strength. More detailed constraints will be obtained by analysis of the -ray data and will be discussed in Sec. III.3.

III.3 Coincidence Analysis
In an effort to improve the constraints on the Gamow-Teller strength from 86Kr, the S800-GRETINA coincidence data were used. The decay spectrum of 86Br, the residual nucleus of the 86Kr(,3He) reaction, is partially known, though spin and parity assignments for some levels are not available or tentatively assigned Negret and Singh 2015; Urban et al. 2016. Excited states at 2447 keV, 2665 keV, 3226 keV, and 3365 keV were (tentatively) identified as states (the threshold for decay by neutron emission is at 5.128 MeV). However, no -ray peaks associated with de-excitations from those states were observed in the present data, even though the detection efficiency is still relatively high for such energies and photons with energies of up to 8 MeV have clearly been identified in a previous similar experiment (see Fig. 3 of Ref. Noji et al. 2014). It can be concluded that although these states are populated in the decay of 86Se, they are not populated significantly in the direction. Observed lines from nuclei in the target windows (in the region of interest from 14C and 16N), were eliminated from further analysis. Some known lines from 86Br were observed, as well as a number of lines previously not observed for 86Br. Table 1 lists the rays that originated from 86Br, along with their spin-parity assignments where available from previous experiments. For energies below 500 keV, it was not always possible to distinguish a small peak from background due to Compton scattering of more energetic rays that deposit less than their full energy in the detector. For example, a small peak at 191 keV was observed that could correspond to a known decay Urban et al. 2016 and included in Table 1. However, as discussed below, no corresponding clear peak in the 86Kr(,3He) spectrum was found and this peak could be due to a statistical fluctuation. Other similarly weak peaks that were difficult to separate from background, and for which no known lines exist, were excluded from further analysis and not included in Table 1 if no clear peak in the 86Kr(,3He) spectrum was found.
| 11 1 The uncertainty is approximately 0.3 MeV | Transition | ||
|---|---|---|---|
| (keV) | from Negret and Singh 2015; Urban et al. 2016 | (MeV) | (tentative) |
| 77 | 4- | 0.2 | |
| 19122 2 The signal for this peak was weak compared to background in the present data and the observation is uncertain (see text) | 4- | - | - |
| 207 | 2- | peak 1: 3.1 | |
| peak 2: 3.6 | |||
| 382 | 2- | 2.6 | |
| 932 | unknown | peak 1: 0.9 | |
| peak 2: 2.3 | |||
| 942 | unknown | 1.7 | |
| 1427 | unknown | 2.3 | |
| 1753 | unknown | 1.7 | |
| 2361 | unknown33 3 In Ref. Urban et al. 2016, a line was reported at 2362 keV. However, it was associated with the decay from a state at 2797 keV, which is unlikely to be consistent with the observation of a peak at 2.4 MeV in the 86Kr(,3He) spectrum. On the basis of this information only, one cannot rule out that both states contribute to the excitation-energy and spectra. However, several other lines associated with the decay from the state at 2797 keV observed in Ref. Urban et al. 2016 are not seen here, but should have been if the 2361 keV line belonged to the decay of the state at 2797 keV. We conclude that the 2361-keV line observed here is distinct from the 2362-keV line of Ref. Urban et al. 2016. | 2.4 |
By placing a 5 keV gate around each of the 86Br lines, and examining the 86Br excitation-energy spectrum, it was possible to identify specific states in 86Br that produced the ray. The spectra for each line identified to come from 86Br, and the associated 86Kr(,3He) excitation-energy spectra gated on that line, are shown in Fig. 6. The peaks in the 86Br excitation-energy spectra thus identified for each ray are listed in the third column of Table 1. If the peak in the excitation-energy spectrum appears at (approximately) the same energy as the ray, it is indicative of a decay directly to the ground state, or to a low-lying state in 86Br. Conversely, for the cases in which the peak in the excitation-energy spectrum is greater than the energy, the decay must have proceeded through a decay chain.


Aside from the possible 191-keV line discussed above, three other known lines from the decay of 86Br were identified in the -energy spectrum below 500 keV, at 77 keV, 207 keV, and 382 keV. By gating on these lines, the excitation-energy spectra in 86Br, determined from the (,3He) data were created, as shown on the right-hand side in Figs. 6(a), 6(b) and 6(c). Although the statistics are limited, peaks in these spectra can be observed that belong to excitations whose decay is associated with the corresponding lines. For example, in the excitation-energy spectrum gated on the 77-keV line, a low-lying peak at (86Br) MeV is found (indicated by the arrow), likely due to the de-excitation of a low-lying state. In addition, some distributed events at higher excitation energy are found, either due to higher-lying excitations that decay through the 77-keV line, or that are associated with background from Compton scattering of more energetic lines in GRETINA that appear under the 77-keV line, as discussed above.
The same procedure was followed for all lines that were determined to come from 86Br, as shown in Figs. 6(a-h). For lines above keV, the excitation-energy spectra obtained are relatively clean, as the Compton background from more energetic lines is small. The extracted peaks are listed, per line, in the third column of Table 1, and indicated with arrows in the figures. The uncertainty in these excitation energies is approximately 0.3 MeV. Subsequently, a gate with a width of 1.5 MeV was made around each of the peaks marked by arrows in Fig. 6 and listed in Table 1, and the differential cross sections were extracted and an MDA was performed. In this analysis, each peak was assumed to have a particular spin-assignment, i.e. to be due to the excitation of a single state. Hence, each peak was associated with a combination of and components (for a 1+ state), a component (for 0-, 1- or 2- excitations), or or higher, for quadrupole and higher multipole excitations. However, due to the limited statistics, it was only possible to make tentative assignments.

Three examples of this MDA are shown in Fig. 7, and the extracted angular momentum transfers determined for each peak are listed in the fourth column of Table 1. In Fig. 7a, the angular distribution associated with the line of 1427 keV and (86Br) 2.3 MeV is shown. This angular distribution is best described by a transition. For two peaks, at (86Br) 1.7 MeV (associated with a 1753 keV line) and at (86Br) 2.4 MeV (associated with a 2361 keV line), the differential cross section peaked at forward scattering angles, as shown in Figs. 7(b) and 7(c), respectively. Although the statistical uncertainties are large, the associated transitions could be due to Gamow-Teller excitations. Following the procedure from Sec. III.2, and accounting for the detection efficiency, the Gamow-Teller strengths associated with the 1.7 MeV and 2.4 MeV states were extracted: 0.045 for the 1.7-MeV state and 0.063 for the 2.4-MeV state. Since it cannot be ruled out that these transitions are not due to Gamow-Teller excitations, the lower error bars extend to . However, the results from this -ray analysis (also shown in Fig. 5) provide more detailed constraints on the Gamow-Teller strength from 86Kr to 86Br for excitation energies below 5 MeV. Finally, since the summed energy of the 932 keV and 1427 keV lines (2359 keV) is close to 2361 keV (given the energy resolution of GRETINA of 2.2 keV for keV Paschalis et al. 2013), and all three lines are associated with an excited state at about 2.3 MeV, we cannot rule out that these come from the same excited state. If true, it is unlikely that this state can be assigned to a spin-parity of , as the center-of-mass 3He angular distribution associated with the 1427 keV line is quite clearly not of monopole character. Given the statistical limitations, it was not possible to perform a - correlation analysis to study this possibility in more detail.
III.4 Comparison to Theory
It is informative to compare the extracted experimental results with theoretical models that could be used to calculate Gamow-Teller strengths for the purpose of estimating electron-capture rates for astrophysical simulations. Therefore, as part of this work, two calculations were performed. The first calculation is a shell-model calculation, which was performed with the NUSHELLX code Brown et al. 2004, using the jj44pna effective interaction Lisetskiy et al. 2004 in the SNE model space Lipoglavšek et al. 2002; Brown and Rykaczewski 1994, and a renormalized G-matrix using the charge-dependent (CD-Bonn) nucleon-nucleon interaction Dillmann et al. 2003. This model space and interaction assume an inert 78Ni core, on top of which protons can populate the , , , and orbitals, and neutrons can populate the , , , and orbitals. Because of the restrictions of the model space, Gamow-Teller excitations must be associated with transitions.
For this simple model space, the total Gamow-Teller strength can be estimated Towner 1985 as 0, where is the single-particle strength for the transition, and 0 is the occupation number for protons in the 0 orbital. The calculated occupation number for 86Kr is 0.40, resulting in a total Gamow-Teller strength of 0.71, of which 0.16 was estimated to reside at (86Br) MeV, and the remainder distributed over many weak transitions up to high excitation energies. The occupation number determined from experiment for 86Kr is uncertain; Ref. Pfeiffer et al. 1986 does not report any strength in the 86Kr to 85Br reaction, while Ref. May and Lewis 1972 reports tentative strength in a state at MeV with a deduced occupation of 1.12. We note that proton 0 occupation numbers for 90Zr and 88Sr of 1.0 and 0.7 were reported, respectively Pfeiffer et al. 1986, suggesting the calculated value of 0.40 in the shell model for 86Kr is not unreasonable.
It is necessary to take into account the consequences of model-space truncation; in Ref. Towner 1985, this is divided into two parts that are expressed in terms of hindrance factors and . is associated with configurations beyond the (, , ) model space, which corresponds to the admixtures of two-particle two-hole states with unperturbed energies of and higher in the oscillator basis. Such behavior has been extensively studied in lighter nuclei; for the (, ) model space, the empirical value of is 1.67 Brown and Wildenthal 1985, which qualitatively agrees with calculations that include the admixture. For the (, ) model space, the empirical value for is 1.81(1) Martínez-Pinedo et al. 1996. The latter is assumed here, because it is consistent with the value observed for heavier nuclei Gaarde 1985. The factor (where c.p. stands for core polarization) is introduced for the truncation from (, , ) to the model space used in the calculations for this work. In particular, the 0 orbital is assumed to be filled and the 0 is assumed to be empty. takes into account the mixing between the 0 and 0 spin-orbit partners, and in Ref. Towner 1985, the calculated associated hindrance factor for the (0)n configurations. With these hindrance factors, and , the Gamow-Teller strength can be written in the following form:
| (3) |
The hindrances observed in the decay of nuclei from 94Ru to 98Cd are consistent with the calculations in Ref. Towner 1985, which are based on Eq. (3) Brown and Rykaczewski 1994. In this work, , from the result of the (0)2 configuration in Table 5 of Ref. Towner 1985. It assumed that this can be applied to the calculations of 86Kr. Hence, the total hindrance factor , which was applied to the shell-model calculations.
The second theoretical calculation is a quasiparticle random-phase approximation (QRPA) calculation. It was performed using the axially-deformed Skyrme Finite Amplitude Method (FAM) Avogadro and Nakatsukasa 2011; Mustonen et al. 2014. This method has recently been extended to odd- nuclei in the equal filling approximation Shafer et al. 2016, making it a candidate for calculating Gamow-Teller strengths and electron-capture rates for all nuclei in the high-sensitivity region. The Skyrme functional and single-particle space are the same as those used in Ref. Mustonen and Engel 2016, in which a single set of parameters, including an effective axial-coupling constant, , of 1.0, were fixed. The width of the states in the QRPA calculation was set to 0.25 MeV.
For both of the theoretical models, the first peak in the strength distribution was placed at the excitation energy of the first known state in 86Br, 2.446 MeV. The results for both sets of calculations are included in Fig. 5. Both the shell-model and QRPA calculations yield comparable amounts of Gamow-Teller strength up to (86Br) MeV: 0.035 for the shell-model calculation and 0.024 for the QRPA calculation. The total strength obtained from the 86Kr(,3He+) coincidence data is 0.108. Although the experimental error bars are large, these data set an upper limit on the summed Gamow-Teller strength, with which the theory is consistent.
IV Electron-Capture Rates
IV.1 Calculation of Electron-Capture Rates
Using the Gamow-Teller strength distributions calculated in Secs. III.2 and III.3, electron-capture rates were calculated for a wide range of stellar densities and temperatures of relevance for astrophysical phenomena. These calculations were performed using the ECRATES code Reyes et al. 2010; Timmes and Swesty 2000; Valdez 2012, which takes the reaction values and the Gamow-Teller strengths as inputs.
Electron-capture rates are calculated using the following expression:
| (4) |
is the Gamow-Teller strength distribution, derived either from experimental data or theoretical calculations, and is the phase-space factor, which depends on the stellar density, , temperature, , and chemical potential, . It is informative to examine these two components of the electron-capture rates. The Gamow-Teller strength distribution for 86Kr as a function of value, as obtained from the QRPA calculation is shown in the middle panel of Fig. 8. The first peak in the Gamow-Teller distribution as a function of value corresponds to the peak of the QRPA calculation shown in the Gamow-Teller strength distribution of Fig. 5 as a function of excitation energy. The phase-space factor, normalized to unity at , is shown in the top panel of Fig. 8 as a function of value, for a range of stellar densities from 109 to 1012 g/cm3. By multiplying the phase-space factor by the Gamow-Teller strength and then summing over the entire distribution, the total electron-capture rate for the nucleus is produced. The bottom panel of Fig. 8 shows the summed fraction to the total electron-capture rate as a function of value.
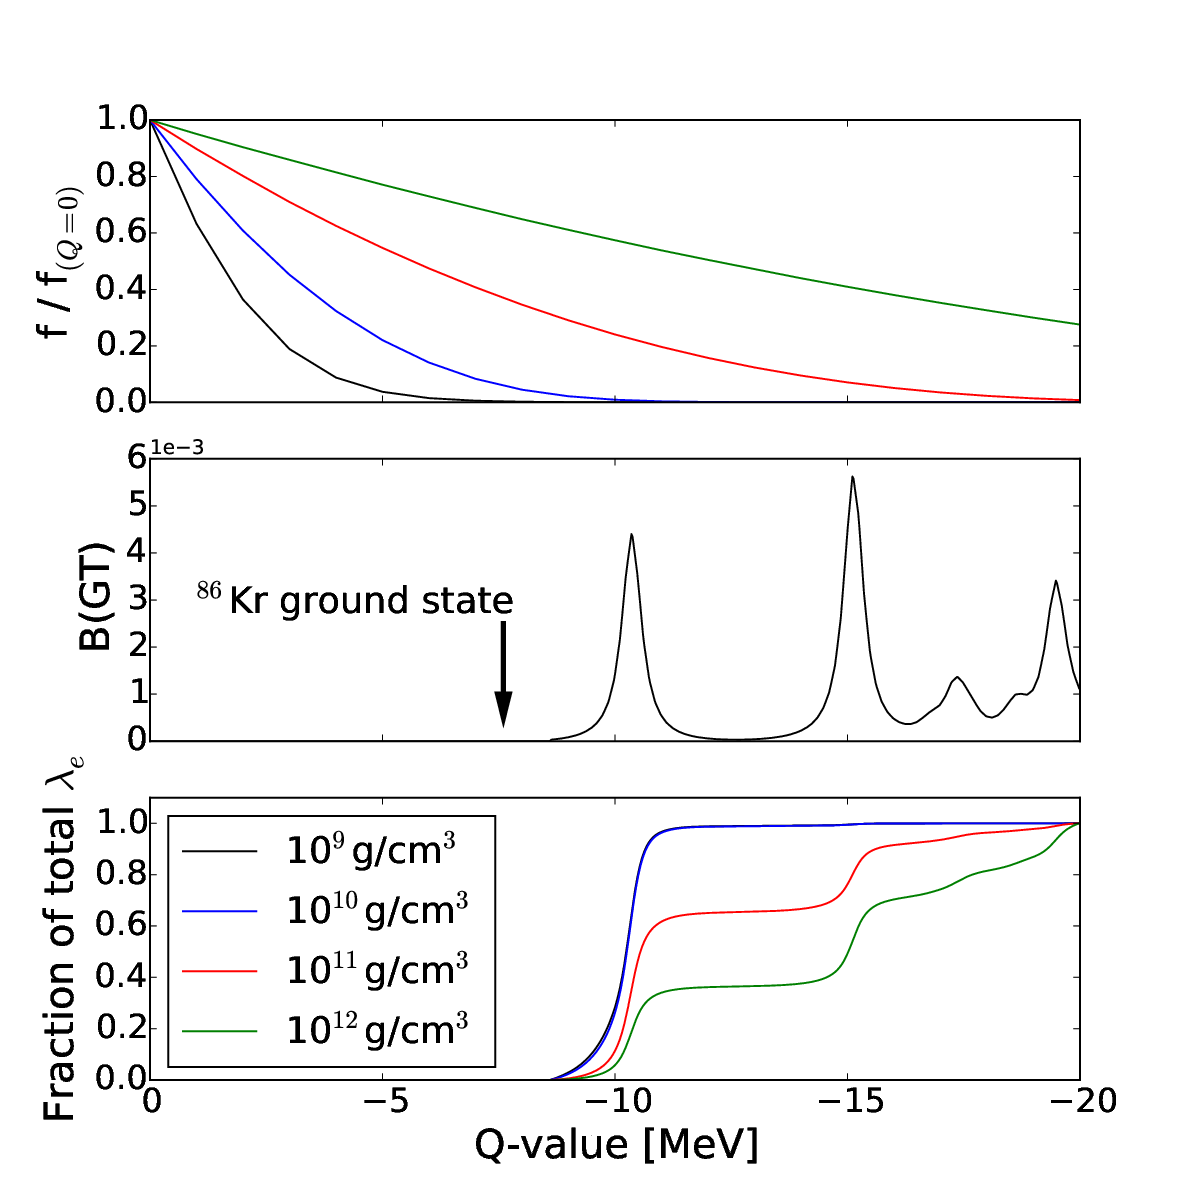
At relatively low stellar densities, the phase-space factor drops quickly with decreasing , with the consequence that Gamow-Teller transitions to states at less negative dominate the electron-capture rate. As the density increases, the phase-space factor drops off more slowly with decreasing , and Gamow-Teller transitions to states at more negative start to contribute to the electron-capture rate, as becomes clear from the bottom panel of Fig. 8. Even at densities in excess of g/cm3, the contribution from the transition to the lowest state is still the strongest single contribution to the rate. This is because the threshold electron-capture value for the case of 86Kr is rather negative (-7.607 MeV), and the first Gamow-Teller transition only appears at MeV. The situation for 86Kr described in Fig. 8 is exemplary for the neutron-rich nuclei in the region. Due to the relatively large, negative -values for electron-capture on these nuclei, the details of the Gamow-Teller strength distributions, including the location of the lowest-lying 1+ state, are important for estimating accurate electron-capture rates, even at relatively high densities.

The results of the electron-capture rate calculations for this work are shown in Fig. 9, at a temperature of 10 GK, and for densities of relevance for the collapse phase of core-collapse supernovae. The black solid line represents the electron-capture rates that are calculated from the Gamow-Teller strength extracted from the -ray analysis in Sec. III.3. Since this rate represents an upper limit for 5 MeV, the uncertainty band (in grey) extends down to zero. It is important to note that, because it was only possible to extract Gamow-Teller strength up to MeV, transitions to states at higher excitation energies are not included in the electron-capture rate calculations derived from the data. However, as explained above, the contributions from these states to the overall rate are expected to be relatively small at the lower end of the density scale presented here and slowly increase at higher excitation energies. Also shown in Fig. 9 are the rates determined from the theoretical strength distributions described above, and the single-state approximation presently implemented in NuLib Fuller et al. 1985; Langanke et al. 2003; Raduta et al. 2017. For the latter, was 2.5 MeV for the case of 86Kr.
The electron-capture rates derived from the shell-model and QRPA calculations are consistent with the experimental result, as they both fall within the experimental uncertainties. Conversely, the rates obtained by the single-state approximation are much higher, exceeding the electron-capture rates estimated based on the data by about two orders of magnitude. At high stellar temperatures, Pauli unblocking effects will increase the electron-capture rates Langanke et al. 2001, but in cases such as 86Kr, where Pauli blocking is not complete at zero temperature, such increases are likely small Langanke et al. 2001. The placement of a single state at one fixed excitation energy of 2.5 MeV with a Gamow-Teller strength of 4.6 is inconsistent with the present data. If a single-state approximation were to be used to represent the present experimental results, a Gamow-Teller strength of less than 0.03 or an excitation energy in excess of 20 MeV would be required. Microscopic models are needed to more accurately estimate electron-capture rates for astrophysical simulations. These models can be tested at zero temperature against available experimental data. We note that a similar conclusion was drawn on the basis of a recent 88Sr(,3He) experiment jua 2019.
IV.2 New Rate Table
Because of the importance of the region of nuclei surrounding the shell closure, a new electron-capture rate table was developed for the use in astrophysical simulations that contained, for 78 nuclei in and around the high-sensitivity region Titus et al. 2018, rates calculated on the basis of the QRPA framework described in Sec. III.4. QRPA calculations were chosen over shell-model calculations in this case because calculations were needed for a large number of nuclei both above and below the shell closure. In addition, these QRPA calculations can be extended in the future to include temperature-dependent effects.
The nuclei included were 75-76Fe, 75-78Co, 75-80Ni, 75-82Cu, 75-84Zn, 75-85Ga, 76-85Ge, 75-85As, 80-85Se, 82-85Br, 84-86Kr, 88Sr, 90Zr, and 93Nb. The ground-state value was obtained from experimental data where available, and from the Hartree-Fock-Bogoliubov solution according to the approximation in Ref. Engel et al. 1999 for nuclei lacking experimental data. Additionally, the spin and parity of the ground states of the relevant nuclei were obtained from experimental assignments, and from the Gallagher and Moszkowski rule Gallagher and Moszkowski 1958, for nuclei lacking definite assignments. Although these calculations do not yet contain temperature-dependent effects that might increase the electron-capture rates, these simulations provide important insights in the maximum effects that can be caused by the overestimation of the electron-capture rates in the single-state approximation.
V Core-Collapse Supernova Simulations
The core-collapse supernova simulations for this work were performed using the neutrino-transport code, NuLib O’Connor 2015, and the general-relativistic, spherically-symmetric hydrodynamics code, GR1D O’Connor and Ott 2010; O’Connor 2015. The progenitor used in the simulations was a well-known 15 solar-mass, solar-metallicity star (s15WW95) Woosley and Weaver 1995. The SFHo equation of state and nuclear statistical equilibrium distributions were used Steiner et al. 2013. The goal of this study was to determine the effect of the newly calculated rate table on the late-stage evolution of the collapsing star. As such, two simulations were performed: the first was a base simulation in which the electron-capture rates were calculated based on the single-state approximation Fuller et al. 1985; Langanke et al. 2003; Raduta et al. 2017. The second simulation used the new rate table based on the QRPA calculations.

A comparison of the lepton fraction () as a function of central density () for these two cases is shown in Fig. 10. For densities of 1010 to 1012 g/cm3, strong deleptonization of the matter in the core of the star occurs. The opacity of the matter is relatively low, which allows electron neutrinos to escape the star. At a density of 1012 g/cm3, the neutrinos become trapped, preventing further deleptonization and causing the lepton fraction to saturate.
Comparing the results of the base simulation with the simulation in which the new QRPA rates were included, it is clear that the new rates strongly affected the final lepton fraction. The original simulation attains a final lepton fraction of 0.294, while the simulation including the new rates reaches a final lepton fraction of 0.312. This constitutes a 14% reduction in the decrease of the lepton fraction with the addition of the new, more accurate rates. Also shown in Fig. 10 are the results of a simulation from a previous sensitivity study Titus et al. 2018, which illustrates the case in which the electron-capture rates for the nuclei in the high-sensitivity region calculated with the single-state approximate method, were scaled by a factor of 0.01. This result is comparable to the simulation that uses the new QRPA rates. Because of this similarity, the consequences of using the QRPA-derived electron-capture rates in the high-sensitivity region are comparable to those discussed in detail in Ref. Titus et al. 2018, and will strongly impact physical observables, such as the peak neutrino luminosity Sullivan et al. 2016 and the frequency of gravitational waves emitted from the collapsing star Richers et al. 2017, which are both potential multimessenger signals that can be used to better understand and model core-collapse supernovae.
VI Conclusions
In an effort to constrain the electron-capture rates on nuclei near above 78Ni, which play an important role in the late-stage evolution of core-collpase supernovae, the 86Kr(,3He) reaction at 115 MeV was investigated. Due to the need to subtract events from reactions on foils that maintained the 86Kr gas target, the uncertainties in the extracted strengths are larger than has been achieved in other (,3He) experiments at NSCL. Still, an upper limit for the Gamow-Teller strengths for MeV could be obtained, which was strengthened through the investigation of the -decay spectra. Theoretical Gamow-Teller strength calculations by using the shell model and QRPA were consistent with the experimental upper limit.
The stellar electron-capture rate on 86Kr derived from the upper limit of the extracted Gamow-Teller strength was used to test a single-state approximation used in astrophysical simulations, as well as electron-capture rates derived from the Gamow-Teller strengths calculated in the shell-model and QRPA. The electron-capture rates based on the single-state approximation are too high compared to the rates based on the experimental data, whereas those based on the microscopic calculations are consistent. Although at high stellar temperatures Pauli unblocking can increase the electron capture rates as compared to the rates extracted and calculated at zero temperature, the effect is likely significantly smaller than the difference between the experimental upper limit and the rate based on the single-state approximation, assuming that the protons partially fill the 0 orbit and Gamow-Teller transitions are not completely Pauli blocked, even at zero temperature.
Based on these results, simulations of the late stages of the evolution of core-collapse supernovae were performed that utilized a new set of rates for nuclei in the high-sensitivity region near based on Gamow-Teller strengths from QRPA calculations tested in these experiments. The results indicate that the reduced electron-capture rates in the high-sensitivity region strongly affects the deleptonization during the collapse phase, with significant consequences for the late evolution and potentially observable neutrino and gravitation-wave multi-messenger signals, as discussed in detail in Ref. Titus et al. 2018. These simulations will benefit from further theoretical work to improve the electron-capture rates on nuclei of relevance for late stellar evolution, in particular by including temperature-dependent effects in the QRPA calculations. Finally, the development of techniques to measure the Gamow-Teller strengths on unstable nuclei will be important to test the theoretical calculations in the high-sensitivity region. Such developments are being pursued at NSCL through the use of the (,2He) and (7Li,7Be) reactions in inverse kinematics.
VII Acknowledgments
We thank the NSCL staff for their support during the preparations for and conducting of the experiment. J.C.Z. thanks the support by Fundaço de Amparo a Pesquisa do Estado de So Paulo (FAPESP) under Grant No. 2018/04965-4.
This work was supported by the US National Science Foundation (NSF) under Cooperative Agreement PHY-156554 (NSCL), PHY-1430152 (JINA Center for the Evolution of the Elements), and PHY-1811855. GRETINA was funded by the US Department of Energy, in the Office of Nuclear Physics of the Office of Science. Operation of the array at NSCL was supported by DOE under Grants No. DE-SC0014537 (NSCL) and No. DE-AC02-05CH11231 (LBNL).
References
- Fryer (1999) C. L. Fryer, Astrophys. J. 522, 413 (1999).
- Heger et al. (2003) A. Heger, C. L. Fryer, S. E. Woosley, N. Langer, and D. H. Hartmann, Astrophys. J. 591, 288 (2003).
- Janka et al. (2007) H.-T. Janka, K. Langanke, A. Marek, G. Martínez-Pinedo, and B. Müller, Phys. Rep. 442, 38 (2007).
- Janka et al. (2012) H.-T. Janka, F. Hanke, L. Hüdepohl, A. Marek, B. Müller, and M. Obergaulinger, Progress of Theoretical and Experimental Physics 2012 (2012).
- Burrows (2013) A. Burrows, Rev. Mod. Phys. 85, 245 (2013).
- Langanke and Martínez-Pinedo (2003) K. Langanke and G. Martínez-Pinedo, Rev. Mod. Phys. 75, 819 (2003).
- Richers et al. (2017) S. Richers, C. D. Ott, E. Abdikamalov, E. O’Connor, and C. Sullivan, Phys. Rev. D 95, 063019 (2017).
- Hix et al. (2003) W. R. Hix, O. E. B. Messer, A. Mezzacappa, M. Liebendörfer, J. Sampaio, K. Langanke, D. J. Dean, and G. Martínez-Pinedo, Phys. Rev. Lett. 91, 201102 (2003).
- Bethe et al. (1979) H. Bethe, G. Brown, J. Applegate, and J. Lattimer, Nucl. Phys. A 324, 487 (1979).
- Langanke et al. (2003) K. Langanke, G. Martínez-Pinedo, J. M. Sampaio, D. J. Dean, W. R. Hix, O. E. B. Messer, A. Mezzacappa, M. Liebendörfer, H.-T. Janka, and M. Rampp, Phys. Rev. Lett. 90, 241102 (2003).
- Sullivan et al. (2016) C. Sullivan, E. O’Connor, R. G. T. Zegers, T. Grubb, and S. M. Austin, Astrophys. J. 816, 44 (2016).
- Titus et al. (2018) R. Titus, C. Sullivan, R. G. T. Zegers, B. A. Brown, and B. Gao, J. Phys. G 45, 014004 (2018).
- Furusawa et al. (2017) S. Furusawa, H. Nagakura, K. Sumiyoshi, C. Kato, and S. Yamada, Phys. Rev. C 95, 025809 (2017).
- Pascal et al. (2019) A. Pascal, S. Giraud, A. Fantina, F. Gulminelli, J. Novak, M. Oertel, and A. Raduta, “Impact of electron capture rates on nuclei far from stability on core-collapse supernovae,” (2019), arXiv:1906.05114 .
- Taddeucci et al. (1987) T. Taddeucci, C. Goulding, T. Carey, R. Byrd, C. Goodman, C. Gaarde, J. Larsen, D. Horen, J. Rapaport, and E. Sugarbaker, Nucl. Phys. A 469, 125 (1987).
- Zegers et al. (2006) R. G. T. Zegers, H. Akimune, S. M. Austin, D. Bazin, A. M. van den Berg, G. P. A. Berg, B. A. Brown, J. Brown, A. L. Cole, I. Daito, Y. Fujita, M. Fujiwara, S. Galès, M. N. Harakeh, H. Hashimoto, R. Hayami, G. W. Hitt, M. E. Howard, M. Itoh, J. Jänecke, T. Kawabata, K. Kawase, M. Kinoshita, T. Nakamura, K. Nakanishi, S. Nakayama, S. Okumura, W. A. Richter, D. A. Roberts, B. M. Sherrill, Y. Shimbara, M. Steiner, M. Uchida, H. Ueno, T. Yamagata, and M. Yosoi, Phys. Rev. C 74, 024309 (2006).
- Zegers et al. (2007) R. G. T. Zegers, T. Adachi, H. Akimune, S. M. Austin, A. M. van den Berg, B. A. Brown, Y. Fujita, M. Fujiwara, S. Galès, C. J. Guess, M. N. Harakeh, H. Hashimoto, K. Hatanaka, R. Hayami, G. W. Hitt, M. E. Howard, M. Itoh, T. Kawabata, K. Kawase, M. Kinoshita, M. Matsubara, K. Nakanishi, S. Nakayama, S. Okumura, T. Ohta, Y. Sakemi, Y. Shimbara, Y. Shimizu, C. Scholl, C. Simenel, Y. Tameshige, A. Tamii, M. Uchida, T. Yamagata, and M. Yosoi, Phys. Rev. Lett. 99, 202501 (2007).
- Langanke and Martínez-Pinedo (2000) K. Langanke and G. Martínez-Pinedo, Nucl. Phys. A 673, 481 (2000).
- Langanke et al. (2001) K. Langanke, E. Kolbe, and D. J. Dean, Phys. Rev. C 63, 032801(R) (2001).
- O’Connor (2015) E. O’Connor, Astrophys. J. Supp. 219, 24 (2015).
- Sullivan (2015) C. Sullivan, Zenodo (2015), http://doi.org/10.5281/zenodo.33788.
- O’Connor and Ott (2010) E. O’Connor and C. D. Ott, Classical and Quantum Gravity 27, 114103 (2010).
- Fuller et al. (1982) G. M. Fuller, W. A. Fowler, and M. J. Newman, Astrophys. J. 252, 715 (1982).
- Oda et al. (1994) T. Oda, M. Hino, K. Muto, M. Takahara, and K. Sato, At. Data Nucl. Data Tables 56, 231 (1994).
- Langanke and Martínez-Pinedo (2001) K. Langanke and G. Martínez-Pinedo, At. Data Nucl. Data Tables 79, 146 (2001).
- Pruet and Fuller (2003) J. Pruet and G. M. Fuller, Astrophys. J. Supp. 149, 189 (2003).
- Suzuki et al. (2016) T. Suzuki, H. Toki, and K. Nomoto, Astrophys. J. 817, 163 (2016).
- Cole et al. (2012) A. L. Cole, T. S. Anderson, R. G. T. Zegers, S. M. Austin, B. A. Brown, L. Valdez, S. Gupta, G. W. Hitt, and O. Fawwaz, Phys. Rev. C 86, 015809 (2012).
- Raduta et al. (2017) A. R. Raduta, F. Gulminelli, and M. Oertel, Phys. Rev. C 95, 025805 (2017).
- jua (2019) “Experimental constraint on stellar electron-capture rates from the 88Sr(,3He+)88Rb reaction at 115 MeV/,” (2019), arXiv:1906.05934 .
- Morrissey et al. (2003) D. Morrissey, B. Sherrill, M. Steiner, A. Stolz, and I. Wiedenhoever, Nucl. Instr. Meth. Phys. Res. B 204, 90 (2003).
- Hitt et al. (2006) G. W. Hitt, S. M. Austin, D. Bazin, A. L. Cole, J. Dietrich, A. Gade, M. E. Howard, S. D. Reitzner, B. M. Sherrill, C. Simenel, E. E. Smith, J. Stetson, A. Stolz, and R. G. T. Zegers, Nucl. Instr. Meth. Phys. Res. A 566, 264 (2006).
- Palardy et al. (2010) J. Palardy, N. Ferrante, L. Riley, and R. G. T. Zegers, Bulletin of the American Physical Society DNP, EA.38 (2010).
- Bazin et al. (2003) D. Bazin, J. Caggiano, B. Sherrill, J. Yurkon, and A. Zeller, Nucl. Instr. Meth. Phys. Res. B 204, 629 (2003).
- Fujita et al. (2002) H. Fujita, Y. Fujita, G. P. A. Berg, A. D. Bacher, C. C. Foster, K. Hara, K. Hatanaka, T. Kawabata, T. Noro, H. Sakaguchi, Y. Shimbara, T. Shinada, E. J. Stephenson, H. Ueno, and M. Yosoi, Nucl. Instr. Meth. Phys. Res. A 484, 17 (2002).
- Yurkon et al. (1999) J. Yurkon, D. Bazin, W. Benenson, D. J. Morrissey, B. M. Sherrill, D. Swan, and R. Swanson, Nucl. Instr. Meth. Phys. Res. A 422, 291 (1999).
- Makino and Berz (1999) K. Makino and M. Berz, Nucl. Instr. Meth. Phys. Res. A 427, 338 (1999).
- Paschalis et al. (2013) S. Paschalis, I. Lee, A. Macchiavelli, C. Campbell, M. Cromaz, S. Gros, J. Pavan, J. Qian, R. Clark, H. Crawford, D. Doering, P. Fallon, C. Lionberger, T. Loew, M. Petri, T. Stezelberger, S. Zimmermann, D. Radford, K. Lagergren, D. Weisshaar, R. Winkler, T. Glasmacher, J. Anderson, and C. Beausang, Nucl. Instr. Meth. Phys. Res. A 709, 44 (2013).
- Weisshaar et al. (2017) D. Weisshaar, D. Bazin, P. Bender, C. Campbell, F. Recchia, V. Bader, T. Baugher, J. Belarge, M. Carpenter, H. Crawford, M. Cromaz, B. Elman, P. Fallon, A. Forney, A. Gade, J. Harker, N. Kobayashi, C. Langer, T. Lauritsen, I. Lee, A. Lemasson, B. Longfellow, E. Lunderberg, A. Macchiavelli, K. Miki, S. Momiyama, S. Noji, D. Radford, M. Scott, J. Sethi, S. Stroberg, C. Sullivan, R. Titus, A. Wiens, S. Williams, K. Wimmer, and S. Zhu, Nucl. Instr. Meth. Phys. Res. A 847, 187 (2017).
- Noji et al. (2015) S. Noji, R. G. T. Zegers, S. M. Austin, T. Baugher, D. Bazin, B. A. Brown, C. M. Campbell, A. L. Cole, H. J. Doster, A. Gade, C. J. Guess, S. Gupta, G. W. Hitt, C. Langer, S. Lipschutz, E. Lunderberg, R. Meharchand, Z. Meisel, G. Perdikakis, J. Pereira, F. Recchia, H. Schatz, M. Scott, S. R. Stroberg, C. Sullivan, L. Valdez, C. Walz, D. Weisshaar, S. J. Williams, and K. Wimmer, Phys. Rev. C 92, 024312 (2015).
- Noji et al. (2014) S. Noji, R. G. T. Zegers, S. M. Austin, T. Baugher, D. Bazin, B. A. Brown, C. M. Campbell, A. L. Cole, H. J. Doster, A. Gade, C. J. Guess, S. Gupta, G. W. Hitt, C. Langer, S. Lipschutz, E. Lunderberg, R. Meharchand, Z. Meisel, G. Perdikakis, J. Pereira, F. Recchia, H. Schatz, M. Scott, S. R. Stroberg, C. Sullivan, L. Valdez, C. Walz, D. Weisshaar, S. J. Williams, and K. Wimmer, Phys. Rev. Lett. 112, 252501 (2014).
- Scott et al. (2014) M. Scott, Y. Shimbara, S. M. Austin, D. Bazin, B. A. Brown, J. M. Deaven, Y. Fujita, C. J. Guess, S. Gupta, G. W. Hitt, D. Koeppe, R. Meharchand, M. Nagashima, G. Perdikakis, A. Prinke, M. Sasano, C. Sullivan, L. Valdez, and R. G. T. Zegers, Phys. Rev. C 90, 025801 (2014).
- Negret et al. (2006) A. Negret, T. Adachi, B. R. Barrett, C. Bäumer, A. M. van den Berg, G. P. A. Berg, P. von Brentano, D. Frekers, D. De Frenne, H. Fujita, K. Fujita, Y. Fujita, E.-W. Grewe, P. Haefner, M. N. Harakeh, K. Hatanaka, K. Heyde, M. Hunyadi, E. Jacobs, and L. Zamick, Phys. Rev. Lett. 97, 062502 (2006).
- Bonin et al. (1984) B. Bonin, N. Alamanos, B. Berthier, G. Bruge, H. Faraggi, D. Legrand, J. Lugol, W. Mittig, L. Papineau, A. Yavin, D. Scott, M. Levine, J. Arvieux, L. Farvacque, and M. Buenerd, Nuclear Physics A 430, 349 (1984).
- Ichimura et al. (2006) M. Ichimura, H. Sakai, and T. Wakasa, Prog. Part. Nucl. Phys. 56, 446 (2006).
- (46) J. Cook and J. A. Carr, “computer program , florida state university (unpublished),” Based on F. Petrovich and D. Stanley, Nucl. Phys. A275, 487 (1977), modified as described in J. Cook et al., Phys. Rev. C 30, 1538 (1984) and R. G. T. Zegers, S. Fracasso and G. Colò (2006), unpublished.
- Franey and Love (1985) M. A. Franey and W. G. Love, Phys. Rev. C 31, 488 (1985).
- Brown et al. (2004) B. A. Brown, W. D. M. Rae, E. McDonald, and M. Horoi, “NuShellX@MSU,” NSCL Report No. MSUCL-1289-2004. (2004).
- Lipoglavšek et al. (2002) M. Lipoglavšek, C. Baktash, M. P. Carpenter, D. J. Dean, T. Engeland, C. Fahlander, M. Hjorth-Jensen, R. V. F. Janssens, A. Likar, J. Nyberg, E. Osnes, S. D. Paul, A. Piechaczek, D. C. Radford, D. Rudolph, D. Seweryniak, D. G. Sarantites, M. Vencelj, and C.-H. Yu, Phys. Rev. C 65, 021302(R) (2002).
- Lisetskiy et al. (2004) A. F. Lisetskiy, B. A. Brown, M. Horoi, and H. Grawe, Phys. Rev. C 70, 044314 (2004).
- Hofstee et al. (1995) M. A. Hofstee, S. Y. van der Werf, A. M. van den Berg, N. Blasi, J. A. Bordewijk, W. T. A. Borghols, R. D. Leo, G. T. Emery, S. Fortier, S. Galès, M. N. Harakeh, P. den Heijer, C. W. de Jager, H. Langevin-Joliot, S. Micheletti, M. Morlet, M. Pignanelli, J. M. Schippers, H. de Vries, A. Willis, and A. van der Woude, Nuclear Physics A 588, 729 (1995).
- (52) S. Y. van der Werf, Computer program NORMOD, unpublished.
- Pieper and Wiringa (2001) S. C. Pieper and R. B. Wiringa, Annual Review of Nuclear and Particle Science 51, 53 (2001).
- Kamiya et al. (2003) J. Kamiya, K. Hatanaka, T. Adachi, K. Fujita, K. Hara, T. Kawabata, T. Noro, H. Sakaguchi, N. Sakamoto, Y. Sakemi, Y. Shimbara, Y. Shimizu, S. Terashima, M. Uchida, T. Wakasa, Y. Yasuda, H. P. Yoshida, and M. Yosoi, Phys. Rev. C 67, 064612 (2003).
- Werf et al. (1989) S. V. D. Werf, S. Brandenburg, P. Grasduk, W. Sterrenburg, M. Harakeh, M. Greenfield, B. Brown, and M. Fujiwara, Nucl. Phys. A 496, 305 (1989).
- Perdikakis et al. (2011) G. Perdikakis, R. G. T. Zegers, S. M. Austin, D. Bazin, C. Caesar, J. M. Deaven, A. Gade, D. Galaviz, G. F. Grinyer, C. J. Guess, C. Herlitzius, G. W. Hitt, M. E. Howard, R. Meharchand, S. Noji, H. Sakai, Y. Shimbara, E. E. Smith, and C. Tur, Phys. Rev. C 83, 054614 (2011).
- Sasano et al. (2009) M. Sasano, H. Sakai, K. Yako, T. Wakasa, S. Asaji, K. Fujita, Y. Fujita, M. B. Greenfield, Y. Hagihara, K. Hatanaka, T. Kawabata, H. Kuboki, Y. Maeda, H. Okamura, T. Saito, Y. Sakemi, K. Sekiguchi, Y. Shimizu, Y. Takahashi, Y. Tameshige, and A. Tamii, Phys. Rev. C 79, 024602 (2009).
- Grewe et al. (2008) E.-W. Grewe, C. Bäumer, H. Dohmann, D. Frekers, M. N. Harakeh, S. Hollstein, H. Johansson, K. Langanke, G. Martínez-Pinedo, F. Nowacki, I. Petermann, L. Popescu, S. Rakers, D. Savran, K. Sieja, H. Simon, J. H. Thies, A. M. van den Berg, H. J. Wörtche, and A. Zilges, Phys. Rev. C 77, 064303 (2008).
- Negret and Singh (2015) A. Negret and B. Singh, Nuclear Data Sheets 124, 1 (2015).
- Urban et al. (2016) W. Urban, K. Sieja, T. Materna, M. Czerwiński, T. Rza̧ca-Urban, A. Blanc, M. Jentschel, P. Mutti, U. Köster, T. Soldner, G. de France, G. S. Simpson, C. A. Ur, C. Bernards, C. Fransen, J. Jolie, J.-M. Regis, T. Thomas, and N. Warr, Phys. Rev. C 94, 044328 (2016).
- Brown and Rykaczewski (1994) B. A. Brown and K. Rykaczewski, Phys. Rev. C 50, R2270 (1994).
- Dillmann et al. (2003) I. Dillmann, K.-L. Kratz, A. Wöhr, O. Arndt, B. A. Brown, P. Hoff, M. Hjorth-Jensen, U. Köster, A. N. Ostrowski, B. Pfeiffer, D. Seweryniak, J. Shergur, and W. B. Walters (the ISOLDE Collaboration), Phys. Rev. Lett. 91, 162503 (2003).
- Towner (1985) I. S. Towner, Nuc. Phys. A 444, 402 (1985).
- Pfeiffer et al. (1986) A. Pfeiffer, G. Mairle, K. T. Knöpfle, T. Kihm, G. Seegert, P. Grabmayr, G. J. Wagner, V. Bechtold, and L. Friedrich, Nuc. Phys. A 455, 381 (1986).
- May and Lewis (1972) E. C. May and S. A. Lewis, Phys. Rev. C 5, 117 (1972).
- Brown and Wildenthal (1985) B. A. Brown and B. H. Wildenthal, Atomic Data and Nucl. Data Tables 33, 347 (1985).
- Martínez-Pinedo et al. (1996) G. Martínez-Pinedo, A. Poves, E. Caurier, and A. P. Zuker, Phys. Rev. C 53, R2602 (1996).
- Gaarde (1985) C. Gaarde, in Proc. Niels Bohr Centennial Conference on Nuclear Structure, Copenhagen, edited by R. A. Broglia, G. B. Hagemann, and B. Herskind (North-Holland, Amsterdam, 1985) p. 449c.
- Avogadro and Nakatsukasa (2011) P. Avogadro and T. Nakatsukasa, Phys. Rev. C 84, 014314 (2011).
- Mustonen et al. (2014) M. T. Mustonen, T. Shafer, Z. Zenginerler, and J. Engel, Phys. Rev. C 90, 024308 (2014).
- Shafer et al. (2016) T. Shafer, J. Engel, C. Fröhlich, G. C. McLaughlin, M. Mumpower, and R. Surman, Phys. Rev. C 94, 055802 (2016).
- Mustonen and Engel (2016) M. T. Mustonen and J. Engel, Phys. Rev. C 93, 014304 (2016).
- Reyes et al. (2010) A. D. B. Reyes, S. Gupta, H. Schatz, K. Kratz, and P. Möller, Proceedings of Science 28, 75 (2010).
- Timmes and Swesty (2000) F. X. Timmes and F. D. Swesty, Astrophys. J. Supp. 126, 501 (2000).
- Valdez (2012) L. Valdez, Electron-captures in Supernovae, Master’s thesis, Michigan State University (2012).
- Fuller et al. (1985) G. M. Fuller, W. A. Fowler, and M. J. Newman, Astrophys. J. 293, 1 (1985).
- Engel et al. (1999) J. Engel, M. Bender, J. Dobaczewski, W. Nazarewicz, and R. Surman, Phys. Rev. C 60, 014302 (1999).
- Gallagher and Moszkowski (1958) C. J. Gallagher and S. A. Moszkowski, Phys. Rev. 111, 1282 (1958).
- Woosley and Weaver (1995) S. E. Woosley and T. A. Weaver, Ap. J. S 101, 181 (1995).
- Steiner et al. (2013) A. W. Steiner, M. Hempel, and T. Fischer, Astrophys. J. 774, 17 (2013).