6
\vgtccategoryResearch
\vgtcpapertypeTechnique
\shortauthortitleEl-Assady et al.: Semantic Concept Spaces
\CCScatlist\CCScatK.6.1Management of Computing and Information SystemsProject and People ManagementLife Cycle;
\CCScatK.7.mThe Computing ProfessionMiscellaneousEthics
\teaser![[Uncaptioned image]](1908.00475v1/teaser6.png) Guided relevance feedback for the targeted refinement of incoherent areas in the Semantic Concept Space. This user guidance component tours through the space and highlights potentially uncertain areas, suggesting a recommended action for refinement.
Introduction
Guided relevance feedback for the targeted refinement of incoherent areas in the Semantic Concept Space. This user guidance component tours through the space and highlights potentially uncertain areas, suggesting a recommended action for refinement.
Introduction
Semantic Concept Spaces: Guided Topic Model Refinement
using Word-Embedding Projections
Abstract
We present a framework that allows users to incorporate the semantics of their domain knowledge for topic model refinement while remaining model-agnostic. Our approach enables users to (1) understand the semantic space of the model, (2) identify regions of potential conflicts and problems, and (3) readjust the semantic relation of concepts based on their understanding, directly influencing the topic modeling. These tasks are supported by an interactive visual analytics workspace that uses word-embedding projections to define concept regions which can then be refined. The user-refined concepts are independent of a particular document collection and can be transferred to related corpora. All user interactions within the concept space directly affect the semantic relations of the underlying vector space model, which, in turn, change the topic modeling. In addition to direct manipulation, our system guides the users’ decision-making process through recommended interactions that point out potential improvements. This targeted refinement aims at minimizing the feedback required for an efficient human-in-the-loop process. We confirm the improvements achieved through our approach in two user studies that show topic model quality improvements through our visual knowledge externalization and learning process.
keywords
Topic Model Optimization, Word Embedding, Mixed-Initiative Refinement, Guided Visual Analytics, Semantic MappingEfficiently categorizing the contents of large text collections into thematic groups is a common task for scholars in the humanities and social sciences. These data and domain experts usually embark on a process of summarizing documents, extracting concepts, modeling their relations, and finally, aggregating the obtained information to build their knowledge. The generated knowledge is typically externalized in various resources, including traditional books and papers, but also extensive knowledge bases [47]. However, even given the eagerness with which experts strive to model and document their knowledge and intuition, oftentimes available resources do not capture all specific aspects of a domain’s semantics [22]. The shortage of domain-specific knowledge representations in accessible formats has sparked a bustling research area [56] at the intersection of linguistics and machine learning.
Simultaneously, domain-knowledge-independent machine learning techniques are becoming more reliable and accessible. For instance, topic modeling algorithms have wide applicability across a multitude of domains as they augment the time-consuming task of categorizing document collections into thematically-related groups. Despite their usefulness, the quality of their results highly depends on the suitability of the parameter choices and how well they fit and reflect the characteristics of the analyzed document collection and domain semantics. However, as such models are typically black boxes, they are not readily understood by non-machine-learning-experts. Thus, there is a need for machine learning refinement techniques that abstract the complexity of underlying models, enabling users to understand, diagnose, and refine the results. This user demographic does not desire to understand the inner-workings of machine learning but would rather to teach the machine their semantic knowledge while remaining model-agnostic.
Promising visual analytics solutions have been proposed to address such challenges in a collaborative human-machine effort. For example, to model the semantic relations of concepts in a corpus, ConceptVector [44] has been proposed as an interactive lexicon building approach using word embeddings. On the other hand, UTOPIAN [8] enables users to interactively train a topic model, resulting in a clustering of documents into thematic groups. While the first approach is designed to consider the user’s knowledge for top-down concept generation, the second one is data-driven, generating topics bottom-up. Techniques combining high-level analysis concepts with low-level model interaction, e.g. through bidirectional semantic interaction [12], have proven effective since “the power of the computational models can be leveraged without their complexity” [19].
We present a visual analytics technique that tightly links these two perspectives to allow users to externalize their domain knowledge for topic model refinement without understanding the inner-workings of such models. Our lead motivation for such an iterative refinement process is to enable users to teach [50] the machine learning model (through concept refinement), and in turn, the model to respond by learning a new refined representation (through a topic model update) that is presented to the users to show them the effects of their interactions. Hence, our technique relies on two independent hierarchical structures, (1) the concept hierarchy, representing the user’s semantics (top-down), and (2) the topic hierarchy that is based on the automatically computed results of a topic model (bottom-up). Both hierarchies operate on the same vector space but are presented in two separate views. The concept view is used as the interactive view for domain knowledge externalization, while the topic view is a reactive component for inspecting the topic model updates caused by refining semantic relations in the first view. This duality is captured in the topic and concept representations as two superimposed canvases, facilitating the analysis of associations [26].
Thus, the main challenge for our technique is to define accurate mappings from the users’ interactions back to actionable instructions for the topic model optimization. On the visualization side, the challenge is to find an accurate and faithful spatialization of concepts and topics on a canvas, while reducing clutter and retaining semantic neighborhoods.
We designed Semantic Concept Spaces as a mixed-initiative technique tailored to support users in modeling their domain knowledge through defining semantic relations between concepts. Our approach (1) provides different entry points and abstraction layers for the users’ analysis; (2) integrates users in every step of the semantic concept creation; (3) allows for targeted refinement through guided relevance feedback, as well as, concept discovery through serendipitous exploration; (4) enables cross-corpus and model-agnostic learning to allow the transferability of the learned concepts to other topic models and similar document collections; and (5) abstracts from the refined semantics to update domain-specific concepts, avoiding future cold starts [48].
Figure 1depicts the architecture of our approach, starting with processing a document collection to extract relevant keywords and embeddings [35]. These build the basis for the semantic similarity that generates scored keyword vectors as input for topic modeling, they also initialize the interactive concept generation. This step extracts seed-words for the concept generation, optionally including user-defined structures. To define a meaningful spatialization, concept neighborhoods are calculated using t-SNE [28]. After the building of the initial concept hierarchy, all elements of the visualization are projected [38] onto a canvas in layers. The visual analytics interface is the main workspace for the user’s interaction, this enables users to inspect concepts and topics to [T1] understand their relationships, [T2] diagnose potential conflicts, [T3] refine the concept space based on their domain understanding, and [T4] update the topic modeling based on the refined concept space. A continuous quality monitoring and refinement recommendation supports these tasks and enables targeted user guidance.

We evaluated our technique with three approaches. Starting with a mixed-method expert study, six participants used Semantic Concept Spaces on a model refinement task. Second, a quantitative evaluation of the model improvement achieved by experts, across eight model quality measures. Finally, four independent annotators rated the quality of these concept spaces and topic model results.
In summary, this work contributes an iterative visual analytics approach that captures user semantic knowledge to inform machine learning systems. Our technique provides user guidance and relevance feedback for overcoming the “looseness” of the interaction mapping. We demonstrate and test it on a case study in topic model refinement.
1 Background and Related Work
This research is an entry into the burgeoning space of interactive and explainable machine learning applications [21, 37, 33]. In the following discussion, we will relate our work to research in the areas of semantic interaction for visual analytics, and, more specifically, interactive topic modeling and content analysis.
Semantic Interaction
We are inspired by the call by Endert et al. for interaction “beyond control panels,” where data is spatialized and the interaction with that spatialization is the primary mechanism for manipulating the data space [18]. Semantic interaction is a type of direct feedback users can provide to embed their semantic understanding into a visual workspace [20, 19]. In this paradigm, user interactions are used to feed-forward into model refinements. For example, the global layout in ForceSPIRE [20] is adjusted based on users moving words and documents to externalize their knowledge in the workspace. Cavallo and Demiralp [6] employ both forward and backward-projection interactions to enable user interaction with the dimension reduction algorithms. Forward-projection enables users to change the high dimensional vector and see how the projection is changed, and backwards-projection uses direct manipulation to move nodes and see how the input vector changes. In the present work we use semantic interaction to enable users to modify a word2vec word embedding space [41] by modifying the groupings of words into concepts. As there may be many ways to adjust the semantic space, we provide suggested interactions as a form of guidance [9].
Topic Modeling and Content Analysis
Topic Modeling is used to understand large corpora of text and summarize the knowledge contained in them. The basic premise of topic modeling is to cluster groups of documents and label them, obtaining topics. An overview of probabilistic topic modeling algorithms can be seen in the survey by Blei [4]. Several works explicitly address the embedding of the domain knowledge into the topic space. Andrzejewski et al. [3] use Dirichlet forest priors to split and merge concepts using domain knowledge, improving topic descriptors. Chen et al. developed the MDK-LDA variant on LDA which takes into account domain knowledge directly to provide better topic descriptors [7]. Furthermore, approaches that combine word embeddings with topic modeling can be beneficial for learning both models jointly [42], as well as improving topic model representations for short texts through word embeddings [43, 58, 36], or creating improved word embeddings using LDA [46].
Exploratory visualizations for understanding topic spaces include ParallelTopics [10], for exploring single and multi-topic documents using parallel coordinates. The focus of our work, however, is not on viewing the topic modeling itself, but finding an intuitive way for the users to guide the modeling process. Visual topic modelling approaches often include some interactive mechanisms for users to modify the modeling output. TopicPanorama [55] creates a graph of topic relations extracted from multiple sources. Interactive tools are embedded to allow users to modify the graph matching to suit their needs. HierarchicalTopics [11] is a visualization for understanding a large dataset at different levels of granularity. Interactions allow users to adjust the hierarchy. UTOPIAN employs a semi-supervised iterative feedback loop for users to steer the modeling process [8]. ConceptVector [44] enables users to embed domain knowledge interactively, through guiding the building of concepts which are then used to analyze documents. We follow a similar approach in allowing users to refine the concept space which is used as the substrate for topic modeling. This idea of an interactive loop for refining topics appears also in the work of Hu et al. [30], in which users guide the modeling process through constraints on the topic descriptors. Hoque and Carenini embed similar feedback into a visualization system in the ConVisIt project [29]. In our previous work, we reported a user-guided refinement process for topic modeling based on “voting” for models which have subjectively higher quality [15]. Speculative execution has also been used to preview the outputs of topic modeling and allow users to intervene and guide the process [16].
2 Modeling the Semantic Concept Space
To model the semantic concept space of a corpus, we consider all the words it contains and all their embeddings as a foundation (these are a subset of all word in a language’s vocabulary). Based on this set of words, we build two separate, parallel hierarchies; the concept and the topic hierarchies. Both contain four abstraction levels, sharing the lowest level of all base words. These two structures inform the global importance and weights of the words but are kept strictly separate, to guarantee a detachment between the user-defined concepts and the concrete topic modeling approaches. This, in turn, ensures model transferability and cross-corpus learning.
We generically refer to all words (also n-grams) in the corpus, as well as words transitively contained in their embedding vectors, as “words.” Base Words are all words that are neither part of the higher levels of the
![[Uncaptioned image]](1908.00475v1/Hierarchies3.png)
concept nor of the topic hierarchies. They can be promoted to become keyword and/or descriptors through user interaction. On the other hand, demoted keywords and/or descriptors traverse down the hierarchy to become base words. As suggested by their name, these form the basis of the two data hierarchies.
The Concept Hierarchy is user-driven and reflects the semantic relation between the words based on the domain knowledge externalization of users. Descriptors build the lowest level above the base word and are all the words that describe a concept (one level up) but that are not concepts or super concepts themselves. Descriptors have a strict parent-child relation (1:n) to concepts. Concepts define the users’ semantics and are used as the main level of interaction. They are the link between the descriptors (their children) and the super concepts (their parents). Although a word can only be either a descriptor or a concept (exclusive relation), super concepts can include concept words. The reason for this decision is that in some corpora there are multiple super concepts that only contain one concept each. Hence, Super Concepts are automatically computed as a summary of the underlying region. Users can define the level of abstraction, i.e., the number of super concepts interactively. However, in contrast to concepts, the parent-child relationship between concepts and super concepts cannot be manually adjusted but is computed to give a faithful overview of the current state of the concept hierarchy at the time of viewing.
In contrast, the Topic Hierarchy is data-driven. It reflects the structure of the underlying corpus based on the selected topic modeling approach. Keywords are all words contained in all corpus documents, including all descriptive document keywords. Documents are the given unit of analysis in a corpus and are each represented by their top -keywords. Topics are computed using a topic modeling algorithm and are each represented by their top -keywords. Note, that the number of top keywords for document and topics, respectively, can be adjusted by the user. By default both parameters are set to 15 keywords.
All words used in this approach are processed through a linguistic pipeline [13, 14], that includes stemming, POS tagging, n-gram extraction, stop-word removal, and scoring. As described in our previous works [15, 16], we treat each word as a weighted vector initialized using a user-selected scoring function [39]. This section discusses the modeling of the semantic concept spaces, including the creation of the concept hierarchy. The topic modeling hierarchy, on the other hand, is subject to the concrete algorithm used. Since our approach is independent of concrete topic modeling techniques, in this paper, we do not discuss the topic modeling process in detail. For more information on topic modeling and the concrete algorithm used throughout this paper, please refer to our previous work [16]. Rather, in this paper, we, focus on the model-agnostic optimization of topic modeling through concept space refinement. Section 4 discusses this iterative refinement process and the interplay between the concept and topic hierarchies, in more detail. Both hierarchies operate on the same underlying word vectors. Changes in the concept hierarchy, therefore, influence the scoring of words and, in turn, affect the topic modeling. This section discusses the four step process of modeling the underlying data structure of the semantic concept space. This includes building the concept hierarchy, as well as deriving a spatialization of all objects in the concept and topic model views based on the relations of the underlying vector space model. This spatialization is used to initialize the two views, as described in Section 3. To facilitate the readability of this section, we use a simplified example of two generic agenda items from recent US presidential debates, namely, healthcare and taxes.

2.1 Interactive Concept Generation
The first step in this modeling pipeline is the generation of weighted concept vectors. Assuming that the users’ domain understanding can effectively guide the automatic computation in this initial step, we allow users to optionally intervene and interactively edit suggested concept keywords which are used as priors for the further computation. This initial concept generation is described in following four-step process:
(1) Seed Concept Extraction – After pre-processing and annotating all the words in the document collection to be analyzed, we extract seed words. We rely on (a) Latent Dirichlet Allocation [5], as well as a (b) Document Descriptor Extractor [15] to extract the most descriptive keywords in a corpus based on word frequencies, tf-idf [51], log-likelihood ratio [39], and G2 [45] metrics. Note, that these two methods are only used as a heuristic for an initial fast separation of the overall corpus space. We do not apply LDA for topic modeling. The extracted seed words are considered the first concepts and are expanded in the next step to concept vectors. In our example, this step might return two keywords like medical and taxes.
(2) Concept Vector Expansion – In this step, the initial concept words are enriched with semantically similar words using the word embedding service ConceptNet [52] to create concept vectors. Words that are not part of the corpus, but contained in an enriched vector are discarded to focus the vector space and avoid skewness. Note, that we extract word embedding vectors for all words in the corpus but only vectors associated with concept words are called concept vectors. All words in a concept vector are regarded as descriptors for their respective concept. In our example, the concept vectors might contain the following descriptors: :<system,health,relief,care> and :<deduction,money,cuts,relief>.
(3) Interactive Editing and Enrichment – After the first two unsupervised steps, we involve the user in the concept generation. Similar to our proposed topic backbone [16], users have the option to adjust the seed concepts and their vectors as they see fit. They can as well introduce new concepts or remove descriptors to adapt the generated concepts to their understanding. However, as we cannot always assume that users have existing knowledge about the corpus before exploring the visualization, this processing step is optional. If skipped, the concept vectors from the previous step will remain unchanged. A user might, for instance, choose to add the descriptor healthcare to .
(4) Scoring and Ranking – After the generation of the concept vectors, in this step, we use the scoring functions from the Document Descriptor Extractor (1b) to rank the descriptors of each concept. The ranking and scores of each concept is used for weighting them later on. For instance, the words system and relief in our example concepts could be ranked low as these words are, in the one case, too generic and, in the other, too undescriptive (i.e., occurring in both concepts).
2.2 Concept Neighborhood Computation
Based on the weighted concept vectors, this step computes semantic concept neighborhoods to determine the spatialization of all the words in the analyzed corpus. The output of this step is, therefore, a set of 2D-coordinates {x,y} for each word, anchored by concept neighborhoods. We rely on t-distributed Stochastic Neighbor Embedding (t-SNE) [28] for the computation of the concept neighborhoods based on the word embedding vectors. To guarantee a more stable projection result we use the concept vectors as anchors throughout this work. Furthermore, we configure the t-SNE calculation with the following parameters; a perplexity of , a theta of and learning iterations. These were determined based on trials with different corpora using a projection inspection approach [54]. As the perplexity parameter describes the expected minimum number of neighbors each point should have, to ensure a convergence with few errors (i.e., separable while preserving object distances), it is essential to maintain a partly overlapping set of descriptors in the enriched concept vectors. In the following, we describe the three-step process for computing semantic concept neighborhoods.
(1) Corpus and Topic Keyword Insertion – In order to consider all relevant words in the projection, in this first step, we combine all corpus and topic keywords (each represented by their word embedding vector) with all extracted concepts (represented by their respective concept vectors). We use all word embedding vectors in the second step to determine the initial positioning of the concept vectors. These positions, in turn, are used as anchors in the third step.
To ensure that the concept space is representative of the analyzed corpus, in this step we additionally assign the top twenty keywords from each document to their closest concept vector as descriptors. In our example, we might add keywords like company or spending to , as well as affordable to . Note that this technique is independent of the concrete topic modeling approach, as long as each topic is represented by a keyword vector and each document is assigned to a topic. In this paper, we use the Incremental Hierarchical Topic Model (IHTM) [16] throughout, as it is deterministic and provides the required topic-document-keyword hierarchy.
(2) Initial Concept-Anchor Setting – To meaningfully initialize the t-SNE projection, in this step we compute {x,y}-coordinates for all extracted concepts and set these as anchors for the projection in the next step. We determine these coordinates based on a run of t-SNE on the complete set of word vectors in the corpus. This first run uses random initial positions for the words as it is only employed to determine a meaningful spatialization for the semantic concepts. Therefore, other than the {x,y}-coordinates for the concepts, the word positions of this run are discarded and recalculated in the next step.
(3) t-SNE Reduction – To retain a stable projection after t-SNE convergence, in this step, we use the previously determined concept positions as anchors. We then run t-SNE a second time to determine the {x,y}-coordinates for all word vectors in the space. In later steps, when users edit and change the concept hierarchy, we re-run this step on-demand to update the concept space. In our example, each of the two concept vectors, as well as their associated descriptors have a determined position as {x,y}-coordinates in the 2D space.
2.3 Concept Hierarchy Building
Based on the neighborhoods determined by the word embedding projection, in this step, we build the concept hierarchy relations, getting rid of descriptor overlap by assigning each descriptor to only one concept. This is achieved based on the following four-step process:
(1) Parameter and Constraint Setting – The abstraction level of the concept space has a considerable impact on the visual analysis and refinement process. We therefore present users with a choice of different entry points in the visual analytics interface. We provide non-overlapping level-of-abstraction sliders to adjust the semantic abstraction levels for concepts and super concepts. For example, Figure 2 shows three out of five abstraction levels for concepts.
The parameters chosen to determine these abstraction levels are two-fold: The minimum semantic cosine similarity threshold , and the minimum number of descriptors or concepts in a neighborhood
![[Uncaptioned image]](1908.00475v1/Cluster_Center.png)
. By default the similarity threshold is set to , and the neighborhood parameter is set to for concepts and to for super concepts. Changing the abstraction slider adjusts , directly resulting in a higher or lower level of abstraction. Based on these parameters we perform a hierarchical, density-based clustering to obtain the concept hierarchy, as described in the next steps.
(2) Semantic Similarity Update – Beside the word positioning, to perform the hierarchical clustering, we use the above mentioned semantic similarity.
We keep words inside the same cluster (i.e., concept) if they are similar with respect to their cosine similarity. We check this at two points during clustering. First, when deciding which words could initially form a cluster using the threshold. Secondly, when clusters overlap, only clusters which have a high word-embedding coherence are merged, Otherwise, all overlapped members are redistributed to their most similar cluster. The word-embedding coherence defines the threshold for the minimal acceptable inter-cluster coherence on the current abstraction level, and is dependant on the and the current concept abstraction level. Hence, updating the semantic similarity based on the threshold is essential to ensure a coherent semantic concept hierarchy. In our example, the word system and the concept medical might not meet the threshold.
![[Uncaptioned image]](1908.00475v1/Quadtree.png)
(3) Quadtree Mesh Generation – The second criterion used in the clustering is neighborhood preservation. Based on the {x,y}-coordinates previously obtained for each word, we generate a quadtree [24] mesh, such that every word is positioned in its own quadrant. The quadtree recursively partitions the 2D space into squares, where each non-empty square is further divided into four equal-sized squares. Hence, each point (i.e., word) has its own leaf node. Coincident points are stored as a linked list. The quadtree is used in later steps as an index for collision detection and neighborhood search.
(4) Hierarchical Density-Based Clustering – Based on the and thresholds, we calculate the concept hierarchy in two separate clustering iterations, one for concepts and another
![[Uncaptioned image]](1908.00475v1/Clustering.png)
for super concepts. We perform an agglomerative, density-based clustering [59] that assigns each word in the space to a concept, and, in turn, each concept to a super concept. Based on the quadtree, we extract the nearest neighbors of each concept word and form initial concept clusters. If a concept does not have enough neighbors () or these neighbors do not satisfy , we do not create a cluster. Once two clusters overlap, their overlapping children are either split up or the two clusters are merged (depending on their pairwise cosine similarity). After the initial clustering is formed, all descriptors not belonging to a cluster are assigned to their most similar concept. The process is repeated to group concepts into super-concepts using their respective parameters. After clustering, our example concepts become: :<cuts, deductions, spending, company> and :<healthcare,health,care,affordable>. Note, that for the word health is added, as it is among its nearest neighbors.
2.4 Layered Canvas Mapping
Based on the spatialization of all words and the generated concept hierarchy, the last step in modeling the semantic concept space is the layered mapping of all elements on a canvas. In the following, we describe the five-step layout process.
(1) Transformation and Rescaling – To maximize available screen space, all data points are transformed and rescaled to the boundary of the rectangular viewport. The canvas on which the points are mapped can then be interactively panned and zoomed by users during analysis.

(2) Concept-Anchored Projection – Based on the rescaled canvas, as well as the adjusted concept hierarchy, we recompute a concept-anchored t-SNE reduction and project the result onto the canvas. In addition to the words being projected as points based on their respective {x,y}-coordinates, we include a bounding box for every word based on its length and size (i.e., concepts are shown larger than descriptors, etc.) The quadtree index is also updated during this step.
(3) Overlap Reduction – Since some of the word vectors might be projected onto close coordinates on the canvas, in this step we reduce the potential overlap. Iterating over the quadtree index, we detect areas of potential occlusion based on the object position, as well as its bounding box. The overlapping objects are moved away from each other until the process has reached a local minimum.
(4) Color Mapping – The layout process results in
![[Uncaptioned image]](1908.00475v1/Colors.png)
{x,y}-coordinates which reflect semantically similar neighborhoods. In addition to this spatial encoding, we use the LAB Color Space [57] to assign each concept a color based on its respective 2D-position in that space. Descriptors are assigned the colors of their parent concept. This double encoding of similarity reveals descriptors that are projected in a neighborhood of a different color, indicating that their underlying word embedding is in conflict with the concept hierarchy.
(5) Voronoi Tessellation – To structure the concept space, we rely
![[Uncaptioned image]](1908.00475v1/Voronoi.png)
on the positioning of the extracted concept hierarchy. To enhance the visual association of the words in the space to super concepts (creating a high-level overview), we partition the space based on the extracted super concepts. We employ a Sweepline Voronoi Algorithm [25] to determine super concept boundaries which can be visualized on the concept space canvas on demand.
3 Visual Analytics Workspace
The generated data structures and spatialization, described in section 2, builds the foundation of the visual analytics workspace.
![[Uncaptioned image]](1908.00475v1/layered_mapping1.png)
The Semantic Concept Space is designed as a layered, interactive canvas that consists of two stacks of layers; (1) the Concept View and (2) the Topic View.
Design Rationale – Building on the basis of the word positioning, we designed the two views to be separate, super-positioned canvases. Users can interact with one view at a time, while the other is toggled inactive. To facilitate comparison between views, the inactive view is shown with a low opacity in the background of the active one, making its elements shine through the canvas. Each view is composed of three layers, representing its hierarchy levels above the base words. The layers of the Concept View are initialized with the extracted concept hierarchy, and the Topic View layers with the topic modeling result. A concept refinement process enables users to directly adapt the concept hierarchy to their semantic knowledge. They can promote words up the hierarchy (base word descriptor concept) or demote them. Only the super concept layer is not interactively adjustable, as it is supposed to reflect a high-level view of the complete space. At any point of this iterative process can users trigger a recomputation of the t-SNE projection to adjust the word spatialization to the new concept hierarchy. On the other hand, the topic modeling view can not be adjusted directly but is used for inspecting and analyzing the topic modeling result. Only through recomputing the topic modeling algorithm (on-demand) do the layers of the topic modeling change to adapt to the concept refinements. This duality of views enables users to teach the machine learning model their domain knowledge, as well as the machine learning model to respond through learning the new semantics.
Visual Encoding –
Our visual workspace is designed to support (1) finding different elements on the canvas, as well as (2) the spatial association of words. As a second level task users are expected to (3) decode the type of word object at hand. To design an appropriate visual encoding we consulted a study of the design space of keyword summaries [23] that indicates that there is a trade-off in the effectiveness of typography versus marks with respect to our tasks; search speed (1&2) and value judgement (3). According to their findings font size attracts the attention of users and performs better in search tasks. In addition, according to Alexander et al. [1], the perceptual bias for estimating font sizes is negligible. We, hence, represent each word object by default with a label and enable users to toggle on a
circle as an additional mark. Both the circle and the label sizes encode the object level in the data hierarchy and, thus, are doubled going up the hierarchy. Furthermore, for the topic view, we designed a topic glyph ![[Uncaptioned image]](1908.00475v1/inline_glyph1.JPG) that represents the topic or document association with different concept regions. This glyph can be used as another alternative representation for the object marks on the canvas layers.
that represents the topic or document association with different concept regions. This glyph can be used as another alternative representation for the object marks on the canvas layers.
3.1 Concept View
The concept view, Figure 3(a), is the entry point to the visual analytics workspace. As shown in Figure 2, users can vary the
![[Uncaptioned image]](1908.00475v1/Abst_ConceptView.png)
semantic abstraction level of concept and super-concepts. Defining the entry point of their analysis is equivalent to choosing a refinement strategy. Some users prefer to start at a detailed level and refine the concept space by deleting non-descriptive words (bottom-up refinement), while others prefer to add descriptors (top-down refinement) to an initially abstract view. After configuring the initial concept view, users can start exploring and interacting with the concept layers, as described in the remainder of this section.
Descriptor Layer – There are three types of descriptors in the concept hierarchy; (1) descriptors from the concept generation step (subsection 2.1), called concept descriptors; (2) descriptors from the neighborhood computation step (subsection 2.2), called topic descriptors; and (3) user-defined descriptors. Each of these descriptors is directly assigned to a concept. Users can toggle the visibility of each of the descriptor groups. When visible, descriptors can be represented by a colored dot and/or a small label.The color of a descriptor is based on the position of its parent concept, while its position is based on its weighted word embedding vector. This enhances the detection of outliers, i.e., as colors directly reflect the user-refined concept hierarchy.
A single descriptor can be selected and deselected through a toggle-click. Selections can be (1) deleted from concept view, i.e., demoted to become a word; (2) promoted to become a concept; or (3) (re-)assigned to an existing concept. A group of descriptors can also be used to create a concept, promoting a selected one to a concept and all others as its new descriptors. In addition, users can add a word to the descriptor layer, effectively promoting it to become a descriptor.
Concept Layer – This is the central layer for the refinement of the concept hierarchy. Concepts are represented by a colored dot and/or a medium-sized label.In contrast to descriptors, the color and position of concepts are synchronized in order to anchor the concept space. A single concept can be (1) demoted to become a descriptor, redistributing its descriptors; (2) deleted together with all its associated descriptors (becoming base words); or (3) swapped by one of its descriptors. A selected group of concepts can be (4) merged to form one joint concept.
Super Concept Layer – The highest level abstraction in the concept hierarchy is formed by super concepts. These are represented by large, faded-gray labels positioned in the background.Super concepts are generated automatically and are non-interactive. However, users can vary the super concept abstraction level. In addition to the labels, as described in subsection 2.3, super concepts structure the space into subdivisions. These are represented by a Voronoi tessellation.
3.2 Topic View
To build this view, Figure 3(b), we rely on a spatialization of the keyword vectors of documents and topics. These vectors consist of a
![[Uncaptioned image]](1908.00475v1/Topics.PNG)
weighted set of the most descriptive keywords extracted by the underlying topic model [16]. These weights represent the importance of a keyword to their respective document or topic. In addition, every keyword has its own word embedding vector and weights, corresponding to its global importance in the corpus. The former weight is the learned weight by the topic modeling algorithm, while the latter is influenced by the concept hierarchy manipulation to teach the model. This section describes all layers of the topic view, as well as, the topic glyph design.
Keyword Layer – This layer corresponds to the descriptor layer of the concept view. Keywords are all descriptive words extracted by the topic modeling. Some of them are at the same time descriptors in the concept hierarchy. They are represented by a black label and/or a circle. Keywords are assigned to documents. However, in contrast to the strict descriptor–concept assignment, in topic hierarchy, more than one document can share the same keyword. Other than showing or hiding them from the canvas, keywords are not interactively adjustable.
Document Layer – The main unit of analysis in a corpus are the documents. These are represented by their most descriptive keywords.In addition to circles and labels, documents can also be depicted using the topic glyph. This indicates all related concept regions of a document, as described at the end of this section. Selecting a document reveals all its corresponding keywords. If one of its keywords is also a descriptor it gets highlighted in color, otherwise, document keywords are shown in gray. Moreover, hovering over a document object shows the underlying text for close-reading.
Topic Layer – The top layer in this view is the topic layer. Similar to documents, topics are depicted by their top keywords. They are also represented by labels, circles, as well as topic glyphs. Selecting a topic shows all the documents assigned to it.
Topic Glyphs – To facilitate the association of topics and documents to concepts, the topic glyphs relate both though spikes that point
![[Uncaptioned image]](1908.00475v1/glyph_calc1.png)
to their most related concepts in the embedding space. For each concept in the concept hierarchy, we include one spike such that the percentage of how similar a given topic and the concept is proportional to the length of the spike. We calculate the Euclidean distance between the two objects as , and the normalized cosine similarity of their respective word embedding vectors as . The distance marking the end point of the spike is thus the normalized product of the two factors: . In addition to being the scaling factor for each spike’s length, the cosine
similarity is also mapped to the opacity of the spike, making
![[Uncaptioned image]](1908.00475v1/Glyph.PNG)
![[Uncaptioned image]](1908.00475v1/Glyph3.PNG)
![[Uncaptioned image]](1908.00475v1/Glyph1.PNG)
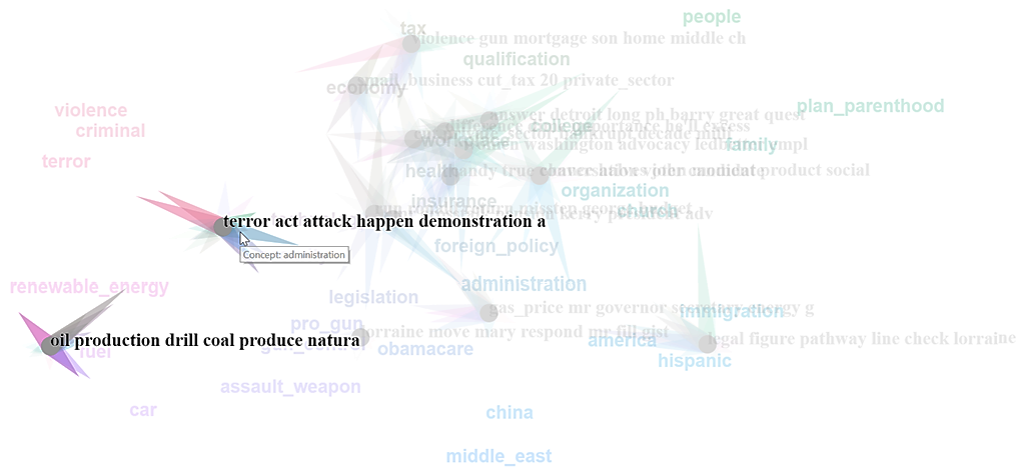
the ones pointing to similar but distant concepts more visually prominent. To facilitate finding the locations of the concepts associated with a glyph spike, we map the color of each spike with the color of the corresponding concept. We further orient the spikes to point to their associated concepts. Hence, using this representation, we can reveal topics and documents that are mixtures of different concepts. Some of which, are intentionally bringing together aspects of two concepts, e.g., the topic on the attack on Libya in Figure 3(b), bringing together the concepts terrorism and oil production. In other cases, topics are only associated with one concept and are correctly placed atop that concept, showing almost no visible spikes. Overall, these spikes can be seen as the directions in which topics or documents are pulled, based on the semantics of the concept space.


3.3 Concept Space Interactions
Users are supported in their exploration and analysis through a number of instruments. The most noteworthy interactions are:
Navigation through Word Search – We provide a search query interface and base words that are not found in the current hierarchy can be added as new descriptors.
![[Uncaptioned image]](1908.00475v1/Lasso3.png)
Lasso Selection – To facilitate the selection of multiple objects in the space with one interaction, we implemented a lasso selection. Individual items can be added to, or removed from existing selections.
X-Ray Lens – Users might want to inspect a neighborhood
![[Uncaptioned image]](1908.00475v1/Lens.PNG)
in more detail, for example, to look for specific words, or to understand why an area might be empty in a specific layer. We, therefore, enable them to peek through all the layers at once using a distortion lens. When activated in one of the views, the lens can be used to reveal all objects in a particular position throughout the hierarchy. The lens only operates on the active view.
Guided Tours – Lastly, users can toggle the ‘magic wand’ icon ![[Uncaptioned image]](1908.00475v1/magicwand.png) to start a guided refinement tour [40] through the semantic space. This targeted refinement zooms the canvas on the most uncertain part of the concept space and suggests a refinement that the user can accept or reject to go to the next suggestion.
to start a guided refinement tour [40] through the semantic space. This targeted refinement zooms the canvas on the most uncertain part of the concept space and suggests a refinement that the user can accept or reject to go to the next suggestion.
4 Interactive Learning of the User’s Semantics
The foundations of our mixed-initiative technique are the user guidance and learning components. These constantly monitor the quality of the concept space to tailor the suggestions for refinement of the most uncertain areas. However, as serendipitous exploration has been deemed useful for content exploration [2], our approach is designed to encourage exploratory refinement. When needed, users can request guided refinement suggestions on demand. Both of these options are part of the concept refinement, designed to teach the system the users’ semantics. The counterpart to this knowledge externalization consists of the topic model learning the new semantics, as well as the corresponding adaption of the topics to the learned word associations.
The main challenge of such an approach is the lack of specificity in the user interactions, i.e., the performed semantic interactions are not directly linked to actionable steps for topic model refinement. We therefore rely on learning the ‘importance’ of words for the given corpus, as well as their relations. Hence, the weighted word vectors are the common ground used for learning. In addition to corpus-specific concept refinements, we learn global word associations to enable knowledge transfer across comparable document collections. For example, if users refine a concept space for a specific presidential debate, they can reuse that space to initialize the concept extraction for another presidential debate, avoiding a cold start to the second analysis. Overall, for every word in the system we keep track of several scores, including its relevance for every concept, topic, and document, as well as for the corpus and globally. To learn the importance of a word, its level in the concept hierarchy is weighed-in, with super concepts having the largest impact.
During the refinement process, users have two controls to start a new cycle, on-demand. They can update the spatialization of objects by clicking the ‘update t-SNE’-button. On the other hand, users can retrain the topic modeling by clicking the ‘update TM’-button. To avoid confusion, the positioning of objects on the screen only changes when triggered by the users though these controls.
4.1 Concept Refinement
As shown in Figure 4, we offer users two ways to refine the concept space; (1) direct manipulation and (2) guided relevance feedback. Tasks performed during concept refinement include: adjusting the concept hierarchy based on the users’ domain knowledge; cleaning up potential projection errors; resolving word chaining issues (i.e., two words linked through their association with a third, polymorphic word); as well as, finding ‘hidden’ concepts based on the topic modeling result.
Actions can be carried out on selected objects in the canvas. All available commands fall under three primitive types: (1) change of hierarchy level: (a) promoting, (b) demoting; (2) change of a parent-child relationship: (a) reassign children, (b) reassign parent; (3) splitting or merging siblings. Within the concept hierarchy, every level supports certain interactions: super concepts are not interactive; concepts support (1b, 2a, 3); descriptors support (1, 2, 3); while base words support (1a).
Direct Manipulation
As described in subsection 3.1, users can directly interact with words in the concept view. The interactions available in the context menu change based on the selected object types. Users are typically offered sophisticated interactions that combine more than one of the three primitive actions. For example, as depicted in Fig. 4(a), for a selection of descriptors, users can ‘create a concept from the selection.’ This is equivalent to (1a) promoting the descriptor clicked (in this case: ‘college’) to become a concept, then (2) assigning all other descriptors in that selection to the newly created concept.
Guided Relevance Feedback
Actions can also be recommended to the user. The intuition behind this targeted refinement is that the system offers users a guided tour through the data-space, pointing them to potential problems, with the goal of achieving maximum gain for minimum feedback. To start a tour, users click the ‘magic wand’-button which opens up a suggestion window, displaying the first refinement recommendation, as shown in Fig. 4(b). Simultaneously, the concept map gets zoomed to the region of refinement, centralizing and highlighting the objects concerned.
Users can then accept or reject the suggestion, or choose a different interaction to perform.
Internally, this action prompts the refinement recommender to reevaluate the semantic space based on information collected through the constant quality monitoring and fill up the recommendation queue.
Quality Monitoring – In order to make more informed decisions for the user guidance, the system tracks several quality criteria across actions: the scatter of word clusters (words in the same concept cluster or neighborhood) based on cluster-density, intra-cluster variance, and inter-cluster variance. Here, we rely on several cluster validity measurement techniques [32], including the root-mean-square standard deviation [27], as well as the S_Dbw validity index [27]. In addition, for every word, we keep track of its neighborhood count, semantic similarity to its children and/or parent, as well as its spatial distance to children and/or parent. Furthermore, the quality monitoring component evaluates the internal quality of the topic modeling based on the criteria outlined in our previous work [16].
Refinement Recommendation – Based on the results of the quality monitoring, the recommender keeps a constantly-updated queue of words and their suggested actions. This queue is formed from words that are chosen based on their importance to the corpus using tf-idf scoring [51]. The intuition is that users should be presented with refinements affecting the worst-performing, high-impact words, in order to achieve substantial improvements and give minimum feedback for maximum gain. Words important to the whole corpus (high tf-idf) should be concepts, while important for single documents (low tf-idf) should be descriptors.
After retrieving the top 50 high-impact words using tf-idf, the recommender loop starts by (1) ranking them based on the quality metrics; (2) sorting possible refinement actions for each word, as well as word clusters, using a decision tree; and finally, (3) adding the words along with their most suitable recommendation to the queue. The queue is reevaluated if the concept space changes. The recommended actions come from the three primitive interaction types listed above. An example of a recommendation is depicted in Semantic Concept Spaces: Guided Topic Model Refinement
using Word-Embedding Projections.
4.2 Topic Modeling Adaptation
As described in subsection 3.2, we depict the associations (semantic similarity) of topics and documents to concepts through topic glyphs.
![[Uncaptioned image]](1908.00475v1/T1-full1.jpg)
During refinement, four different cases of topics (and documents) can be observed. (1) ![[Uncaptioned image]](1908.00475v1/T1.jpg) Single-Concept Topics are related to only one concept and placed atop that concept, the corresponding glyph has no large spikes.
Single-Concept Topics are related to only one concept and placed atop that concept, the corresponding glyph has no large spikes.
![[Uncaptioned image]](1908.00475v1/T2-full.jpg)
These topics are coherent with the concept structure and do not require further refinement. (2) ![[Uncaptioned image]](1908.00475v1/T2.jpg) Unrepresented Topics that are not related to any concept. They are placed atop an empty region in the concept space, with no large spikes visible in their glyphs. If relevant, users can introduce a respective new concept to the empty area, otherwise, the top topic key-
Unrepresented Topics that are not related to any concept. They are placed atop an empty region in the concept space, with no large spikes visible in their glyphs. If relevant, users can introduce a respective new concept to the empty area, otherwise, the top topic key-
![[Uncaptioned image]](1908.00475v1/T3-full.jpg)
words have to be inspected further. (3) ![[Uncaptioned image]](1908.00475v1/T3.jpg) Multi-Concept Topics are related to a close neighborhood of concepts. They are placed in-between the related concepts, with small spikes to these concepts in the corresponding glyph. If closely related, users can merge the concepts, other-
Multi-Concept Topics are related to a close neighborhood of concepts. They are placed in-between the related concepts, with small spikes to these concepts in the corresponding glyph. If closely related, users can merge the concepts, other-
![[Uncaptioned image]](1908.00475v1/T4-full.jpg)
wise, no refinement is needed. (4) ![[Uncaptioned image]](1908.00475v1/T4.jpg) Concept-Incoherent Topics are related to multiple concepts across the space. They are placed in-between the related concepts according to similarity, with large spikes pointing to these concepts in the corresponding glyph. This is the most critical case, it has to be resolved through targeted concept refinement and a closer inspection of the topic hierarchy.
Concept-Incoherent Topics are related to multiple concepts across the space. They are placed in-between the related concepts according to similarity, with large spikes pointing to these concepts in the corresponding glyph. This is the most critical case, it has to be resolved through targeted concept refinement and a closer inspection of the topic hierarchy.
In the refinement, users can investigate words that are deemed important to a topic but are not relevant for concept distinction. These words are typically less descriptive (in terms of their unique semantic contribution) to a topic than modeled by the algorithm. For example, in a topic model, based on a bag-of-words-representation, (frequent) verbs, adjectives, and adverbs can cause documents to seem similar even though they are not. To avoid such chaining effects, we use the learned weights and scores from the concept refinement to readjust the keyword weighting for the topic model training. These act as “must-link” and “cannot-link” constraints [3] to introduce the user-defined notion of relevance to the topic modeling. Ideally, a stable and deterministic topic model [16] should be used in this process. However, probabilistic models are also applicable but take longer to converge due to inconsistencies between their individual runs [4].
5 Evaluation
Methodology – We evaluated our approach with in three stages. (1) To asses the usefulness and usability of our technique, we conducted an expert mixed-initiative study [31] with six participants, involving two phases of semi-structured interviews, as well as a pair-analytics session [34]. (2) Based on the concept space refinements of the study results, we automatically computed the topic modeling improvements across eight quality metrics [16]. (3) To assess the perceived quality difference, we asked four independent annotators to rank the quality of five different concept spaces and their associated topic modeling results. This section reports the results of all three stages, grouped into quantitative and qualitative insights.
Dataset and Controls – For our evaluation we sought a dataset with a broadly familiar content, where the expected topic distribution is known. To ensure comparability with our previous work on topic modeling refinement [16, 15], we chose to use the second US Presidential Debate between Romney and Obama in 2012, as our corpus for all studies. In this dataset, we treat every speaker utterance as a document.
Participants and Tasks – After conducting a pilot study, we designed the expert user study for a target group of people generally interested in politics. Based on our experience in previous works, we envisioned that scholars in the social sciences and the humanities would fit this profile, we therefore invited two political scientists and two linguists to take part in the study. As a control group, we recruited two computer scientists with no prior knowledge in debate analysis. For the annotation task, we invited two political scientists and two linguists . Across the three stages, our goal was to assess the technique’s support for the four tasks [53] of [T1] understanding, [T2] diagnosis, and [T3] refinement of the concept space, as well as, [T4] progressively updating the topic modeling.
5.1 Qualitative Results: Expert Feedback
The six sessions of the expert study, 1.5h each, were structured into three parts. We started with a semi-structured interview (40 mins) in which the explanation of the approach was interwoven; we checked the expectations of the participants before introducing new concepts. Second, we gave the participants full control over the tool and asked them to refine the concept space. In this pair-analytics session (30 mins), we encouraged participants to think-aloud. Lastly, we ended the study with another semi-structured interview (20 mins) that incorporated the participants’ expectation statements from the first part, as well as a reflection of the analysis process. All sessions were screen-captured and audio-recorded for further analysis.
Initial Feedback
Regardless of their prior experience with topic modeling or familiarity with the data, all experts saw benefits in our technique and potential application areas. Some of them were more familiar with automatic content analysis, like , who stated that she “[had] a mixed experience with using topic models, [as] they sometimes extract useful concept but often contain nonsense words.” On presenting her the idea of our approach she commented: “I find it a very helpful concept to be able to include prior knowledge, we often do that after modeling, but it is also good to do before.” On the other hand, declared that he had no previous experience in using topic modeling but has developed similar machine learning techniques before. He observed that “the idea of relevance feedback is good because you adapt what you see, but with a topic modeling black-box, you don’t know what the machine learns, which [he] would like to be able to evaluate.”
When asked about his expected workflow, was quite certain with the way he wanted to proceed in the refinement, stating that he “would try to differentiate between situational and general concepts.” However, when questioned about the guided refinement, he responded that “[he is] not sure about the guidance component, it might speed up the process, but it’s not transparent.” , on the other hand, described his expected workflow as follows: “My workflow would be to start with looking at concepts, to figure out outliers, then group concept descriptors.”
Observations During the Refinement Process
Before they started their interactive sessions, we asked participants to rate different concept space abstractions. We got mixed feedback on the favored entry point to the analysis from the different participants. , for example, stated that she would be interested in “the system to suggest a full space and [that she] would clean up the unsuitable details” As opposed to this bottom-up refinement, said: “A full space is too cluttered for me, I need to understand the problems, then build up my solution.” also favored a top-down refinement stating that “starting with fewer concepts is helpful for the exploration.” All participants agreed that interactively choosing an entry point to the analysis is a desirable functionality that they would make use of, depending on their tasks and data, different abstraction levels would make sense for the refinement.
The participants then generally continued with exploring the semantic space first, to get a better understanding of the corpus. At this stage many used the x-ray lens to explore empty regions in the concept and topic views, or find related words to an object. For instance, was interested in exploring a topic on gun violence and used the lens to find related keywords. After some refinements, she remarked that “it is satisfying to clean this mess and see the model respond,” describing the interface as a “neat combination of ecstatically pleasing components.”
During the exploration of the space, pointed out that “the tool is good at identifying communities.” After observing the the concept regions, found a region in the space that she deemed incoherent, commenting: “This is a fuzzy area.” The contained descriptors included a moderation cluster, temporal keywords, and person names, she pointed out that “[she] wouldn’t use these words.” She continued by selecting the entire region using the lasso tool and deleting its content. She then stated building up new concepts that, in her opinion, described the underlying phenomena more accurately than the previous space. She then updated the projection and topic modeling, observing a better semantic representation. The effects of direct manipulation were also praised by ; he stated “I can now build my own semantics and theories to test out.” Similarly, after observing some positive changes in the semantic space, said: “It’s like adding my intuition to a stupid machine.” She also commented on the guided refinement, finding the suggested operations useful, only disagreeing with one proposed action.
Overall, the refinement process was well received by all users. Most of them went through several iteration cycles (up to eight during 30 mins), often trying out the effects a refinement would have on the topic modeling and claiming that they had a better intuition of the expected model after the first few cycles. When asked about their final goal for refinement (or stopping criterion), most participants stated that it would be a trade-off between the importance of the result (e.g., when used for further analysis) and their familiarity with the domain semantics. observed that “not every topic has to be coherent to be helpful,” meaning that his final goal would not be to make each topic perfectly fit only one concept but rather to make them meaningful.
Usability and General Assessment
All experts enjoyed interactive refinement session. In her general feedback, immediately cautioned that “it’s so easy to use topic modeling results in a wrong way, I find it good to explore the space and understand the reasons for the results.” The same sentiment was shared by , who stated: “I like the idea that I can use my knowledge to put things in order, that’s really useful and very satisfying.” On the other hand, proposed to use our approach for communication, saying: “I would like to use this tool for presentation, it would be a nice feature to animate though the regions and create a storyline” However, he also requested that “[he] would like to be able to track the changes happening in the topic modeling over the different refinement cycles.”
Reflecting his workflow commented: “I was adjusting concepts to reduce topic spikes, but then I started asking why a topic is [placed] there and how the system understands my interactions.” He continued that “the color encoding of the words was useful to find outliers.” However, commented that “since [he is] not an expert in with these data, [he] would like to verify the performance of the topic modeling automatically.” Nevertheless, “[he] like[d] the design of the interactions, [that he] can insert words directly on the canvas and not in a side panel.”
The most notable additional features suggested by experts include; a feature to start typing to autocomplete a concept and jump anywhere in the space (); to add a space-out or blow-up button for a selected area (); to “deep-search” for similar concepts (), and finally to enable zoom-dependant resizing of text labels ().
5.2 Quantitative Results: Quality Assessments
Based on the logging results of the expert studies, we can compare the automatic quality metrics for the topic modeling. We did not observe any significant difference in the refinement results across the three user groups. Experts and non experts, alike, were able to enhance the topic modeling results through our technique. The average relative change, from the initial model to the refined model, based on the eight observed quality metrics [16] was as follows: Coherence (-5.49%); Separation (-12.09%); Distinctiveness (331.31%); Point-wise Mutual Information (4.32%); Certainty (0.66%); Branching Factor (-26.47%); Compactness (-11.77%); and Topic Size (1.45%). Hence, while on average the topics became slightly less coherent and separated, they became significantly more distinct during the refinement.
The last stage of our evaluation is the assessment and ranking of five models by four annotators. The manual refinement model was generated by a participant in the first study. The other models were created following the guided refinement suggestions, the initial model at the default level of abstraction, and the initial model at high and low abstraction levels. Annotators were given the agenda of the debate and asked to rank the concept view, as well as a keyword-list of the corresponding top topic descriptors. In our annotation guidelines, we asked them to base their ranking on four criteria: completeness, coherence, separability, descriptiveness. The results, as shown in Table 1, confirm that the manual refinement of the concept space yields the most well-perceived concept view, while the guided topic refinement leads to the highest ranking topic modeling result. This might be due to overlooked, uncertain regions during the manual refinement. In their annotations, they pointed out that incoherent areas are mainly comprised of clusters of names or general words, like tomorrow, country, etc. This suggests a potential improvement through domain-specific filters for non-informative words.
| Compared Output | Semantic Concept Space | Topic Modeling Result |
|---|---|---|
| Manual Refinement | 1.00 (0.00) | 2.00 (0.70) |
| Guided Refinement | 2.25 (0.43) | 1.50 (0.51) |
| Default Model | 3.25 (0.82) | 2.75 (1.09) |
| High-Abstraction | 4.00 (0.71) | 4.25 (0.82) |
| Low-Abstraction | 4.50 (0.87) | 4.50 (0.50) |
6 Discussion and Conclusion
Typically statistical machine learning algorithms, such as topic models, do not incorporate the semantic relations between objects. It is rare that topic models consider the semantic similarity between keywords or documents. Rather, they rely on keyword scoring and statistically induced relations between objects to group them. On the other hand, domain experts see implicit relations between objects and attributes that they cannot incorporate into the machine learning models. Modeling user semantics independent of the topic model is challenging as the user model cannot be tuned to give the best topic model outputs without rapid, iterative feedback. Typically feedback is constrained by algorithmic parameters and is challenging for non-machine-learning-experts [15].
Semantic Concept Spaces11 1 The system is available as part of the lingvis.io Framework [14] under: http://concept-spaces.lingvis.io/,22 2 This work has received funding from the DFG/SPP-1999 VALIDA project (number 376714276) and the DFG Research Unit FOR2111/QI project 8. It was further supported by the SFB/Transregio 161 (number 251654672), projects A03 and A04, as well as NSERC Canada Research Chairs. contributes an approach to bring the expression of user semantics closer to the actual ML model. Users can see the big picture of the concept space and generate new ground truth data through their interactions and knowledge externalization, a form of “machine teaching”. The modifications applied to the concept space become transferable knowledge which can be used to initiate models used on other data. We introduce a design that is based on two parallel hierarchies: the concept and the topic hierarchies. The interactions take place in this data space and thus the whole system is “model agnostic.”
In the future we envision improvements to the recommendation system, for example, verbalizations of system decisions [49] could help a user know the reasoning behind a recommended interaction and provide better guidance for model refinement. Because the goal of this project is to capture the semantics of natural language, there is also a lot of opportunities to engage with this data through a natural language interface, for example, verbally expressing a list of descriptors which would make a concept faster than searching the concept space and adding them. Study participants expressed a desire to compare consecutive topic models during the refinement process. This could potentially be achieved through topic matching [17].
References
- [1] E. Alexander, C.-C. Chang, M. Shimabukuro, S. Franconeri, C. Collins, and M. Gleicher. Perceptual biases in font size as a data encoding. IEEE Trans. on Visualization and Computer Graphics, 24(8):2397–2410, 2017. doi: 10.1109/TVCG.2017.2723397
- [2] E. Alexander, J. Kohlmann, R. Valenza, M. Witmore, and M. Gleicher. Serendip: Topic model-driven visual exploration of text corpora. In Proc. IEEE Symp. on Visual Analytics Science and Technology (VAST), pp. 173–182, 2014.
- [3] D. Andrzejewski, X. Zhu, and M. Craven. Incorporating domain knowledge into topic modeling via dirichlet forest priors. In Proc. Int. Conf. on Machine Learning, pp. 25–32, 2009.
- [4] D. M. Blei. Probabilistic topic models. Communications of the ACM, 55(4):77–84, 2012. doi: 10.1145/2133806.2133826
- [5] D. M. Blei, A. Y. Ng, and M. I. Jordan. Latent Dirichlet Allocation. J. of Machine Learning Research, 3:993–1022, 2003.
- [6] M. Cavallo and Ç. Demiralp. A visual interaction framework for dimensionality reduction based data exploration. Proc. SIGCHI Conf. on Human Factors in Computing Systems, 2018.
- [7] Z. Chen, A. Mukherjee, B. Liu, M. Hsu, and M. Castellanos. Leveraging multi-domain prior knowledge in topic models. Proc. Int. Joint Conf. on Artificial Intelligence, pp. 2071–2077, 2013.
- [8] J. Choo, C. Lee, C. K. Reddy, and H. Park. UTOPIAN: User-driven topic modeling based on interactive nonnegative matrix factorization. IEEE Trans. on Visualization and Computer Graphics, 19(12):1992–2001, Dec. 2013.
- [9] C. Collins, N. Andrienko, T. Schreck, J. Yang, J. Choo, U. Engelke, A. Jena, and T. Dwyer. Guidance in the human–machine analytics process. Visual Informatics, 2(3):166–180, 2018.
- [10] W. Dou, X. Wang, R. Chang, and W. Ribarsky. ParallelTopics: A probabilistic approach to exploring document collections. In Conf. on Visual Analytics Science and Technology, pp. 231–240, 2011. doi: 10.1109/VAST.2011.6102461
- [11] W. Dou, L. Yu, X. Wang, Z. Ma, and W. Ribarsky. HierarchicalTopics: Visually exploring large text collections using topic hierarchies. IEEE Trans. on Visualization and Computer Graphics, 19(12):2002–2011, 2013.
- [12] M. Dowling, J. Wenskovitch, P. Hauck, A. Binford, N. Polys, and C. North. A bidirectional pipeline for semantic interaction. In Proc. Workshop on Machine Learning from User Interaction for Visualization and Analytics (at IEEE VIS 2018), vol. 11, 2018.
- [13] M. El-Assady, A. Hautli-Janisz, V. Gold, M. Butt, K. Holzinger, and D. Keim. Interactive visual analysis of transcribed multi-party discourse. In Proc. of Association for Computational Linguistics, ACL System Demonstrations, pp. 49–54. ACL, 2017. doi: 10.18653/v1/P17-4009
- [14] M. El-Assady, W. Jentner, F. Sperrle, R. Sevastjanova, A. Hautli-Janisz, M. Butt, and D. Keim. lingvis.io - A Linguistic Visual Analytics Framework. In Proc. of Association for Computational Linguistics, ACL System Demonstrations. ACL, 2019.
- [15] M. El-Assady, R. Sevastjanova, F. Sperrle, D. Keim, and C. Collins. Progressive learning of topic modeling parameters: A visual analytics framework. IEEE Trans. on Visualization and Computer Graphics, 24(1):382–391, 2018. doi: 10.1109/TVCG.2017.2745080
- [16] M. El-Assady, F. Sperrle, O. Deussen, D. Keim, and C. Collins. Visual Analytics for Topic Model Optimization based on User-Steerable Speculative Execution. IEEE Trans. on Visualization and Computer Graphics, 25(1):374–384, 2019. doi: 10.1109/TVCG.2018.2864769
- [17] M. El-Assady, F. Sperrle, R. Sevastjanova, M. Sedlmair, and D. Keim. LTMA: Layered topic matching for the comparative exploration, evaluation, and refinement of topic modeling results. In Int. Symp. on Big Data Visual and Immersive Analytics, pp. 1–10, Oct 2018. doi: 10.1109/BDVA.2018.8534018
- [18] A. Endert, L. Bradel, and C. North. Beyond control panels: Direct manipulation for visual analytics. IEEE Computer Graphics and Applications, 33(4):6–13, 2013.
- [19] A. Endert, R. Chang, C. North, and M. Zhou. Semantic interaction: Coupling cognition and computation through usable interactive analytics. IEEE Computer Graphics and Applications, 35(4):94–99, 2015.
- [20] A. Endert, P. Fiaux, and C. North. Semantic interaction for visual text analytics. In Proc. SIGCHI Conf. on Human factors in Computing Systems, pp. 473–482. ACM, 2012.
- [21] A. Endert, W. Ribarsky, C. Turkay, B. W. Wong, I. Nabney, I. D. Blanco, and F. Rossi. The state of the art in integrating machine learning into visual analytics. Computer Graphics Forum, 36(8):458–486, 2017. doi: 10.1111/cgf.13092
- [22] P. Federico, M. Wagner, A. Rind, A. Amor-Amorós, S. Miksch, and W. Aigner. The role of explicit knowledge: A conceptual model of knowledge-assisted visual analytics. In Proc. IEEE Conf. on Visual Analytics Science and Technology (VAST), pp. 92–103. IEEE, 2017.
- [23] C. Felix, S. Franconeri, and E. Bertini. Taking word clouds apart: An empirical investigation of the design space for keyword summaries. IEEE Trans. on Visualization and Computer Graphics, 24(1):657–666, 2018. doi: 10.1109/TVCG.2017.2746018
- [24] R. A. Finkel and J. L. Bentley. Quad trees a data structure for retrieval on composite keys. Acta Informatica, 4(1):1–9, Mar 1974. doi: 10.1007/BF00288933
- [25] S. Fortune. A sweepline algorithm for voronoi diagrams. Algorithmica, 2:153–174, 1987.
- [26] M. Gleicher. Considerations for Visualizing Comparison. IEEE Trans. on Visualization and Computer Graphics, 24(1):413–423, 1 2018. doi: 10.1109/TVCG.2017.2744199
- [27] M. Halkidi, Y. Batistakis, and M. Vazirgiannis. Clustering validity checking methods: part ii. ACM Sigmod Record, 31(3):19–27, 2002.
- [28] G. E. Hinton and S. T. Roweis. Stochastic neighbor embedding. In Advances in Neural Information Processing Systems, pp. 857–864, 2003.
- [29] E. Hoque and G. Carenini. ConVisIT: Interactive topic modeling for exploring asynchronous online conversations. In Proc. Int. Conf. on Intelligent User Interfaces, pp. 169–180. ACM, 2015.
- [30] Y. Hu, J. Boyd-Graber, B. Satinoff, and A. Smith. Interactive topic modeling. Machine learning, 95(3):423–469, 2014.
- [31] T. Isenberg, P. Isenberg, J. Chen, M. Sedlmair, and T. Möller. A systematic review on the practice of evaluating visualization. IEEE Trans. on Visualization and Computer Graphics, 19(12):2818–2827, Dec. 2013. doi: 10.1109/TVCG.2013.126
- [32] R. Iváncsy, A. Babos, and C. Legány. Analysis and extensions of popular clustering algorithms. In Int. Symposium of Hungarian Researchers on Computational Intelligence, 2005.
- [33] L. Jiang, S. Liu, and C. Chen. Recent research advances on interactive machine learning. J. of Visualization, pp. 1–17, 2018.
- [34] L. T. Kaastra and B. Fisher. Field experiment methodology for pair analytics. In Proc. Workshop on Beyond Time and Errors: Novel Evaluation Methods for Visualization (BELIV), pp. 152–159. ACM Press, 2014.
- [35] O. Levy and Y. Goldberg. Dependency-based word embeddings. In Proceedings of the Annual Meeting of the Association for Computational Linguistics (Volume 2: Short Papers), vol. 2, pp. 302–308, 2014.
- [36] C. Li, Y. Duan, H. Wang, Z. Zhang, A. Sun, and Z. Ma. Enhancing topic modeling for short texts with auxiliary word embeddings. ACM Trans. Inf. Syst., 36(2):11, 2017. doi: 10.1145/3091108
- [37] S. Liu, X. Wang, M. Liu, and J. Zhu. Towards better analysis of machine learning models: A visual analytics perspective. Visual Informatics, 1(1):48–56, 2017.
- [38] L. v. d. Maaten and G. Hinton. Visualizing data using t-SNE. J. of Machine Learning Research, 9(Nov):2579–2605, 2008.
- [39] C. D. Manning and H. Schütze. Foundations of Statistical Natural Language Processing. MIT Press, Cambridge, MA, USA, 1999.
- [40] H. Mehta, A. Chalbi, F. Chevalier, , and C. Collins. Datatours: A data narratives framework. In Proc. of IEEE Conf. on Information Visualization (InfoVis), Posters, 2017.
- [41] T. Mikolov, I. Sutskever, K. Chen, G. S. Corrado, and J. Dean. Distributed representations of words and phrases and their compositionality. In Proc. Advances in Neural Information Processing Systems, pp. 3111–3119, 2013.
- [42] C. E. Moody. Mixing Dirichlet topic models and word embeddings to make lda2vec. CoRR, abs/1605.02019, 2016.
- [43] D. Q. Nguyen, R. Billingsley, L. Du, and M. Johnson. Improving topic models with latent feature word representations. Trans. of the Association for Computational Linguistics, 3:299–313, 2015.
- [44] D. Park, S. Kim, J. Lee, J. Choo, N. Diakopoulos, and N. Elmqvist. ConceptVector: Text visual analytics via interactive lexicon building using word embedding. IEEE Trans. on Visualization and Computer Graphics, 24(1):361–370, 2017.
- [45] P. Rayson and R. Garside. Comparing corpora using frequency profiling. In Proc. Workshop on Comparing Corpora-Volume 9, pp. 1–6. Association for Computational Linguistics, 2000.
- [46] Y. Ren, R. Wang, and D. Ji. A topic-enhanced word embedding for Twitter sentiment classification. Inf. Sci., 369:188–198, 2016. doi: 10.1016/j.ins.2016.06.040
- [47] A. Sadeghi, C. Lange, M.-E. Vidal, and S. Auer. Integration of scholarly communication metadata using knowledge graphs. In Proc. Int. Con. on Theory and Practice of Digital Libraries, pp. 328–341. Springer, 2017.
- [48] A. I. Schein, A. Popescul, L. H. Ungar, and D. M. Pennock. Methods and metrics for cold-start recommendations. In Proc. of Int. Conf. on Research and Development in Information Retrieval, pp. 253–260. ACM, 2002.
- [49] R. Sevastjanova, F. Beck, B. Ell, C. Turkay, R. Henkin, M. Butt, D. A. Keim, and M. El-Assady. Going beyond visualization: Verbalization as complementary medium to explain machine learning models. In Proc. Workshop on Visualization for AI Explainability, 2018.
- [50] P. Y. Simard, S. Amershi, D. M. Chickering, A. E. Pelton, S. Ghorashi, C. Meek, G. Ramos, J. Suh, J. Verwey, M. Wang, et al. Machine teaching: A new paradigm for building machine learning systems. arXiv preprint arXiv:1707.06742, 2017.
- [51] K. Spärck Jones. A statistical interpretation of term specificity and its application in retrieval. J. of Documentation, 28(1):11–21, 1972.
- [52] R. Speer, J. Chin, and C. Havasi. ConceptNet 5.5: An open multilingual graph of general knowledge. In Proc. AAAI Conf. on Artificial Intelligence, 2017.
- [53] T. Spinner, U. Schlegel, H. Schäfer, and M. El-Assady. explAIner: A visual analytics framework for interactive and explainable machine learning. IEEE Trans. on Visualization and Computer Graphics, 2019.
- [54] D. Streeb, R. Kehlbeck, D. Jäckle, and M. El-Assady. Distances, neighborhoods, or dimensions? Projection literacy for the analysis of multivariate data. In Proc. Workshop on Visualization for AI Explainability, 2018.
- [55] X. Wang, S. Liu, J. Liu, J. Chen, J. Zhu, and B. Guo. TopicPanorama: A full picture of relevant topics. IEEE Trans. on Visualization and Computer Graphics, 2016. doi: 10.1109/TVCG.2016.2515592
- [56] Z. Wang, J. Zhang, J. Feng, and Z. Chen. Knowledge graph and text jointly embedding. In Proc. of Conf. on Empirical Methods in Natural Language Processing, pp. 1591–1601, 2014.
- [57] G. Wyszecki and W. Stiles. Color Science: Concepts and Methods, Quantitative Data and Formulas. Wiley, 1968.
- [58] H. Zhao, L. Du, and W. Buntine. A word embeddings informed focused topic model. In Proc. of The 9th Asian Conf. on Machine Learning (ACML), pp. 423–438, 2017.
- [59] Y. Zhao, G. Karypis, and U. Fayyad. Hierarchical clustering algorithms for document datasets. Data Mining and Knowledge Discovery, 10(2):141–168, 2005.