The Sloan Digital Sky Survey Reverberation Mapping Project: Improving Lag Detection with an Extended Multi-Year BaselineFacilities: Sloan, PS1, CFHT, Bok
Abstract
We investigate the effects of extended multi-year light curves (9-year photometry and 5-year spectroscopy) on the detection of time lags between the continuum variability and broad-line response of quasars at , and compare with the results using 4-year photometryspectroscopy presented in a companion paper. We demonstrate the benefits of the extended light curves in three cases: (1) lags that are too long to be detected by the shorter-duration data but can be detected with the extended data; (2) lags that are recovered by the extended light curves but missed in the shorter-duration data due to insufficient light curve quality; and (3) lags for different broad line species in the same object. These examples demonstrate the importance of long-term monitoring for reverberation mapping to detect lags for luminous quasars at high-redshift, and the expected performance of the final dataset from the Sloan Digital Sky Survey Reverberation Mapping project that will have 11-year photometric and 7-year spectroscopic baselines.
Keywords:
black hole physics — galaxies: active — line: profiles — quasars: general – surveysI Introduction
Reverberation mapping (Blandford & McKee 1982; Peterson 2014, RM, e.g.,) is a technique to measure the time delay between the continuum variability and the response of the broad emission lines powered by the continuum in efficiently accreting supermassive black holes (referred to as “quasars” throughout this paper). This time delay reflects the light travel time from the innermost region around the black hole to the broad-line region (BLR) and hence measures a characteristic size for the BLR. Combined with the virial velocity of the BLR inferred from the width of the broad emission lines, RM is used as the primary method to estimate the black hole masses of distant quasars (Peterson 2014).
Traditionally, RM programs require dedicated imaging and spectroscopic resources, usually obtained from small telescopes with guaranteed access, to monitor individual objects over an extended period of time (typically several months) where the variability and the lag can be temporally resolved. Because of the required heavy commitment of monitoring resources and the serial mode of observing, past RM work has been mostly limited to the low- and low-luminosity regime of quasars, targeting the most variable nearby systems for which RM is most likely to succeed (Kaspi et al. 2000; Peterson et al. 2004; Barth et al. 2015; Du et al. 2016, e.g.,), with a few exceptions for high-redshift and high-luminosity quasars (Kaspi et al. 2007; Trevese et al. 2014; Lira et al. 2018; Czerny et al. 2019, e.g.,). To expand the RM sample to a broader parameter space of quasars including the high- and high-luminosity regime, the most efficient approach is to monitor a significant number of quasars simultaneously with wide-field imaging and multi-object spectroscopy.
The Sloan Digital Sky Survey Reverberation Mapping (SDSS-RM) project is a dedicated multi-object optical reverberation mapping program (Shen et al. 2015) that has been monitoring a single 7 field since 2014, using the SDSS Baryon Oscillation Spectroscopic Survey (Eisenstein et al. 2011; Dawson et al. 2013, BOSS,) spectrographs (Smee et al. 2013) on the 2.5m SDSS telescope (Gunn et al. 2006) at Apache Point Observatory. Accompanying photometric data in the and bands are acquired with the 3.6 m Canada-France-Hawaii Telescope (CFHT) and the Steward Observatory 2.3 m Bok telescope. By the end of SDSS-RM in 2020, the spectroscopic baseline will span 7 years, with cadences ranging from 4-5 days in the first season to monthly in the last few seasons (2018-2020); the photometric baseline will span 11 years when including the 2010-2013 photometric light curves from the Pan-STARRS 1 (Kaiser et al. 2010, PS1,) Medium Deep survey that covers the entire SDSS-RM field. The SDSS-RM sample includes 849 quasars with and without any constraints on quasar properties (Shen et al. 2019, for detailed sample properties, see). The main purpose of SDSS-RM is to measure RM lags of different broad lines covered by optical spectroscopy across the full range of quasar luminosity and redshift probed by the sample.
SDSS-RM has successfully measured short () lags for the low-ionization broad lines (Shen et al. 2016; Grier et al. 2017, e.g., H, H, and Mg ii,) based on the 2014 data. In a companion paper (Grier et al. 2019, hereafter Paper I), we reported the first results on C IV lags using four years (2014-2018) of imaging and spectroscopy from SDSS-RM (and for Mg ii lags in Homayouni, Y., et al., in prep), where the lags are typically longer than one season in the observed frame. In this work, we investigate the benefits of extending the baseline for the detection of lags. Because the calibration and preparation of multi-year light curves for lag measurements is computationally demanding (see §II), we highlight only a handful of selected objects to demonstrate the power of extended baselines. A complete investigation of long lags for the full SDSS-RM sample will be reported in future work. We describe the extended light curve data used in §II, present the lag measurements in §III, and discuss our results and conclude in §IV. Luminosities are calculated assuming a flat CDM cosmology with parameters , , and km s-1 Mpc-1.
II Data
The SDSS-RM monitoring data include the multi-epoch spectroscopy taken by the BOSS spectrographs, as well as photometric light curves from the CFHT and Bok telescopes. The spectroscopic data are first re-processed with a custom pipeline to improve flux calibration (Shen et al. 2015), followed by another recalibration process called PrepSpec to further enhance spectrophotometric accuracy using the flux of the narrow emission lines (Shen et al. 2016; Grier et al. 2017, e.g.,). PrepSpec also produces the broad-line light curves and the RMS spectra computed from the multi-epoch spectroscopy, which are used in subsequent analysis.
The photometric data from Bok and CFHT are combined with the synthetic and photometry computed from SDSS spectroscopy. The light curve merging is performed using the Continuum REprocessing AGN MCMC (CREAM) software developed by Starkey et al. 2016 to produce the continuum light curves for the lag measurements. During the CREAM merging process, all datasets in both ( and ) filters are scaled to a common flux scale of the -band synthetic photometry computed from SDSS spectra, and the uncertainties of the flux measurements for both the continuum and broad-line light curves are adjusted automatically to account for possible underestimation of the flux errors. CREAM typically increases the flux uncertainties by a fraction of less than , indicating that the original uncertainties are usually reasonable, but we prefer the more conservative flux uncertainties reported by CREAM. More technical details of the CREAM procedure can be found in Paper I. The PS1 data are not combined using CREAM with the rest of the light curve because of the lack of overlap in time coverage, and are simply converted to flux density at the effective wavelength of band. There is no noticeable offset in the -band light curve between the PS1 and CREAM-merged datasets based on standard stars. We use the combined 9-yr -band data as our fiducial continuum light curve to measure the light curve statistics and broad-line lags.

Paper I analyzed the 4-year data set for a sample of 349 quasars with C IV coverage () and significant line variability detected by PrepSpec. We are in the process of merging light curves with the latest compilation of data (including additional years of spectroscopy and photometry), and the CREAM step is the most computationally demanding step in the process. We thus focus this study on a handful of cases of particular interest for which we have prioritized the light curve processing, using 5 years of spectroscopy (2014-2018) and 9 years of photometry (2010-2018). The leading photometric light curves from PS1 that do not have accompanying spectroscopy effectively extend the baseline to 9 years. This work uses the PS1 data presented by Shen et al. 2019 for the lag analysis.
III Lag Measurements
With the CREAM-merged light curves, we follow the procedure outlined in Paper I to measure the lag between the continuum and the broad-line light curves. We have performed a systematic comparison (Li et al. 2019) of the performance of several commonly-adopted methods to measure the lag, including the Interpolated Cross-Correlation Function (Gaskell & Peterson 1987, ICCF,), -Transformed Discrete Correlation Function (Alexander 2013, ZDCF,), and JAVELIN (Zu et al. 2011). For data with quality similar to SDSS-RM data, JAVELIN provides the best performance in terms of lag recovery and the fidelity of the lag uncertainties. We therefore adopt the lags measured by JAVELIN as our fiducial lags. However, ICCF has been the standard technique to measure RM lags in the literature, so we also present results from the ICCF approach to validate the reported lags.
We are particularly interested in cases where the extended monitoring data improve the lag detection over the 4-year data used in Paper I. More data points and extended baseline enhances the correlation between the light curves, mitigates aliases from insufficient sampling, and allows us to measure lags that are too long to be detectable by the shorter-duration RM data. We here present results for three sources selected from the 349 quasars in Paper I to demonstrate the power of the extended light curves. These were chosen from a handful of objects with well behaved 4-yr light curves for which we compiled the extended light curves and search for lags. We imposed no additional criteria on these measurements for selection — for example, we did not require that the lags are consistent with the expectation from the preliminary C IV relation in Paper I.
The continuum and emission-line light curves for these examples are shown in Fig. 1; we discuss these individual cases in the following subsections. In all cases, the variability of the lines is well detected, and we show the mean and RMS spectra of these examples in Fig. 2.
III.1 RM 363: detecting longer C IV lags
The range of lag sensitivity of a campaign is limited by the baseline of the campaign; the delayed broad-line light curve must still have substantial overlap with the leading continuum light curve in order to cross-correlate the two light curves. The data examined in Paper I span only 4 years; Paper I was thus limited to lags shorter than about 700 days in the observed frame.
Here, with the 9-year effective baseline, we extend our lag search to 1800 days (roughly of the baseline), suitable for detecting longer lags in the more luminous and higher redshift subset of the SDSS-RM sample.
Fig. 3 (top) presents such an example: we measure a C IV lag in RM 363, one of the most luminous quasars in the SDSS-RM sample, having a bolometric luminosity of at . The measured C IV lag is more than 1000 days in the observed frame due to the time dilation. This example demonstrates the necessity of long-term monitoring for the detection of multi-year lags. In addition, the typical variability amplitude of this high-redshift quasar is only (see Fig. 1), indicating that high S/N spectroscopy is required to detect the line variability.
III.2 RM 372: mitigating for aliases
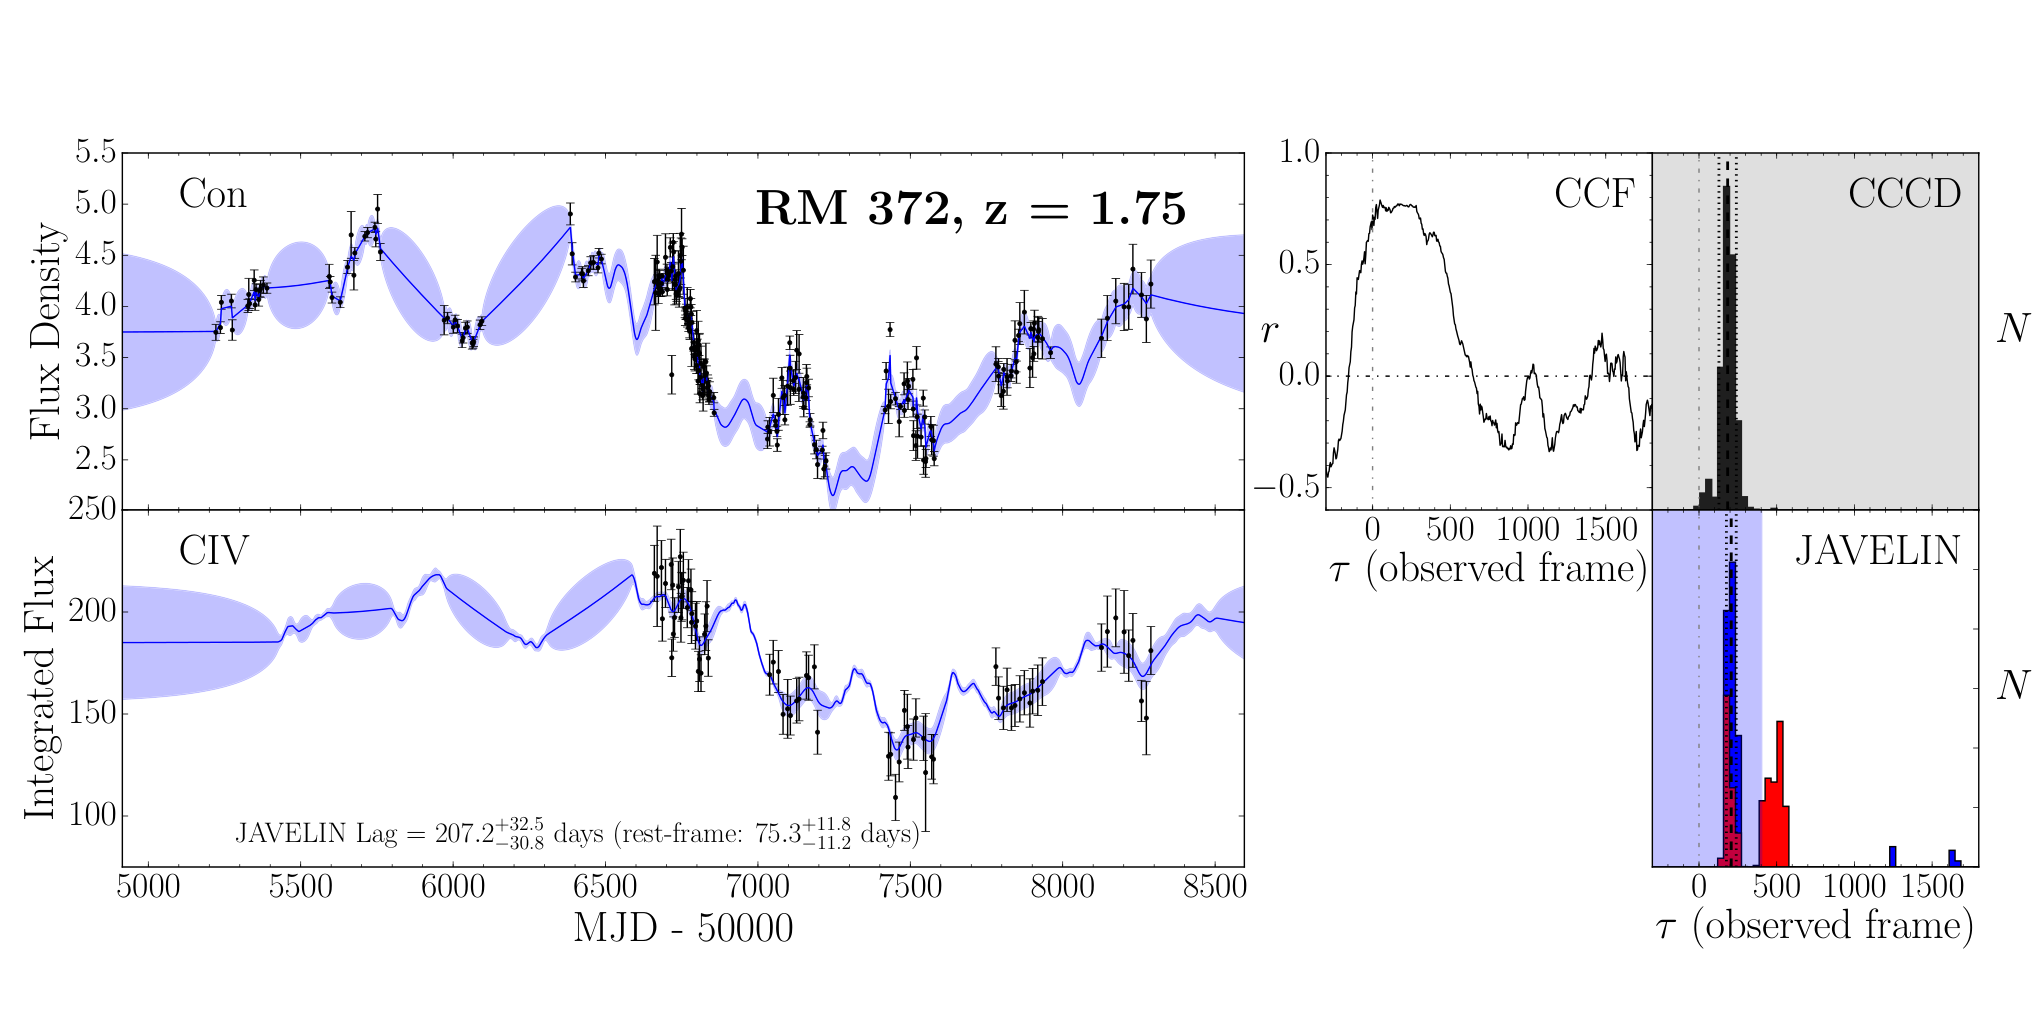
Fig. 3 (bottom) presents our RM analysis for RM 372 at . This source was analyzed in Paper I with the 4-year light curves, and a C IV lag was not robustly detected due to insufficient light curve quality. With the addition of the 5th year of spectroscopy and the 4 years of PS1 monitoring, we were able to recover an observed-frame lag of days.
The C IV line light curve is shifted by about 6 months from the continuum light curve, resulting in little overlap in the two light curves. The light curves have smooth variations over multi-year timescales, and the correlations between the continuum and line light curves are strongly suppressed on timescales longer and shorter than months, allowing a time lag of about the length of the seasonal gap to be robustly detected. This example demonstrates the power of extended-baseline light curves in distinguishing between alias lags and true lags, and shows that when certain conditions are met, we are able to measure lags that are usually difficult to measure when there are regular seasonal gaps. However, if the variations dominating the correlation in the light curves are on timescales shorter than yr, the seasonal gaps will likely lead to unreliable lag detection or even no detection (Grier et al. 2008, e.g.,).
III.3 RM 651: lags from multiple lines
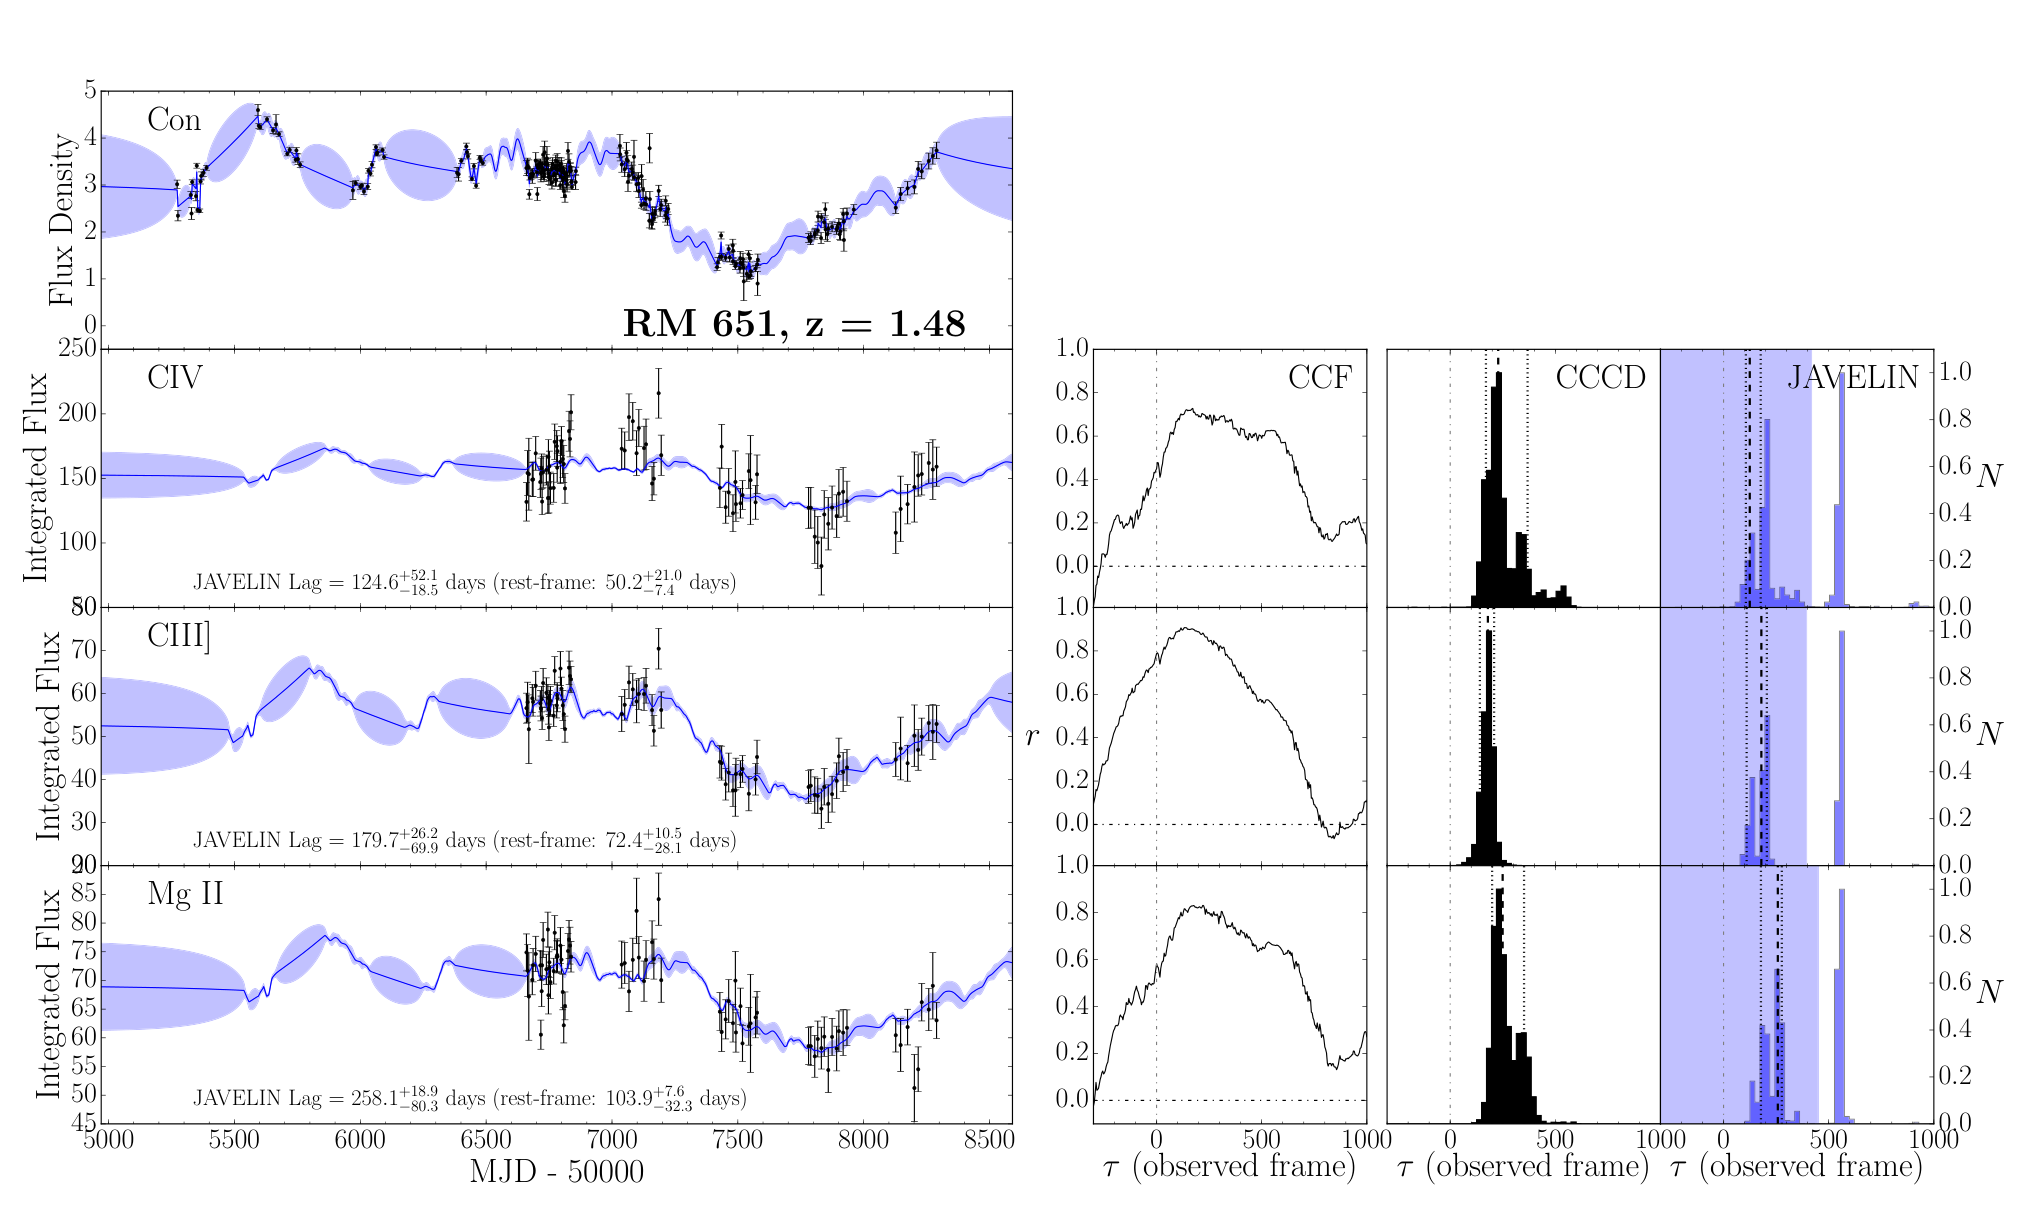
Given the broad spectral coverage of SDSS, we will be able to measure lags from several broad lines in a single object, and explore the stratification of the broad-line region (Peterson & Wandel 1999, e.g.,). Fig. 4 presents the analysis for RM 651 at , where lags are successfully detected for three different lines: C IV, C III] and Mg ii. For C III], PrepSpec measures the line flux from the complex of C III], Al III and Si III], where C III] dominates the flux. For this particular object, there is some evidence from the JAVELIN analysis that the C IV lag C III] lag Mg ii lag, which is suggestive of BLR stratification. However, the lag uncertainties are large, and the line widths measured from the rms spectrum do not differ significantly for these three lines (see Table 1). Therefore we cannot confirm BLR stratification for this example.
The Mg ii variability amplitude in this object is substantially lower than that of the continuum and the other two lines (see Fig. 1). This behavior is generally consistent with the lower variability of Mg ii compared to other major broad emission lines (Sun et al. 2015, e.g.,), and also expectations from photoionization models (Guo et al. 2019, e.g.,).
IV Discussion and Conclusions
Using a 9-year photometric baseline and 5-year spectroscopic baseline, we have presented several examples of lag detections in high-redshift () quasars from the SDSS-RM project. We highlighted three objects: (1) a luminous quasar with an observed-frame C IV lag of more than 1000 days; (2) a quasar with a lag that falls within the seasonal gap of the light curves that was recovered by the extended light curves but missed in the earlier analysis based on 4-year light curves (Paper I); and (3) a quasar with well-detected lags for three broad lines (C IV, C III] and Mg ii).
Fig. 5 displays the locations of our measured lags in the radius-luminosity () plane. These lags are consistent with the best-fit relation for C IV based on the full sample in Paper I. However, we caution that the relation for C IV is still poorly constrained at the moment, a situation that can only be improved by obtaining more C IV lag measurements over a large dynamic range in quasar luminosity (e.g., Lira et al. 2018; Hoormann et al. 2019, Paper I).
This work demonstrates the benefits, and sometimes the necessity, of having long baselines of multi-season RM data to detect long lags robustly in high-redshift and high luminosity quasars. Our preliminary analysis for a small number of objects provides a glimpse of the expected lags from the final data set of SDSS-RM, which will include two more years of photometric and spectroscopic monitoring. With the final extended dataset, we expect to detect lags in the most luminous quasars in the SDSS-RM sample, thus further expanding the dynamic range in luminosity to constrain the relation for C IV. These results also demonstrate that lag measurements for multiple lines in the same object are possible with SDSS-RM data for high-redshift quasars, and hint at their possible utility in evaluating BLR stratification models.
Our results here (and in Paper I) provide strong endorsement of current and future multiplexing spectroscopic RM programs, such as the Black Hole Mapper program in SDSS-V (Kollmeier et al. 2017), the OzDES RM program (King et al. 2015), the 4MOST RM program (Swann et al. 2019), and the Maunakea Spectroscopic Explorer RM program (The MSE Science Team et al. 2019).
| RMID | SDSS name | line | VP | |||||
|---|---|---|---|---|---|---|---|---|
| hhmmss.ssddmmss.s | [] | (days) | (days) | () | () | |||
| 363 | 142113.30524929.9 | 2.635 | 46.50 | C IV | ||||
| 372 | 141236.48540152.1 | 1.745 | 45.62 | C IV | ||||
| 651 | 142149.30521427.8 | 1.486 | 45.42a | C IV | ||||
| C III] | ||||||||
| Mg ii |
References
- Alexander (2013) Alexander, T. 2013, arXiv e-prints, arXiv:1302.1508
- Barth et al. (2015) Barth, A. J., Bennert, V. N., Canalizo, G., et al. 2015, ApJS, 217, 26
- Blandford & McKee (1982) Blandford, R. D., & McKee, C. F. 1982, ApJ, 255, 419
- Czerny et al. (2019) Czerny, B., Olejak, A., Ralowski, M., et al. 2019, arXiv e-prints, arXiv:1901.09757
- Dawson et al. (2013) Dawson, K. S., Schlegel, D. J., Ahn, C. P., et al. 2013, AJ, 145, 10
- Du et al. (2016) Du, P., Lu, K.-X., Zhang, Z.-X., et al. 2016, ApJ, 825, 126
- Eisenstein et al. (2011) Eisenstein, D. J., Weinberg, D. H., Agol, E., et al. 2011, AJ, 142, 72
- Gaskell & Peterson (1987) Gaskell, C. M., & Peterson, B. M. 1987, ApJS, 65, 1
- Grier et al. (2008) Grier, C. J., Peterson, B. M., Bentz, M. C., et al. 2008, ApJ, 688, 837
- Grier et al. (2017) Grier, C. J., Trump, J. R., Shen, Y., et al. 2017, ApJ, 851, 21
- Grier et al. (2019) Grier, C. J., Shen, Y., Horne, K., et al. 2019, arXiv e-prints, arXiv:1904.03199
- Gunn et al. (2006) Gunn, J. E., Siegmund, W. A., Mannery, E. J., et al. 2006, AJ, 131, 2332
- Guo et al. (2019) Guo, H., Shen, Y., He, Z., et al. 2019, arXiv e-prints, arXiv:1907.06669
- Hoormann et al. (2019) Hoormann, J. K., Martini, P., Davis, T. M., et al. 2019, MNRAS, 487, 3650
- Kaiser et al. (2010) Kaiser, N., Burgett, W., Chambers, K., et al. 2010, in Society of Photo-Optical Instrumentation Engineers (SPIE) Conference Series, Vol. 7733, Society of Photo-Optical Instrumentation Engineers (SPIE) Conference Series, 0
- Kaspi et al. (2007) Kaspi, S., Brandt, W. N., Maoz, D., et al. 2007, ApJ, 659, 997
- Kaspi et al. (2000) Kaspi, S., Smith, P. S., Netzer, H., et al. 2000, ApJ, 533, 631
- King et al. (2015) King, A. L., Martini, P., Davis, T. M., et al. 2015, MNRAS, 453, 1701
- Kollmeier et al. (2017) Kollmeier, J. A., Zasowski, G., Rix, H.-W., et al. 2017, ArXiv e-prints, arXiv:1711.03234
- Lira et al. (2018) Lira, P., Kaspi, S., Netzer, H., et al. 2018, ApJ, 865, 56
- Peterson (2014) Peterson, B. M. 2014, Space Science Reviews, 183, 253
- Peterson & Wandel (1999) Peterson, B. M., & Wandel, A. 1999, ApJ, 521, L95
- Peterson et al. (2004) Peterson, B. M., Ferrarese, L., Gilbert, K. M., et al. 2004, ApJ, 613, 682
- Shen et al. (2015) Shen, Y., Brandt, W. N., Dawson, K. S., et al. 2015, ApJS, 216, 4
- Shen et al. (2016) Shen, Y., Horne, K., Grier, C. J., et al. 2016, ApJ, 818, 30
- Shen et al. (2019) Shen, Y., Hall, P. B., Horne, K., et al. 2019, ApJS, 241, 34
- Smee et al. (2013) Smee, S. A., Gunn, J. E., Uomoto, A., et al. 2013, AJ, 146, 32
- Starkey et al. (2016) Starkey, D. A., Horne, K., & Villforth, C. 2016, MNRAS, 456, 1960
- Sun et al. (2015) Sun, M., Trump, J. R., Shen, Y., et al. 2015, ApJ, 811, 42
- Swann et al. (2019) Swann, E., Sullivan, M., Carrick, J., et al. 2019, The Messenger, 175, 58
- The MSE Science Team et al. (2019) The MSE Science Team, Babusiaux, C., Bergemann, M., et al. 2019, arXiv e-prints, arXiv:1904.04907
- Trevese et al. (2014) Trevese, D., Perna, M., Vagnetti, F., Saturni, F. G., & Dadina, M. 2014, ApJ, 795, 164
- Zu et al. (2011) Zu, Y., Kochanek, C. S., & Peterson, B. M. 2011, ApJ, 735, 80